


Introduction
Currently, more than 1800 extrasolar planets have already been confirmed since the first extrasolar planet was discovered (Mayor & Queloz Reference Mayor and Queloz1995). In the series of searching for second earths, exoplanets in the habitable zone, where the planets can sustain liquid water, have been detected in succession (Anglada-Escudé et al. Reference Anglada-Escudé2013; Broucki et al. Reference Borucki2013). The habitable zone is one requirement to guess whether a planet has life or not. Another index is to identify biosignatures or biomarkers, which are trace of life from reflection spectra of extrasolar planets. Spectral features which derive from photosynthetic activities can be biosignatures. The vegetation red edge is one of them (Seager et al. Reference Seager, Turner, Schafer and Ford2005; Kiang et al. Reference Kiang, Siefert, Govindjee and Blankenship2007).
Nowadays, developments of quantum chemical calculations permit us to evaluate highly accurate absorption spectra for photosynthetic pigments. Photosystem is a very complicated system composed of protein complexes, and they contain many types of the pigments. Using theoretical approaches, each absorption feature of the specific pigment is easily calculated only assuming the molecular structure. In principle, there are possibilities to optimize a photosystem at the atomic level. Therefore, it is a great challenge to clarify the light absorption process in photosystems on exoplanet situations. For example, we can construct photosystems whose pigment arrangements and molecular structures are modified even though these complexes are difficult to be formed experimentally. It is beyond the scope of this paper, but these theoretical approaches will be very significant to predict novel photosystems.
The major photosynthetic pigments found in organisms on the Earth are chlorophylls (Chls), bacteriochlorophylls (BChls) and carotenoids. While Chls are contained in oxygenic photosynthetic organisms such as plants and cyanobacteria, BChls are major pigments in the anoxygenic photosynthetic organisms such as purple bacteria, green sulphur bacteria, halobacteria (Canfield et al. Reference Canfield, Rosing and Bjerrum2006; Olson Reference Olson2006). One role of carotenoids is quenching excited species such as singlet oxygen in addition to the light harvesting function, but the main light harvesting pigments in photosystems are Chls and BChls.
In this paper, the absorption spectra of six photosynthetic pigments were calculated at a quantum chemical method of the density functional theory (DFT). We investigated four Chl compounds: Chl a, Chl b, Chl d and Chl f and two BChl compounds: BChl a and BChl b. Their absorption efficiencies were evaluated using some stellar spectra from F to M-type stars, and we investigated how the pigments which exist on the Earth absorb light efficiently on the environments. It is noted that actual efficiencies in photosynthesis are largely affected by other important factors such as atmospheric composition, structures of canopy and leaf, however, as a first step, direct light absorption efficiencies for the photosynthetic pigments are investigated.
Methods
Quantum chemical calculations were performed for the six major photosynthetic pigments. First, full geometry optimizations were carried out at DFT level using the B3LYP functional (Becke Reference Becke1988). 6-31G(d) basis sets were used for all atoms. The initial structures of Chl a, Chl b, BChl a and BChl b were taken from X-ray structures from Thermosynechococcus vulcanus (Umena et al. Reference Umena, Kawakami, Shen and Kamiya2011), Pisum sativum (Standfuss et al. Reference Standfuss, Terwisscha van Scheltinga, Lamborghini and Kühlbrandt2005), Rhodopseudomonas acidophila (Papiz et al. Reference Papiz, Prince, Howard, Cogdell and Isaacs2003) and Rhodopseudomonas viridis (Lancaster & Michel Reference Lancaster and Michel1999), respectively. The structures of Chl d and f were obtained by substituting the Chl a structure. Absorption spectra were calculated based on the time-dependent density functional theory (TDDFT) (Marques & Gross Reference Marques and Gross2004). The solvent effect of methanol was considered by the polarizable continuum model (PCM) methodology (Miertus et al. Reference Miertus, Scrocco and Tomasi1981). Other theoretical conditions used were the same as the geometry optimization calculations. All the calculations were performed using the Gaussian 09 quantum chemistry programme package (Frisch et al. Reference Frisch2009). After obtaining the absorption spectra, we evaluated the absorption efficiency χphoton as described below. χphoton is calculated using the photon flux spectrum from star.
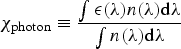 $${\rm \chi} _{{\rm photon}} \equiv \displaystyle{{\int {\rm \epsilon} ({\rm \lambda} )n({\rm \lambda} ){\rm d\lambda}} \over {\int n({\rm \lambda} ){\rm d\lambda}}} $$
where ε(λ) is the absorption strength of the pigment at wavelength λ, and n(λ)is the number density of photon at λ of stellar spectrum. Calculated TDDFT absorption spectra were used for ε(λ) after a correction to minimize a constant theoretical error. For the efficiency calculation, photon and energy representations exist. We adopted the photon representation because it is more suitable for describing efficiency of the redox reactions in photosynthesis (Chen & Blankenship Reference Chen and Blankenship2011). The spectra of the seven stars were used as n(λ): HD128167 (F2V star), HD114710 (G0V low-activity star), HD206860 (G0V high-activity star), the Sun (G2V star), HD22049 (K2V star), AD Leo (M4.5V star) and GJ644 (M3Ve star). The fluxes for each star were obtained as they would be received at the top of the atmosphere of a planet in the habitable zone (the Sun: Wehrli Reference Wehrli1985, AD Leo and GJ644: Segura et al. Reference Segura, Kasting, Meadows, Cohen, Scalo, Crisp, Butler and Tinetti2005, the others: Segura et al. Reference Segura, Krelove, Kasting, Sommerlatt, Meadows, Crisp, Cohen and Mlawer2003). The integration range is from 200 to 10 000 nm.
Results and discussions
The DFT-optimized structures of the photosynthetic pigments are shown in Fig. 1. Calculated absorption spectra for the pigments are also shown in Fig. 2. Absorption bands are called the Q y , the Q x and Soret (or the B) in order of wavelength. Excited energies in the Soret region are quenched quickly to the Q y energy level. Light energies are transferred to photosynthetic reaction centres where redox reactions take place. In the case of oxygenic photosynthesis, water molecules are oxidized to oxygen molecules in photosystem II. Absorption spectra are different depending on the pigment types. Generally, absorption of BChls is more red-shifted than those of Chls. Among Chls, Chl d and Chl f absorb longer wavelength radiation compared to normal Chls (Chl a and Chl b). The TDDFT calculated spectra were qualitatively reproduced the experimental spectra. However, there still remains differences between the theoretical and the experimental results (Table 1). In order to minimize the systematic errors, the absorption wavelengths at the Q y and Soret peak tops were modified separately using calibration lines in Fig. 3. In the case of the Q x , the same treatments are applied only in BChls, because the peaks of the Q x bands are not often discerned clearly in Chls. Figure 4 shows the energy correction for the absorption spectra of Chl a. Absorption energy corrections were also applied to the other pigments. For the correction of Soret band of Chl d, an average of absorption peak tops was used for the fitting. It is noted that experimental spectra of Chls were measured in methanol solvents (Chen et al. Reference Chen, Eggink, Hoober and Larkum2005, Reference Chen, Schliep, Willows, Cai, Neilan and Scheer2010; Chen & Blankenship Reference Chen and Blankenship2011; Li et al. Reference Li, Scales, Blankenship, Willows and Chen2012), and those of BChls were measured in mixtures of methanol, acetonitrile, ethyl acetate and water solvents (Frigaard et al. Reference Frigaard, Larsen and Cox1996). The peak wavelengths and the maximum absorption of each band after the calibrations are shown in Table 2. The two peak wavelengths of BChls are more separated than those of Chls. The ratios of the integral of Soret band over wavelength to that of the Q y are shown, to investigate which band contributes to the absorption. When discussing the absorption efficiency in the next paragraph, these values works as indicators.
The structures of the photosynthetic pigment which are optimized by DFT calculations. Chl a, Chl b, Chl d, Chl f, BChl a and BChl b are shown.

Calculated absorption spectra of pigments. The spectra of Chl a, Chl b, Chl d, Chl f, BChl a, BChl b are shown. These calculations were performed in methanol solvents. The positions of the main absorption bands in BChl a are labelled. These are called as the Q y , the Q x and Soret bands, in order of decreasing wavelength.

The calibration lines between the TDDFT and the experimental peaks of absorption bands in Table 1. (a) The Q y band. (b) Soret band.

Absorption spectrum from the TDDFT calculation (solid line) and the modified spectrum (dashed line). The modified spectra were obtained from Fig. 3. The spectra of Chl a are shown here.

The calculated and the experimental wavelengths which exhibit the peaks in the Qy and Soret bands. Those values in the Qx bands are also shown only in BChls. The calibration lines in Fig. 2 are shown as y = 0.8521x+129.99 in the Qy bands and y = 0.5754x+168.21 in Soret bands, when x, y are the wavelengths from the TDDFT calculations and the experiments, respectively. In the case of the Qx bands in the two BChls, y = 2.9208x−1132.8

The peak wavelengths and the maximum absorption of Soret and the Qy bands in the six pigments. The values of the Qx are shown only in BChls. The peak wavelength gaps between Soret and the Qy bands are also revealed. The ratios of the integral of Soret band over wavelength to that of the Qy are shown

Using the corrected spectra, the absorption efficiencies were evaluated as shown in Fig. 5. The efficiencies were calculated for each absorption band of the pigments. From Fig. 5, we can see how these bands contribute to the efficiency. For example, if the ratio of the efficiency of the Q y band to that of Soret is approaching to 1.0, the main contribution to the light absorption comes from the Q y , not from Soret (see Fig. 5(b)). The seven stellar spectra were used to calculate the efficiencies. In Fig. 6, the normalized stellar spectra and the calculated absorption spectra of the pigments are shown. As seen in Fig. 6, the fluxes in the 300–900 nm region decrease from F2V to M3Ve. Therefore, the efficiencies are expected to decrease as the star becomes cooler. Actually, the tendency is observed clearly with reference to the Sun values. For Chl a, efficiencies in F2V and M3Ve stars are calculated to be 1.478 and 0.068 times as much as that in the Sun. Because of the fluxes in the five high temperate stars like F, G and K stars are greater than those in the two M stars, the efficiencies in the two M stars are significantly smaller. In the Soret band regions in the five stars, the large flux differences are observed according to the stellar types. Reflecting the differences, values of Soret vary largely than those in the Q y . In comparison with these five high temperature stars, in the two M stars, the fluxes are almost negligible in the Soret band regions as shown in Fig. 6. It is understood that the ratio of the efficiency of the Q y band to that of Soret is close to 1.0 as shown in Fig. 5(b). Chl b is the exceptional case, because the ratio of absorption intensities in Soret to the Q y band is larger (4.82 as shown in Table 2). Therefore, the small ratio of the Q y to Soret is observed for Chl b in M stars.
(a) The absorption efficiencies χphoton (%). As stellar spectra, the seven spectra were used: F2V, G0V low-activity, G0V high-activity, K2V, M4.5V and M3Ve stars and the Sun. The six pigments are investigated: Chl a, Chl b, Chl d, Chl f, BChl a and BChl b in order left to right, in both (a) and (b). The efficiencies are calculated using each band. In BChls, the efficiencies are also calculated from the Q x . (b) The ratio of the efficiency using the Q y to that using Soret.

The calculated absorption spectra and the normalized stellar spectra. The absorption spectra of (a) Chl a and Chl b, (b) Chl d and Chl f and (c) BChl a and BChl b are shown. The vertical axis corresponds to the oscillator strength. The seven stellar spectra are also shown: F2V, G0V low-activity, G0V high-activity, K2V, M4.5V and M3Ve stars and the Sun. The spectrum of the Sun is normalized so that the maximum value is 1.0. The other spectra are plotted as the integrated areas from 200 to 10 000 nm are equal to the area of the normalized spectrum of the Sun.

In the Q x regions in BChls (Fig. 6(c)), the large flux difference between the five high temperature stars and the late M stars is observed. The contribution of the Q x can be seen, when the ratios of the efficiency of the Q x to that of all the three bands are calculated. The ratios in the five stars are around 0.22, while those in the two M stars are 0.06–0.07, reflecting the great difference.
Absorption spectra of BChl a and b are broader compared to Chls. The gaps in the peak wavelengths are 198–290 and 404–421 nm in Chls and BChls, respectively, as shown in Table 1. In the Q y , BChls absorb longer wavelength radiation than Chls (Chls: 637–703 nm, BChls: 776–800 nm), and the radiation also decreases in the region as seen in Fig. 6. Therefore, as shown in Fig. 5, Chls are more efficient than BChls in the high temperature stars radiation, and vice versa, BChls are more efficient than Chls in lower temperature stars, M stars. In lower temperature stars like M stars, Soret bands do not contribute to the efficiencies anymore, and the Q y bands mainly contribute to the light absorption. BChls become more efficient in M stars than Chls, reflecting the larger spectral overlaps in the Q y band regions. On the other hand, shorter wavelength radiation is absorbed for BChls in the Soret band than for Chls. The maximum values of Soret bands are 408–439 nm in Chls, while those are 371–380 nm in BChls. In the five high temperature stars the fluxes also become small, blueward of the 4000 Å break, shorter than 400 nm. Therefore, BChls receive less photons, although Chls absorb more due to the large fluxes redward of the 4000 Å break. Actually, the efficiencies in BChls are lower than those in Chls in the five high temperature stars radiation. From F to M star, the efficiencies of the Soret region decrease definitely. In terms of receiving more photons in the Soret region, BChls have a disadvantage compared to Chls because of the small fluxes blueward of the 4000 Å break. Because BChls are considered to emerge on the Earth prior to Chls, the organisms could become able to receive drastically more radiation at a certain time using Chls.
Conclusion
We have investigated how the photosynthetic organisms can absorb light from their host star and how the absorption efficiencies change depending on the photosynthetic pigments and star types. Six photosynthetic pigments were examined under real stellar radiation. Absorption spectra of the pigments were calculated using a highly accurate quantum mechanical level and energy corrections were performed to minimize the theoretical error. Calculated efficiencies increased as higher the temperature of host star from M to F star. Contributions from the Q y are almost saturated for higher temperature stars, K to F stars. In lower temperature stars like M stars, Soret bands do not contribute to the efficiencies anymore, and the Q y bands mainly contribute to the light absorption. BChls become more efficient in M stars than Chls, due to the larger spectral overlaps in the Q y band regions. On the other hand, contributions from Soret band increased, and the efficiencies of Chls are higher than BChls in the higher temperature stars, reflecting redward of the 4000 Å break.
Acknowledgements
The numerical calculations for the present study have been carried out under the “Interdisciplinary Computational Science Program” at the Center for Computational Sciences, University of Tsukuba. This work was supported by (1) Grant-in-Aid for JSPS Fellows (Y.K. 26. 1303) from Japan Society for the Promotion of Science (JSPS) and (2) the HAPACS Project for advanced interdisciplinary computational sciences by exa-scale computing technology.
Supplementary materials
For supplementary material for this article, please visit http://journals.cambridge.org/IJA



