I. INTRODUCTION
Quantum dots (QDs) are particularly interesting owing to their unique physical properties resulting from three-dimensional carrier confinement, and have promising applications in high-performance optoelectronic devices such as single-electron transistors,Reference Koppens, Buizert, Tielrooij, Vink, Nowack, Meunier, Kouwenhoven and Vandersypen1 lasers,Reference Quarterman, Wilcox, Apostolopoulos, Mihoubi, Elsmere, Farrer, Ritchie and Tropper2 light-emitting diodes (LEDs),Reference Anikeeva, Halpert, Bawendi and Bulovic3 infrared photodetectors,Reference Lim, Tsao, Zhang and Razeghi4 and solar cells.Reference Guimard, Morihara, Bordel, Tanabe, Wakayama, Nishioka and Arakawa5 For these applications, the study of carrier dynamics in QDs as well as the precise control of shape and size distribution of QDs is very important for improving the performance of optoelectronic devices. Thus far, most studies on semiconductor QDs have focused on various types of III-V QDs.Reference Lei, Notthoff, Offer, Meier, Lorke, Jagadish and Wieck6,Reference De and Pryor7 In contrast, there is little research on epitaxial II-VI QDs because of the challenges encountered during their fabrication.Reference Kirmse, Schneider, Rabe, Neumann and Henneberger8 However, the excitonic properties of II-VI QDs are better than those of conventional III-V QDs because of the larger excitonic binding energy in the materials of the former.Reference Pelekanos, Ding, Nurmikko, Luo, Samarth and Furdyna9 Among these II-VI QDs, cadmium telluride/zinc telluride (CdTe/ZnTe) QDs are characterized by large excitonic binding energies and are of great interest because of their potential applications in optoelectronic devices operating in the green spectral range.Reference Moussaouy, Bria, Nougauoi, Charrour and Bouhassoune10–Reference Han, Lee, Yu, Choi and Lee12 In general, CdTe/ZnTe QDs are grown on gallium arsenide (GaAs) substrates, because of the relatively small lattice mismatch (∼8%) between the ZnTe layer and the GaAs substrate, as opposed to the larger lattice mismatch (∼12%) between the ZnTe layer and the silicon (Si) substrate.Reference Chen, Sivananthan and Faurie13 However, the use of Si substrates for the growth of CdTe/ZnTe QDs has various advantages: Si substrates are less expensive as compared with GaAs substrates and can be applied to applications such as the fabrication of very large area and high-quality devices.Reference Smith, Tsen, Chen, Faurie and Sivananthan14 Therefore, it is important to investigate the size-dependent optical properties of CdTe/ZnTe QDs grown on Si substrates. Although several studies have been conducted for determining the size-dependent optical properties of CdTe/ZnTe QDs grown on GaAs substrates,Reference Marsal, Besombes, Tinjod, Kheng, Wasiela, Gilles, Rouvière and Mariette15,Reference Lee, Yim, Lee and Kim16 a study of the size-dependent carrier dynamics and activation energy of CdTe/ZnTe QDs grown on Si substrates has not yet been undertaken.
This article reports the optical properties of CdTe/ZnTe QDs with various CdTe thicknesses, which are grown on Si substrates using molecular beam epitaxy (MBE) and atomic layer epitaxy (ALE). Photoluminescence (PL) measurements are performed herein to characterize the interband transitions in CdTe/ZnTe QDs, having various CdTe thicknesses, which are grown on Si substrates. Time-resolved and temperature-dependent PL measurements are carried out to investigate the carrier dynamics and activation energy of CdTe/ZnTe QDs, grown on Si substrates, as a function of CdTe thickness.
II. EXPERIMENTS
In this study, several CdTe/ZnTe QDs with different CdTe thicknesses were grown on a Si (100) substrate using the following MBE and ALE procedures: The Si substrate was etched in a mixture of ammonium fluoride (NH4F) and hydrofluoric acid (HF) (7:1) at room temperature for 1 min and then rinsed in deionized water. Immediately after the chemical cleaning process, the substrate was mounted on a molybdenum susceptor. First, a 900-nm ZnTe buffer layer was grown on the Si substrate using MBE, and then, CdTe QDs [3.0, 3.5, 4.0, and 4.5 monolayer (ML)] were grown using ALE. The CdTe QDs were then capped with a 100-nm ZnTe layer grown using MBE. The ZnTe and CdTe layers were deposited at a substrate temperature of 300 °C. The zinc (Zn) and tellurium (Te) source temperatures for the ZnTe layer were 280 and 310 °C, respectively, whereas the cadmium (Cd) and the Te source temperatures for the cadmium telluride (CdTe) layer were 210 and 310 °C, respectively. One cycle of ALE growth was implemented by means of an optimum growth process in which the Cd effusion cell was opened for 8 s and growth was interrupted for 1 s. Thereafter, the Te effusion cell was opened for 8 s and growth was interrupted for 5 s. It should be noted that this interrupted process was adopted to improve the film quality by stabilizing positive and negative ions on the surface. CdTe QDs with various thicknesses were deposited by repetition of ALE cycles. The growth rate of the CdTe QDs was approximately 0.5 ML/cycle. Atomic force microscopic measurements were performed using a multimode instrument (AFM. Digital Instruments make, model No. operating in the tapping mode). Time-resolved PL decay curves were measured using a time-correlated single photon counting (TCSPC) method. The excitation source produced 400-nm frequency-doubled femtosecond pulses from a 76 MHz mode-locked Ti:sapphire laser system, and the sample temperature was varied between 20 and 120 K using a helium (He) closed-cycle Displex refrigeration system. The PL was dispersed using a 15-cm monochromator and detected using a multichannel plate photomultiplier tube. A commercially available TCSPC module (PicoHarp, PicoQuant GmbH, Berlin, Germany) was used to obtain PL decay curves. The full width at half maximum (FWHM) of the total instrument response function (IRF) was less than 130 ps.
III. RESULTS AND DISCUSSION
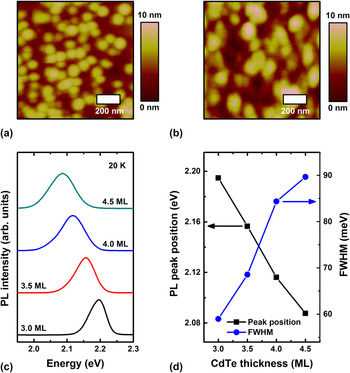
Figures 1(a) and 1(b) show AFM images of the uncapped surfaces for the CdTe/ZnTe QDs with thicknesses of 3.0 and 4.5 ML, respectively. When the thickness of the CdTe layer is 3.0 ML, uniformly sized CdTe QDs are formed on the ZnTe buffer layer. The average heights of the formed CdTe QDs are approximately between 8 and 10 nm, and their diameters are approximately between 45 and 55 nm. The density of the CdTe QDs is approximately 3 × 10¹⁰/cm2. However, when the thickness of the CdTe layers is 4.5 ML, large- and small-sized QDs are formed on the ZnTe buffer layer owing to the coalescence of the QDs. The average heights of the formed CdTe QDs are approximately between 9 and 13 nm, and their diameters are approximately between 60 and 85 nm. The density of the CdTe QDs is approximately 1 × 10¹⁰/cm2.
AFM images for CdTe/ZnTe QDs with thicknesses of (a) 3.0 and (b) 4.5 ML grown on Si substrates. (c) PL spectra at 20 K for CdTe/ZnTe QDs with thicknesses of 3.0, 3.5, 4.0, and 4.5 ML grown on Si substrates. (d) Peak position and FWHM of the PL spectra for CdTe/ZnTe QDs grown on Si substrates as a function of CdTe thickness.

To clarify the observed AFM behavior, we investigated the optical properties of CdTe/ZnTe QDs with various CdTe thicknesses. Figure 1(c) shows the PL spectra at 20 K for CdTe/ZnTe QDs with thicknesses of 3.0, 3.5, 4.0, and 4.5 ML grown on Si substrates. The dominant peaks shown in Fig. 1(c) correspond to the exciton transition from the ground-state electronic subband to the ground-state heavy-hole band (E1–HH1) in the CdTe/ZnTe QDs. The dominant peak was assigned to the E1–HH1 transition of the CdTe/ZnTe QDs using the theoretical E1–HH1 transition value, which was calculated using the finite differential method.Reference Woo, Song, Lee, Kim, Yoo, Lee and Park17 The peak position corresponding to the E1–HH1 transition in the CdTe/ZnTe QDs shifts to a lower energy level with increasing CdTe thickness. Figure 1(d) shows the peak position and the FWHM of the E1–HH1 transition for the CdTe/ZnTe QDs grown on Si substrates as a function of CdTe thickness. A shift in the E1–HH1 transition peak for the CdTe/ZnTe QDs as the CdTe thickness increases is attributed to the size variation of the CdTe QDs. The redshift in the PL peak position for the CdTe/ZnTe QDs with increasing CdTe thickness is attributed to a decrease in the energy gap of the CdTe QDs resulting from an increase in the size of the QDs.Reference Karczewski, Maćkowski, Kutrowski, Wojtowicz and Kossut18 The FWHM of the E1–HH1 transition for the CdTe/ZnTe QDs increases with increasing CdTe thickness, owing to the inhomogeneous broadening resulting from the size distribution of the QDs.Reference Leon, Kim, Jagadish, Gai, Zou and Cockayne19 The PL results obtained above clearly confirm the observed AFM behavior.
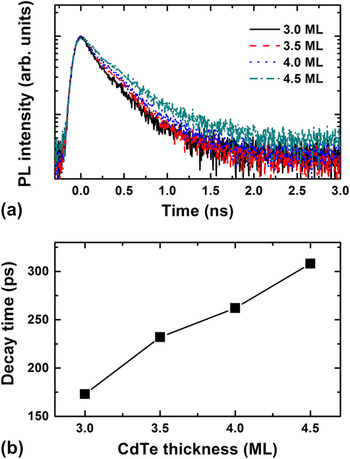
For understanding the carrier dynamics of CdTe/ZnTe QDs with various CdTe thicknesses grown on Si substrates, we performed time-resolved PL measurements. The time-resolved PL spectra at 20 K for the CdTe/ZnTe QDs with thicknesses of 3.0, 3.5, 4.0, and 4.5 ML grown on Si substrates are shown in Fig. 2(a). PL decay curves exhibit different decay behaviors depending on the CdTe thickness. For determining the PL decay time, we performed reconvolution fitting with the IRF for the time-resolved PL results, which fit well with a biexponential function. The fitting results revealed that the decay times of the fast components are 173, 232, 262, and 308 ps, whereas those of the slow components are 490, 646, 879, and 1203 ps for the CdTe/ZnTe QDs with thicknesses of 3.0, 3.5, 4.0, and 4.5 ML, respectively. A biexponential decay is present in all recorded spectra, in agreement with previous observations on CdTe/ZnTe QDs.Reference Couteau, Moehl, Tinjod, Gérard, Kheng and Mariette20 As reported in the literature, the fast component can be attributed to “bright” exciton decay, and the slow component, to “dark” exciton decayReference Labeau, Tamarat and Lounis21; hereafter, we focus only on the fast component. The decay times of the CdTe/ZnTe QDs grown on Si substrates as a function of CdTe thickness are shown in Fig. 2(b). As mentioned above, the size of the CdTe/ZnTe QDs increases with increasing CdTe thickness. Consequently, the decay time of the CdTe/ZnTe QDs increases with increasing CdTe thickness. This increase is caused by a reduction of the exciton oscillator strength owing to a strong built-in electric field in the larger QDs.Reference Kako, Miyamura, Tachibana, Hoshino and Arakawa22 These results of carrier dynamics for the CdTe/ZnTe QDs with various CdTe thicknesses, which are grown on Si substrates, are similar to those for CdTe/ZnTe QDs grown on GaAs substrates.Reference Lee, Yim, Lee and Kim16
(a) Time-resolved PL spectra at 20 K for CdTe/ZnTe QDs with thicknesses of 3.0, 3.5, 4.0, and 4.5 ML grown on Si substrates. (b) Decay time of CdTe/ZnTe QDs grown on Si substrates as a function of CdTe thickness.

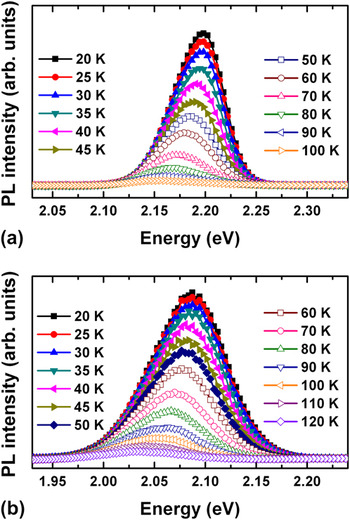
For determining the activation energy of the electrons confined in the CdTe/ZnTe QDs grown on Si substrates as a function of CdTe thicknesses, we performed temperature-dependent PL measurements. Even though these measurements were performed for the CdTe/ZnTe QDs with thicknesses of 3.0, 3.5, 4.0, and 4.5 ML, only the results of the QDs with thicknesses of 3.0 and 4.5 ML are reported in this article, because those QDs had the minimum and maximum activation energies. The PL spectra measured at several temperatures for the CdTe/ZnTe QDs with thicknesses of 3.0 and 4.5 ML are shown in Figs. 3(a) and 3(b), respectively. Given that the energy gaps of the QDs decrease with increasing temperature, the PL peaks corresponding to the E1–HH1 transitions shift to a lower energy level with increasing temperature.Reference Benyoucef, Rastelli, Schmidt, Ulrich and Michler23 The occurrence of PL quenching at higher temperatures is attributed to the escape of carriers via a nonradiative recombination path. As the temperature is increased, the integrated PL intensity corresponding to the bound electron peak is given byReference Williams, Bebb, Willardson and Beer24
 $$I = I_0 /[1 + C\exp ( - \Delta E_{\rm{A}} /k_{\rm{B}} T)]\quad,$$
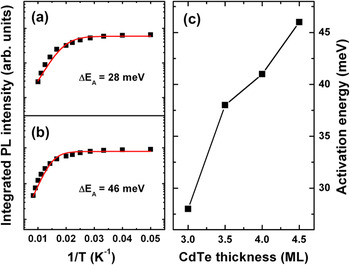
where I 0 is the integrated PL intensity at 0 K, C is the ratio of the thermal escape rate to the radiation recombination rate, ΔE A is the activation energy that corresponds to the barrier height for the nonradiative recombination path, and k B is the Boltzmann constant. From Eq. (1), the activation energies ΔE A of the electrons confined in the CdTe/ZnTe QDs with thicknesses of 3.0 and 4.5 ML as determined from the solid lines in Figs. 4(a) and 4(b) are 28 and 46 meV, respectively. The activation energies of the electrons confined in the CdTe/ZnTe QDs grown on Si substrates as a function of CdTe thickness are shown in Fig. 4(c). The behavior of the activation energy for the CdTe/ZnTe QDs with various CdTe thicknesses is similar to their decay times. The activation energy of the electrons confined in the CdTe/ZnTe QDs increases with increasing CdTe thickness. This increase is related to an enhancement of the quantum confinement effect resulting from an increase in the energy difference between the electronic state and the conduction band edge.Reference Lee, Park and Kim25
PL spectra at several temperatures for CdTe/ZnTe QDs with thicknesses of (a) 3.0 and (b) 4.5 ML grown on Si substrates.

Integrated PL intensities as a function of reciprocal temperature for CdTe/ZnTe QDs with thicknesses of (a) 3.0 and (b) 4.5 ML grown on Si substrates. (c) Activation energies of CdTe/ZnTe QDs grown on Si substrates as a function of CdTe thickness.

IV. CONCLUSIONS
We have investigated the size-dependent carrier dynamics and activation energy in CdTe/ZnTe QDs grown on Si substrates. The peak position of the E1–HH1 excitonic transitions in these QDs shifts to a lower energy level with increasing CdTe thickness because of an increase in the size of CdTe QDs. The decay time of the CdTe/ZnTe QDs, as obtained from time-resolved PL spectra, increases with increasing CdTe thickness because of a decrease in the exciton oscillator strength resulting from a strong built-in electric field in the larger QDs. The activation energy of the electrons confined in the CdTe/ZnTe QDs increases with increasing CdTe thickness owing to an enhancement of the quantum confinement effect resulting from an increase in the energy difference between the electronic state and the conduction band edge. The present observations can help to improve understanding of the carrier dynamics and activation energy in CdTe/ZnTe QDs of various sizes grown on Si substrates.
ACKNOWLEDGMENTS
This work was supported by the Basic Science Research Program through the National Research Foundation of Korea (NRF) funded by the Ministry of Education, Science and Technology (Grant No. 2010–0021189).