Introduction
The spatial distribution of prey in a given habitat over time is mainly determined by behaviours related to foraging and/or search for mates and/or oviposition and/or avoidance of predators (Sih, Reference Sih1997; Alonzo, Reference Alonzo2002; Lima, Reference Lima2002). Predators are, therefore, important determinants of the distribution of prey individuals within populations and populations within communities (Kerfoot & Sih, Reference Kerfoot and Sih1987; Lima & Dill, Reference Lima and Dill1990; Rochette & Dill, Reference Rochette and Dill2000). In many habitats, prey are exposed to functionally different predator types (Schoener, Reference Schoener1989; Polis, Reference Polis1991; Polis & Strong, Reference Polis and Strong1996; Relyea, Reference Relyea2003), and they may have a direct and/or indirect impact on prey distribution.
The predators may directly influence prey distribution via reducing prey density through consumption (density-mediated effects) and via triggering behavioural changes in prey (behaviour-mediated effects) (e.g. Peacor & Werner, Reference Peacor and Werner2001; Luttbeg & Kerby, Reference Luttbeg and Kerby2005; Preisser et al., Reference Preisser, Bolnick and Benard2005). The strength of these effects commonly depends on the risk posed to prey and the specificity of prey defense (Bolker et al., Reference Bolker, Holyoak, Krivan, Rowe and Schmitz2003; Relyea, Reference Relyea2003), which, in turn, may be linked to prey specialisation of the predators. Specialist predators that co-evolved with a given prey species pose a higher risk than do generalists that lack co-evolutionary history with this prey (e.g. Begon et al., Reference Begon, Harper and Townsend1996). Consequently, at the population level, specialists exert stronger density-mediated effects on prey than do generalists. How should prey cope with predators posing differing threats? Anti-predation behaviour, such as reduced activity and avoidance of patches occupied by predators, is linked with costs paid in time and energy at the expense of other fitness-related activities. Thus, selection should favour prey that is able to adjust anti-predation behaviour to the risk posed by a given predator (Sih, Reference Sih1986; Helfman, Reference Helfman1989). Specialist predators should trigger a stronger anti-predation response in prey than generalist predators do, and this could be reflected in prey distribution. Empirical evidence for graded prey response according to the relative predation risk has been found in several prey-multiple predator assemblages in marine, freshwater and terrestrial communities (for reviews, see Sih et al., Reference Sih, Englund and Wooster1998; Relyea, Reference Relyea2003).
Predator-predator interactions, such as competition and intraguild predation (IGP), may indirectly affect the distribution of the shared prey. Competition and IGP are commonly asymmetric (Connell, Reference Connell1983; Schoener, Reference Schoener1983; Polis et al., Reference Polis, Myers and Holt1989). For instance, if the inferior IG predator poses a higher risk to the shared prey, IGP may reduce the overall predation risk for the shared prey and consequently alter its distribution. Alternatively or additionally, the inferior IG predator may respond to the superior IG predator by avoiding sites that are occupied by its opponent. In such a scenario, the two predator species may be more dispersed than predicted from their distribution when alone in a habitat. Co-occurrence of two predators could thus result in reduction of predator-free space for the shared prey and consequently alter its distribution.
We studied the spatiotemporal distribution dynamics in a two predator/one prey system consisting of the specialist predator Phytoseiulus persimilis Athias-Henriot and the generalist predator Neoseiulus californicus McGregor (Acari: Phytoseiidae) and their shared prey, the herbivorous two-spotted spider mite Tetranychus urticae Koch (Acari: Tetranychidae), on whole bean plants. The two predators are also known to engage in IGP (Walzer & Schausberger, Reference Walzer and Schausberger1999a,Reference Walzer and Schausbergerb). We addressed the following questions: (i) do the specialist predator P. persimilis and the generalist predator N. californicus exert different effects on the within-plant distribution patterns of the spider mite T. urticae; (ii) do the generalist and specialist predator affect each other's distribution patterns when they co-occur on a plant; and (iii) how do co-occurring generalist and specialist predators affect the distribution of T. urticae as compared to either predator alone?
Material and methods
Study system
The spider mite predators P. persimilis and N. californicus may be part of naturally occurring and artificially created guilds (Dosse, Reference Dosse1958; Garcia-Mari & Gonzalez-Zamora, Reference Garcia-Mari and Gonzalez-Zamora1999; Schausberger & Walzer, Reference Schausberger and Walzer2001; Venzon et al., Reference Venzon, Pallini and Janssen2001). Phytoseiulus persimilis is a highly specialised spider mite predator, whereas N. californicus is a polyphagous generalist predator. Both are widely used for biological control of spider mites in various crops (for review see e.g. McMurtry & Croft, Reference McMurtry and Croft1997). Diet specialisation of the predators is well reflected in the intrinsic rate of natural increase (rm), 0.374/d and 0.287/d for P. persimilis and N. californicus, respectively (Ma & Laing, Reference Ma and Laing1973; Badii & McMurtry, Reference Badii and McMurtry1984), and predation rates with T. urticae prey. At ample prey supply, P. persimilis consumes more than twice as much as N. californicus does (Friese & Gilstrap, Reference Friese and Gilstrap1982). Consequently, the specialist P. persimilis poses a higher risk to T. urticae than the generalist N. californicus (McMurtry & Croft, Reference McMurtry and Croft1997). Phytoseiulus persimilis is superior to N. californicus in competition for spider mites, while mutual IGP between P. persimilis and N. californicus clearly favours the latter (Walzer & Schausberger, Reference Walzer and Schausberger1999a,Reference Walzer and Schausbergerb). Their shared prey, T. urticae, is a key pest on many agricultural plants (for review see e.g. Helle & Sabelis, Reference Helle and Sabelis1985) due to feeding on the surface tissue of their host plants (van der Geest, Reference Van der Geest, Helle and Sabelis1985).
Mite sources and rearing, experimental set-up and protocol
The stock population of P. persimilis was maintained on T. urticae infested bean plants in a greenhouse. The population was founded with specimens obtained from a commercial producer of natural enemies (Biohelp, Vienna, Austria). The stock population of N. californicus was founded with individuals collected on greenhouse-grown roses, reared on artificial arenas and fed T. urticae (Walzer & Schausberger, Reference Walzer and Schausberger1999a). Plants received five different treatments (T. urticae (TU alone), T. urticae+N. californicus (TU+NC), T. urticae+P. persimilis (TU+PP), T. urticae+P. persimilis+N. californicus (TU+PP+NC), T. urticae+½ P. persimilis+½ N. californicus (TU+½PP+½NC)) and were kept in a computerised greenhouse. Minimum temperature was 25°C during the day and 18°C during the night. Ambient relative humidity was kept at 60±10% RH. A screen shaded the greenhouse when the light intensity exceeded 25,000 lux. Below an intensity of 10,000 lux, artificial lighting provided a daily photophase of 16:8 h (L:D).
Each experimental unit consisted of a pot (height: 11 cm, diameter: 14 cm) containing 15 common bean plants (Phaseolus vulgaris). Wooden sticks served as foothold for the plants, which reached a height of about 80 cm. Each treatment consisted of six experimental units placed on a bench (4.9×0.9 m). Spacing among experimental units was about 0.8 m. Water supply of the plants was ensured by flooding the benches every 12 h. Flooding provided a permanently moist bench surface, which prevented movement of the mites among experimental units. For data collection and analyses, the plants were vertically sectioned into three virtual strata: the base stratum from 20 to 40 cm, the middle stratum from 40 to 60 cm and the top stratum from 60 to 80 cm height. Prior to the experiment, each experimental unit was infested with six T. urticae females released in the base stratum. Two weeks later, the predators were released in the base stratum according to the following scheme (per experimental unit): eight females of either N. californicus or P. persimilis in the single predator treatment (TU+PP, TU+NC), eight N. californicus plus eight P. persimilis females in the predator combination treatment TU+PP+NC and four N. californicus plus four P. persimilis females in the predator combination treatment TU+½PP+½NC. The two combined predator treatments allowed the analysis of the influence of initial predator density on the spider mite distribution. Beginning on the first day after predator release, one leaflet of a trifoliate from each stratum of each experimental unit was sampled daily and all developmental stages of the mites (eggs, juveniles and males, adult females) were counted over 30 days. After counting the mites, the sampled leaflets were returned to the experimental units.
Data analyses
First, for each mite species, the temporal variation in density pooled over strata was compared among treatments using repeated measures analyses of variance (ANOVAs). Bonferroni tests were used for planned day-wise comparisons between treatment pairs. To account for variance heterogeneity in some treatments, the significance level was adjusted to 0.01 (Bühl & Zöfel, Reference Bühl and Zöfel2002).
Second, aggregation of the mites at the leaf scale was examined using Taylor's power law (Taylor, Reference Taylor1961). For each treatment and mite species, Taylor's aggregation index b was calculated, with b<1 indicating uniform distribution, b=1 random distribution, b>1 aggregated distribution and b⩾2 highly aggregated distribution. The aggregation indices (regression coefficients) were compared within species between treatment pairs and within treatments between species pairs by using the t-statistic obtained from the formula

and

(b is the regression coefficient, SE is the standard error, n is the number of replicates, df is the degree of freedom).
Third, the spatial distribution of each mite species across strata pooled over time was compared among treatments by using a contingency table. If significant, planned comparisons between treatment pairs using chi square tests followed.
Fourth, for each mite species and every single day, the distribution across strata was compared between treatment pairs by chi square tests. Subsequently, the trend in spatial distribution over time was compared between treatment pairs by regressing the probability levels produced by day-wise chi square tests on day of the experiment (x=day). Linear regression, y=a+bx (model 1) and 2nd degree polynomial regression, y=a+b1x+b2x2 (model 2), were conducted. The resulting regression coefficients indicate whether the trends in mite distribution over time differ between treatments (Fernandez, Reference Fernandez1998 for similar approach). If the trends are identical, the regression coefficient is zero; if the trends differ, the regression coefficient deviates from zero. The same type of analysis was used to compare the spatial distribution of P. persimilis and N. californicus across strata between the single predator treatments and among leaves within each predator combination treatment.
Results
Population density
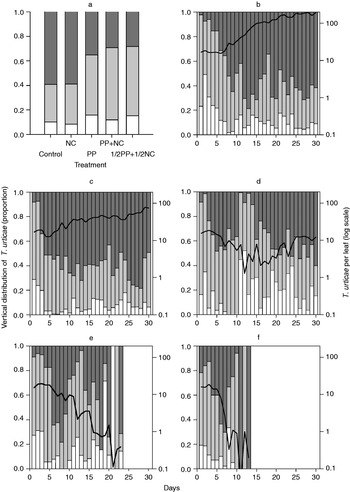
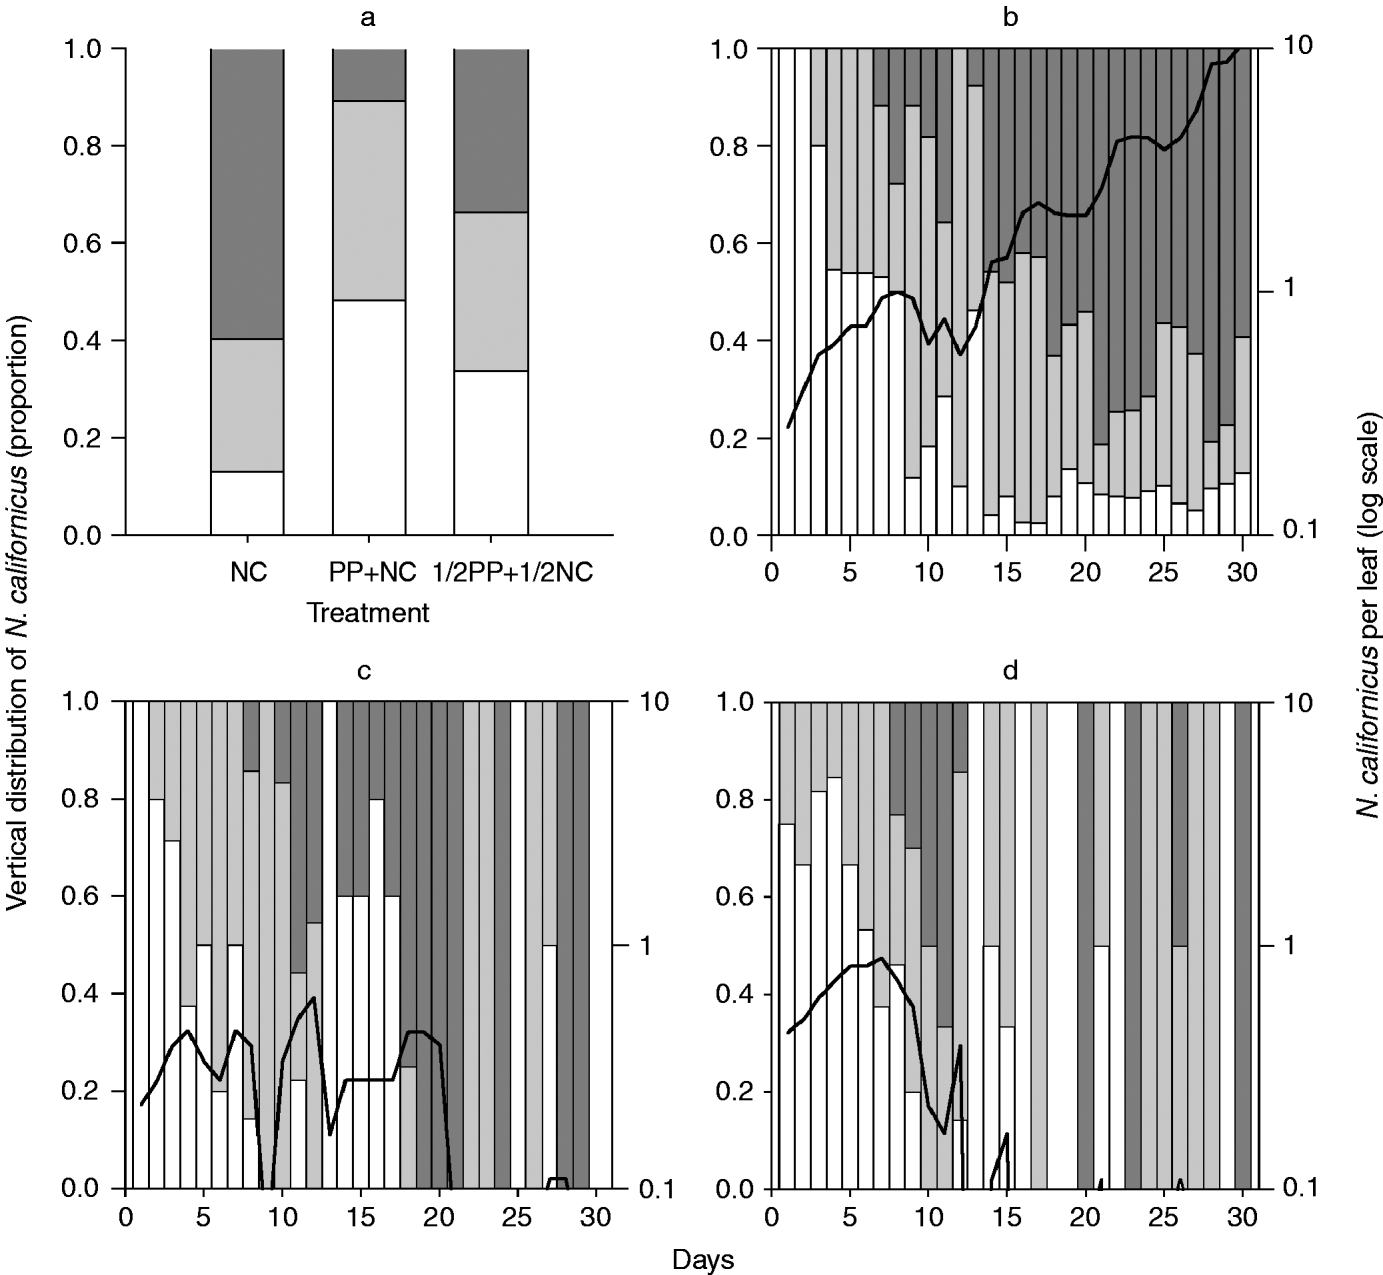
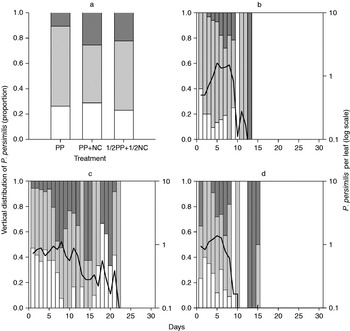
Time, treatment and the interaction between treatment and time had a significant effect on the overall population densities of T. urticae (treatment: df=4, F=30.5, P<0.001; time: df=29, F=9.68, P<0.001; time×treatment: df=116, F=8.88, P<0.001), N. californicus (treatment: df=2, F=25.69, P<0.001; time: df=29, F=4.05, P<0.001; time×treatment: df=58, F=5.38, P<0.001) and P. persimilis (time: df=29, F=13.33, P<0.001) except the marginally significant effect of treatment and the interaction between time and treatment on P. persimilis (treatment: df=2, F=2.76, P=0.073; time×treatment: df=58, F=1.35, P=0.042). During the first six days, the spider mite densities did not differ among treatments (Bonferroni, P<0.01 for every single day; fig. 1b–f). In the predator-free treatment, the T. urticae population increased continuously and reached the maximum density at the end of the experimental period with 192±183 (SD) individuals per leaf (fig. 1b). Neoseiulus californicus alone was not able to completely suppress T. urticae within 30 days. Also, in this treatment, the spider mites reached the maximum density with 74±88 (SD) individuals per leaf at the end of the experimental period, albeit at a much lower level than in the treatment without predators (Bonferroni, P<0.01; fig. 1c). In every treatment with P. persimilis, the spider mite populations were reduced to similarly low densities (<2 individuals per leaf) within the first 12 days (fig. 1d–f). In the treatment with P. persimilis alone, the T. urticae density increased again after the disappearance of P. persimilis on day 14 (fig. 1d), whereas in both predator combination treatments the spider mites were suppressed to zero density on day 14 and 23, respectively (fig. 1e, f). The density of N. californicus did not differ among treatments until day 12 (Bonferroni, P>0.01 for every single day; fig. 2b–d) but differed between the single predator and the full and half predator combination treatments after day 12 and 15, respectively (Bonferroni, P<0.01 for every single day; fig. 2b–d). Neoseiulus californicus alone increased to 10.5±17.5 (SD) mites per leaf on day 30 (fig. 2b). In both predator combination treatments, N. californicus persisted until the end of the experiment but decreased to extremely low levels (fig. 2c, d). Phytoseiulus persimilis reached similar population densities in all treatments until day 8 (Bonferroni, P<0.01 for every single day) and then disappeared on day 13 (TU+PP), day 15 (TU+PP+NC) and day 21 (TU+½PP+½NC), respectively (fig. 3b–d).
Vertical within-plant distribution and population density (log scale) of T. urticae. Distribution (a) pooled over time and (b–f) date dependent (b) without predators, (c) with N. californicus, (d) with P. persimilis, (e) with ½ P. persimilis+½ N. californicus, and (f) with P. persimilis+N. californicus (□, base stratum;  , middle stratum;
 , top stratum; ––, T. urticae per leaf).

Vertical within-plant distribution and population density (log scale) of N. californicus. Distribution (a) pooled over time and (b–d) date dependent (b) without a second predator, (c) with ½ P. persimilis, and (d) with P. persimilis (□, base stratum; , middle stratum; , top stratum; ––, N. californicus per leaf).
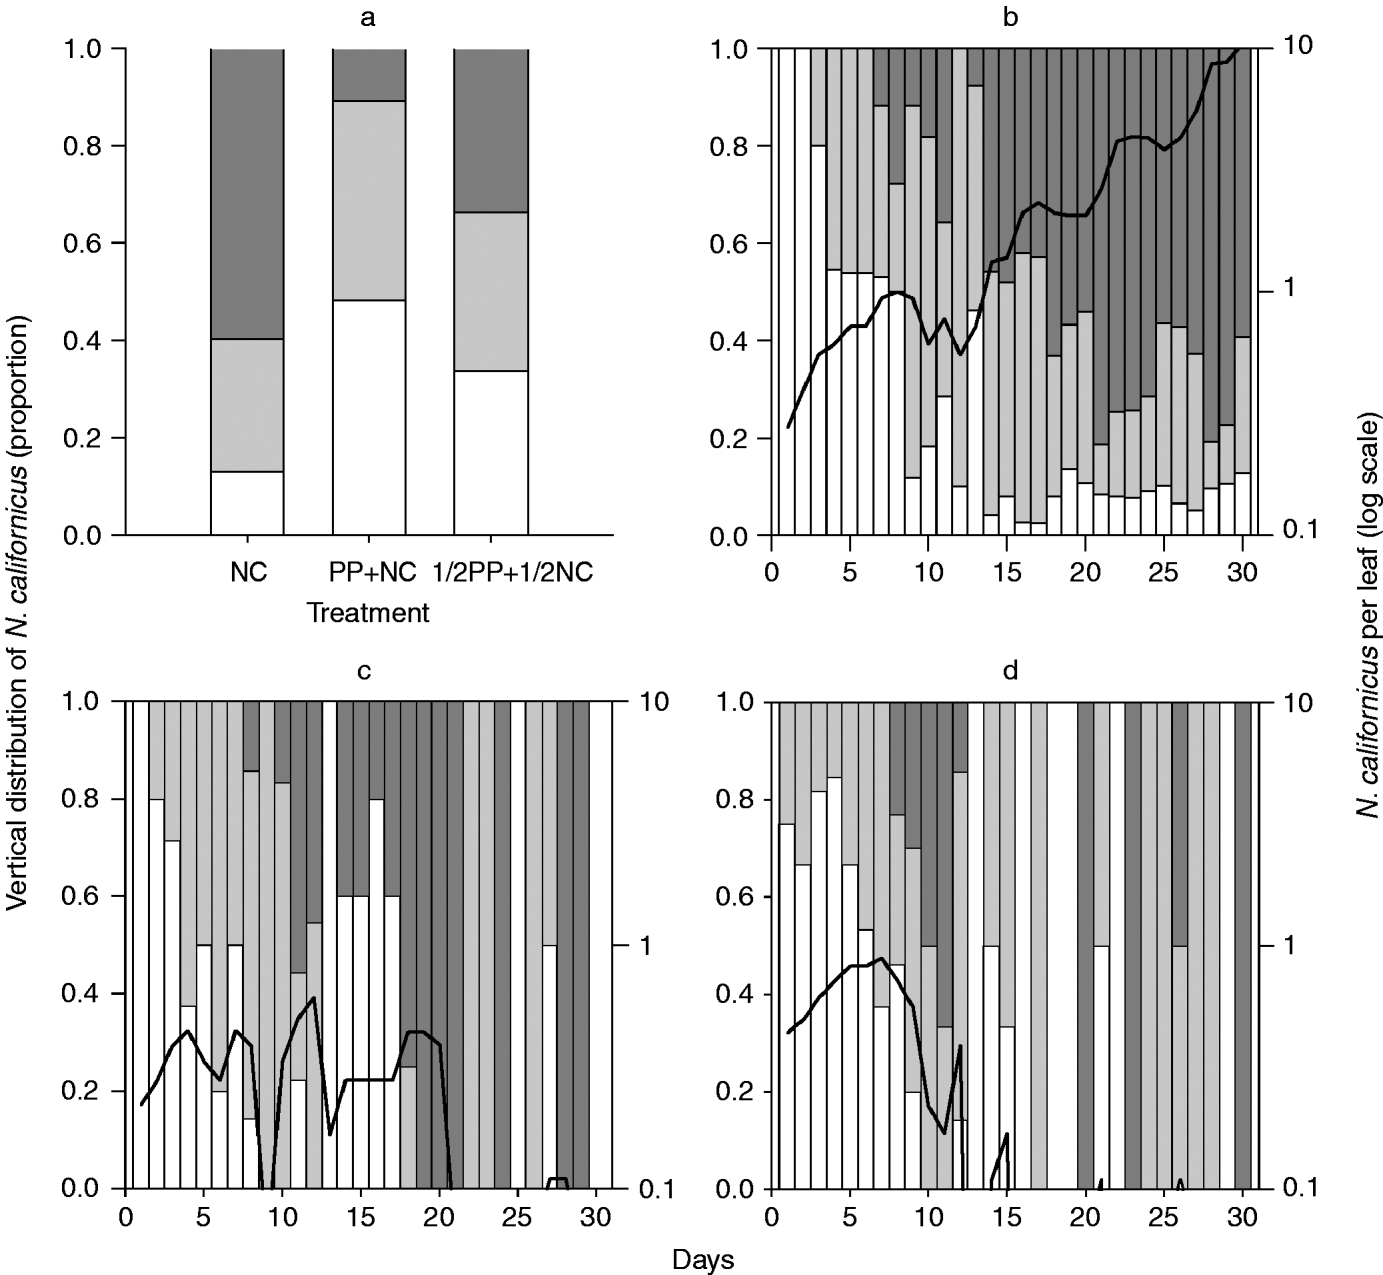
Vertical within-plant distribution and population density (log scale) of P. persimilis. Distribution (a) pooled over time and (b–d) date dependent (b) without a second predator, (c) with ½ N. californicus, and (d) with N. californicus (□, base stratum; , middle stratum; , top stratum; ——, P. persimilis per leaf).

Aggregation levels (Taylor's b)
Irrespective of treatment, the populations of the spider mites and the predators were aggregated at the leaf level, i.e. Taylor's b exceeded 1 (table 1). Tetranychus urticae had significantly higher aggregation levels in treatments without predators and with N. californicus alone than in treatments with P. persimilis alone and the predator combination treatments. The aggregation level of N. californicus was influenced by the presence of P. persimilis (table 1). Neoseiulus californicus alone was more aggregated than when together with P. persimilis in the predator combination treatments (df=52, t=3.62, P<0.001 and df=57, t=2.45, P<0.05, respectively) and P. persimilis alone (df=41, t=2.14, P<0.05) (table 2). In contrast, the aggregation level of P. persimilis was similar in all treatments (P>0.05).
Aggregation levels (Taylor's b) and corresponding r2 for T. urticae and the predators P. persimilis and N. californicus.

Different superscript letters indicate differences among treatments within species.
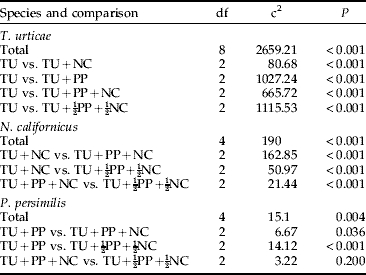
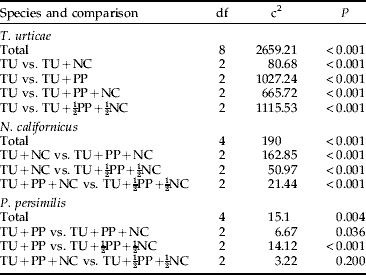
Chi square analyses of the spatial distribution of T. urticae, N. californicus and P. persimilis across strata pooled over time compared among all treatments and between treatment pairs (TU for T. urticae, NC for N. californicus and PP for P. persimilis).
Spatial distribution across strata pooled over time
The spatial distribution of T. urticae, N. californicus and P. persimilis across strata pooled over time differed significantly among treatments (table 2). The distribution of T. urticae alone and with N. californicus was characterised by a higher fraction in the top stratum than in the middle and base strata. In contrast, in all other treatments, the middle stratum harbored a higher fraction of spider mites than the top and base strata (fig. 1a, table 2). When N. californicus was the only predator (TU+NC), their distribution was similar to that of T. urticae without predators (TU) and with N. californicus (TU+NC) (figs 1a and 2a). In the full predator combination treatment (TU+PP+NC), most N. californicus were found in the base and middle strata. In contrast, in the half predator combination treatment (TU+½PP+½NC), N. californicus was homogeneously distributed among strata (fig. 2a, table 2). In all treatments, more P. persimilis were found in the middle stratum than in the top and base strata. However, this pattern was more pronounced when P. persimilis was alone than when N. californicus was present (fig. 3a, table 2).
Spatial distribution across strata on single days and trends over time
In the treatment without predators (TU), most T. urticae were found in the middle and base strata during the first seven days. Afterwards, T. urticae was more abundant in the top stratum than in the middle and base strata (fig. 1b). The trend in spatial distribution of T. urticae across strata over time was similar in treatments without predators and with either predator alone (P>0.05 for each regression coefficient of both models) (fig. 1b–d). However, single day chi-square tests revealed significant differences (P<0.05) in the spider mite distribution without predators (TU) and with either predator alone on 25 of 30 days (TU vs. TU+NC) and 22 of 30 days, respectively (TU vs. TU+PP). The most conspicuous difference was observed at the beginning of the experiment (P<0.05 on days 1 to 6 in TU+NC and days 1 to 4 in TU+PP), where the T. urticae fraction in the top stratum increased more rapidly in the treatment with either predator alone than in the treatment without predators. In the treatment with P. persimilis alone, after the rapid increase during the first seven days, the spider mite fraction in the top stratum decreased continually until the disappearance of P. persimilis on day 13. (fig. 1b, d).
The trend in spatial distribution of T. urticae across strata over time differed marginally significantly between TU vs. TU+½ PP+½ NC (model 2: b1=−0.048, P=0.102; b2=0.002, P=0.063) and significantly between TU+NC vs. TU+½PP+½NC (model 2: b1=−0.056, P=0.028; b2=0.002, P=0.003), TU+PP vs. TU+PP+NC (model 2: b1=−0.037, P=0.002; b2=0.003, P<0.0001), TU vs. TU+PP+NC (model 1: b=0.038, P=0.002) and TU+NC vs. TU+PP+NC (model 1: b=0.049, P=0.002), whereas there was no difference between TU+½PP+½NC vs. TU+PP+NC and TU+PP vs. TU+½PP+½NC (P>0.05 for each regression coefficient of both models). In each of the above-mentioned pair-wise treatment comparisons, the distribution of T. urticae differed on >70% of days (single day chi-square tests P<0.05). Together, the regression and day-wise chi-square tests revealed two major characteristics in the distribution of T. urticae in the predator combination treatments: (i) on days 6 and 7, higher T. urticae fractions were found in the top stratum than in all other treatments (P<0.05); (ii) overall, the T. urticae distribution fluctuated more among strata when both predators were present than without predators or when only a single predator species was present (fig. 1b–f).
The trend in spatial distribution of N. californicus across strata differed only between the single predator treatment (TU+NC) and the half predator combination treatment (TU+½PP+½NC) (model 2: b1=−0.085, P=0.029; b2=0.003, P=0.032) but not between any of the other treatment pairs (TU+NC vs. TU+PP+NC and TU+PP+NC vs. TU+½PP+½NC) (P>0.05 for each regression coefficient of both models) (fig. 2b–d). In the former comparison, the distribution of N. californicus was similar in both treatments during the first ten days (chi-square analysis; P>0.05 for every single day). The predators were exclusively found in the base and middle strata until days 5 and 7, respectively. Thereafter, the predators were increasingly present in the top stratum. Between days 13 and 16, the N. californicus fraction in the middle and top strata increased in the single predator treatment; whereas, in the half predator combination treatment, most N. californicus were found in the base stratum (chi-square analysis; P<0.05 for every single day) (fig. 2b, c).
Similar to N. californicus, the trend in spatial distribution of P. persimilis across strata differed between the single predator treatment (TU+PP) and the half predator combination treatment (TU+½PP+½NC) (model 2: b1=−0.270, P=0.003; b2=0.020, P=0.005) but was similar between TU+PP vs. TU+PP+NC and TU+PP+NC vs. TU+½ PP+½ NC (P>0.05 for each regression coefficient of both models) (fig. 3b–d). In the single predator treatment, a much smaller fraction of P. persimilis was found in the top stratum between days 3 and 9 than in the half predator combination treatment (chi-square analysis; P<0.05 on days 6, 7 and 9) (fig. 3b, d).
The trend in spatial distribution of N. californicus and P. persimilis across strata over time in the single predator treatments (TU+NC and TU+PP) did not differ (P>0.05 for each regression coefficient of both models) (figs 2b and 3b). However, this comparison has low statistical power due to the absence of P. persimilis in the second half of the experiment.
Comparison of the trend in spatial distribution of P. persimilis and N.californicus across leaves over time within either predator combination treatment indicated that the two species occupied different leaves in the half predator combination treatment (model 2: b1=−0.093, P=0. 033; b2=0.005, P=0.017) but not in the full predator combination treatment (P>0.05 for each regression coefficient of both models). Single day chi-square tests of the half predator combination treatment indicated that P. persimilis and N. californicus occupied different leaves especially between days 11 and 17 (P<0.05 on days 12, 15 and 17), which coincided with the rapid decline of the spider mites (fig. 1e).
Discussion
Distribution of the spider mites
On plants without predators, the spatial distribution of T. urticae over time was characterised by an initial occupation of the base and middle strata followed by migration to the top stratum. This shift in vertical distribution over time may have been caused by spider mites moving up on the plants because of an increased population density in the base and middle strata and the associated increased level of leaf deterioration (Bernstein, Reference Bernstein1984). Additionally, population density and movement of the spider mites may have been affected by leaf age, with older leaves being less favourable for population growth than younger ones (Nachman & Zemek, Reference Nachman and Zemek2002). Thus, T. urticae migrated to the top stratum to search for unoccupied and/or young and more nutritious leaves (Walzer et al., Reference Walzer, Moder and Schausberger2007).
Phytoseiulus persimilis but not N. californicus decreased the aggregation level of T. urticae, which was likely a consequence of P. persimilis' stronger density-reducing effects. In the first week, higher fractions of T. urticae were found in the top stratum when P. persimilis or N. californicus were present than without predators. At that time, both predators mainly occupied the base and middle strata; yet, the overall spider mite densities did not differ with and without predators. Hence, the high T. urticae fraction in the top stratum was likely the result of anti-predation behaviour through premature upward migration. Refuge use and/or movement to predator-free space through vertical migration has been suggested for another tetranychid mite, the cassava green mite Mononychellus tanajoa Bondar (Acari: Tetranychidae) (Magalhães et al., Reference Magalhães, Janssen, Hanna and Sabelis2002). It seems that T. urticae responds similarly to functionally different predators at close range (on leaves and among leaves within plants) but not at long range (among plants from the distance). At close range (on leaves), T. urticae females responded to cues from P. persimilis females and avoided oviposition in these patches (Grostal & Dicke, Reference Grostal and Dicke1999). This response was not predator specific because T. urticae behaved similarly when perceiving the cues of the generalist predators Euseius finlandicus (Oudemans), Amblyseius andersoni (Chant) and Iphiseius degenerans (Berlese) (Acari: Phytoseiidae) and even cues deriving from a bee-parasitic mite that poses no threat to T. urticae (Grostal & Dicke, Reference Grostal and Dicke2000). Similarly, in our experiments, T. urticae avoided the strata occupied by the specialist P. persimilis or the generalist N. californicus and migrated early to the top stratum irrespective of predator species and type. In contrast, Pallini et al. (Reference Pallini, Janssen and Sabelis1999) showed in olfactometer tests that T. urticae females avoid visiting plants with P. persimilis but not with N. californicus. It thus seems that the costs of patch avoidance for T. urticae and the respective compensating benefits increase with the spatial scale. Avoiding plants with predators may only pay off for T. urticae when the enemy is a high risk predator such as P. persimilis. Contrary, at close range (within a plant) the costs of predator avoidance seem lower and migration to predator-free leaves may be an appropriate response to both a specialist predator, such as P. persimilis, and a generalist predator, such as N. californicus.
After the initial similar antipredation response in both single predator treatments, the spatiotemporal distribution of T. urticae was strongly influenced by density reduction caused by the predators. Density reduction by P. persimilis but not N. californicus was biased among strata. As a consequence, P. persimilis but not N. californicus exerted a strong density-mediated effect on the distribution of T. urticae across strata. Phytoseiulus persimilis migrated earlier to the top stratum than did N. californicus. Additionally, the rapidly decreasing density of T. urticae in the middle stratum due to predation by P. persimilis and the associated increasing P. persimilis density from 0.2 (day 1) to 1.1 individuals per leaf (day 5) may have limited the chances of T. urticae to migrate to and colonize the top stratum. This conclusion is supported by the aggregation levels and spatial distributions of the mites pooled over time. The aggregation level of T. urticae was lower in treatments with P. persimilis than in treatments with N. californicus, which may have been caused by (i) differing densities and associated variabilities due to predation (Wilson et al., Reference Wilson, Hoy, Zalom and Smilanick1984; Onzo et al., Reference Onzo, Hanna, Sabelis and Yaninek2005), (ii) differing responses to predators (Magalhães et al., Reference Magalhães, Janssen, Hanna and Sabelis2002) or (iii) a combination of both. Our experiment suggests that cause (i) had much more impact than cause (ii). Both predators initially caused a similar avoidance response in T. urticae, yet density reduction by P. persimilis was stronger and more biased among strata than density reduction by N. californicus. Moreover, the aggregation level of T. urticae was not affected by N. californicus and the spatial distributions of T. urticae and N. californicus were almost identical. Hence, predation by N. californicus reduced the overall population densities of the spider mites but did not have an effect on their spatial distribution among strata.
The predators in combination were more widely dispersed among leaves than either predator alone, which resulted in earlier movement of T. urticae from the base and middle stratum to the top stratum in the predator combination treatments. Such non-lethal effects of predators may have similar stabilizing effects on the persistence of predator-prey systems as the use of prey refuges (Abrams, Reference Abrams1993; Lima, Reference Lima1998; Van Baalen & Sabelis, Reference Van Baalen and Sabelis1999). However, vertical migration of T. urticae led only to a temporal short-term release from predation because of the increase of predator populations and the associated diminishment of predator-free space. Consequently, in the further course of the experiment, T. urticae was driven to local extinction in both predator combination treatments.
Distribution of the predators
The interactions between P. persimilis and N. californicus were apparent in the lower aggregation level of N. californicus in both predator combination treatments and the occupation of different leaves in the half predator combination treatment (TU+½ PP+½ NC). The high aggregation level of N. californicus alone (surprisingly higher than that of P. persimilis alone) was likely a consequence of the high density and continuous presence of T. urticae throughout the experimental period as compared to the other predator treatments (resulting in reduced variability). The aggregation level of N. californicus on bean (~1.9) was considerably higher than the level determined for this species on strawberry (~1.4) (Greco et al., Reference Greco, Liljeström and Sanchez1999). The aggregation level of P. persimilis was similar to the level determined for this species on rose (Zhang & Sanderson, Reference Zhang and Sanderson1995). Highly intriguingly, the aggregation level of N. californicus was influenced by P. persimilis but not vice versa. This was most likely the result of competition for the shared prey. The superior competitor, P. persimilis, strongly reduced the spider mite density and with that negatively affected the aggregation level of the inferior competitor, N. californicus (Kilpatrick & Ives, Reference Kilpatrick and Ives2003).
Three possible explanations or combinations, thereof, may be put forward to explain the difference in the spatiotemporal distribution of P. persimilis and N. californicus among leaves in the half predator combination treatment (TU+½ PP+½ NC). (i) The diet specialist, P. persimilis, is superior to generalist phytoseiid mites, including N. californicus, in detecting spider mite patches (Yao & Chant, Reference Yao and Chant1989; Zhang et al., Reference Zhang, Sanderson and Nyrop1992). Hence, P. persimilis may have colonized the spider mite patches earlier than did N. californicus. (ii) Neoseiulus californicus was less aggregated and more dispersed in the predator combination treatments, which was likely a consequence of inferiority in food competition (Kilpatrick & Ives, Reference Kilpatrick and Ives2003). (iii) Phytoseiulus persimilis may have avoided prey patches occupied by the IG predator, N. californicus. Prey patch avoidance by P. persimilis may be influenced by the distance to the cue source, its life stage and the type of cues emitted by prey and IG predators. Long distance volatile cues (distance of 360 to 400 mm) emitted from leaves or plants with either T. urticae or T. urticae and N. californicus did not trigger an avoidance response in P. persimilis (Janssen et al., Reference Janssen, Pallini, Venzon and Sabelis1999; Cakmak et al., Reference Cakmak, Janssen and Sabelis2006). When P. persimilis was allowed to move between leaves with spider mites and leaves with spider mites and the IG predator, N. californicus, P. persimilis preferentially oviposited in the IG predator-free patches (Walzer et al., Reference Walzer, Paulus and Schausberger2006). In contrast, N. californicus did not show a preference for prey patches with or without P. persimilis. These findings indicate that tactile cues or short distance volatile cues (of a few mm distance) are responsible for prey patch avoidance by P. persimilis females (Walzer et al., Reference Walzer, Paulus and Schausberger2006). Hence, it is possible that the different distribution of P. persimilis and N. californicus in the half predator combination treatment was the result of anti-predation behaviour of the inferior IG predator, P. persimilis. This pattern was not apparent in the full predator combination treatment, which was likely a result of the high overall predator density diminishing the chance of spatial segregation of the two predators.
Synthesis
Most studies on the spatial distribution of prey investigated the consequences of density-mediated and/or behaviour-mediated effects of single predator species. Here, we tried to incorporate the effects of competition and IGP between two predators on their distribution and that of their prey. Overall, our study indicates that (i) the predators P. persimilis and N. californicus determine the spatiotemporal distribution of the herbivorous spider mite T. urticae through both density-mediated (density reduction) and behaviour-mediated (triggering anti-predation behaviour) effects; (ii) the effects of the predators on the distribution of their prey are linked to diet specialisation, with both the generalist and specialist triggering upward movement of the spider mites yet the specialist exerting much stronger density-mediated effects on prey distribution than the generalist; (iii) the predators slightly affect each other's distribution and are in combination somewhat more dispersed than when alone, which may be mediated by direct interaction or by an altered distribution of the shared prey; and (iv) the overall effect of the predator combination on the distribution of T. urticae is mainly determined by a density-mediated effect of the more specialized, and therefore more risky predator, P. persimilis. The latter is in accordance with the finding that the effects of combined predators on prey phenotypes most often match the effects of the more risky predator alone (reviewed by Relyea, Reference Relyea2003).
Acknowledgements
Andreas Walzer was financially supported by the Austrian Federal Ministry of Agriculture and Forestry and the European Community (CRAFT).