Data visualization refers to the techniques used to communicate information by encoding it as visual objects (eg, points, lines, or bars) contained in graphics.1 The rapid progress in informatics in the last few years has made obtaining and processing large amounts of data possible. Data visualization is now more accessible to people without formal programming training. However, the best way to visualize data in the fields of infection prevention and antimicrobial stewardship remains unclear.Reference Ohannessian, Benet and Argaud2-Reference Willemsen, Jefferson, Mermel and Kluytmans5 Here, we provide an overview of data visualization theory and history, as well as recommendations and examples applied to the fields of infection prevention and antimicrobial stewardship.
Data visualization theory
Data visualization can be considered a means of communication. It can be compared to message transmission involving 3 major components: (1) an encoder who transmits a message through (2) a communication channel (hoping the message does not get distorted), after which the message arrives to (3) a decoder who receives the message. As in telephone communications, the encoder (person speaking) needs to choose an appropriate speed, volume, and tone of voice in addition to the actual message to achieve effective communication. These characteristics are adjusted to minimize potential distortion of the message through the telephone system. In data visualization, (1) the encoder can be one of several people: the infection prevention professional, a healthcare epidemiologist, or a data scientist. The message is the data (eg, hand hygiene compliance trends, infection rates, or standardized antimicrobial administration ratios); (2) the communication channel is visual (ie, the message is transformed into an image or graph); and (3) the decoders (receivers) are usually frontline staff, stakeholders, and decision makers.
Currently, the process of visually analyzing data is empiric, based on trial and error.Reference Wang and Shen6 We lack quantitative metrics of visualization quality relative to the amount of information contained in the data. Information theorists have studied how to quantify the information content and the potential distortion of a given message. To produce insightful visualizations, mutual information (ie, the amount of information from the data before the visualization and the data contained in the visualization) needs to be maximized and conditional entropy (ie, how much information about the data is still unknown after observing the image) needs to be minimized. This information theory approach to visualization has been applied to multiple problems, including choosing the best viewpoint to express volume of a 3D object in a 2D visual: think of how can you draw a cube (3D) on a piece of paper (2D), how to choose the best spot to place a light source to improve the visualization of tridimensional visuals, etc.Reference Gumhold7 However, most practical data scientists still rely on instinct, experience, and feedback from users to create their data visualization projects.
A brief history of data visualization
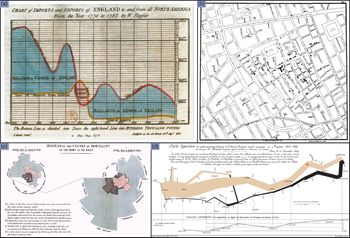
Michael Friendly has written a lively account of the history of data visualizationReference Friendly8 and many historical examples can be found on his website (http://datavis.ca/milestones/). Although data visualization may appear to be a new discipline, the graphic representation of quantitative information goes back many centuries. The earliest forms of data visualization are found in astronomical representations from Ancient Egypt and Greece. Over the following centuries, improvements in the instruments and techniques used to measure distances led to greater accuracy of geographical data and map making. The advent of the coordinate systems and the science of demography in the 16th century increased the applications of data visualization. During the 1700s, William Playfair created several popular chart types: line graphs, bar charts, pie charts, and circle graphs (Fig. 1a).
Pioneer data visualizations from (a) William Playfair, (b) John Snow, (c) Florence Nightingale and (d) Joseph Minard. Graphs reproduced from Wikipedia commons, the free media repository.

The 1800s saw an explosion in the number of visualizations used in many disciplines including science, medicine, economics, and cartography. In the world of the 1850s, cholera was believed to be spread by miasma in the air, and germs were not yet understood. John Snow graphed water sources and cases of cholera over a map of London (Fig. 1b). It became apparent that cases were clustered around the water pump on Broad Street. It turned out that the water was polluted by sewage from a nearby cesspit contaminated with cholera. His map changed how we use data visualizations and how we see microbes. Florence Nightingale used visualizations to demonstrate that soldiers died more often from zymotic “infectious” diseases than from wounds in her classic data visualization, “The Cause of Mortality in the Army in the East.” Her most famous design, which we use in varying forms today, was the “coxcomb” (Fig. 1c). The coxcomb is similar to a pie chart, but more intricate. In a pie chart, the size of the slice represents the proportion of data, whereas in a coxcomb, the length the slice extends radially from the center point represents the first layer of data. In her coxcomb during the Crimean War, the chart was divided evenly into 12 slices representing months of the year, with the shaded area of each month’s slice proportional to the death rate that month. Joseph Minard plotted commercial data using graphical dimensions so the viewer not only could see but also could calculate from the graphs. He is the creator of one of the most well-known data visualization pieces: the fate of the armies of Napoleon in the invasion of Russia (Fig. 1d). This graph was considered by Edward Tufte to be “the best statistical graphic ever drawn.”Reference Tufte9 Its importance comes from being able to rely geographical data, the army’s path and direction, the number of soldiers left as they traveled to and back from Russia, environmental parameters (temperature), and time. Also during the 1800s, statistical atlases became a popular way of displaying data collected by governments on economic, financial, and demographic factors. The best examples are contained in the Albums de Statistique Graphique published by the French Ministry of Public Works and the maps created by the US Census Bureau.
During the early 1900s, most governments stopped producing statistical atlases, giving way to a period of relative disdain for visualization among statisticians. This decline in the popularity of data visualization was perhaps in part due to the increasing complexity in the data. The need to hand draw visualizations likely became a limiting factor. By the 1960s, John Tukey regained legitimacy for data visualization, reintroducing it into formal statistics. He also created several now commonly used graphs in statistics and science (eg, stem-leaf plots and boxplots). The rapid growth in informatics technology in the subsequent years expanded our capacity to draw complex, multidimensional data with high accuracy. In the last 20–30 years, Edward TufteReference Tufte9 and others led a revolution in democratizing data visualization, proposing a number of principles explored in subsequent lines of this text. A new profession, data science, was created, consisting of data abstraction, manipulation, visualization, and automation. It is now possible to receive formal training in data science at many universities. Data science has been considered the best job in the United States from 2015 through 2019.10
Infection prevention and antimicrobial stewardship applications
Graphics of healthcare data are likely to be more enticing to the audience, better catching and keeping their attention. Beyond that effect, data visualization provides a better explanation of complex data and helps enable data-driven decision making. For instance, epidemic curves, choropleth maps, social network graphs, or phylogenetic trees have been increasingly used. Statistical process control (SPC) charts have also been extensively used in healthcare quality improvement including for healthcare associated infections (HAI), bacteremia, and needlestick injuries to discern outliers from random variation.Reference Benneyan11 By combining times series, statistical and graphical analysis of data, control charts help determine whether data exhibit natural variation.Reference Ilieş, Anderson and Salem12 However, small sample sizes in single hospitals could make it harder to detect meaningful variations until processes have significantly deviated. Also, because HAI surveillance is sometimes performed months after the event (eg, some surgical site infections have a 90-day surveillance period), reacting only to statistically significant outliers can delay responses to outbreaks in healthcare facilities.
One limitation of data visualization in epidemiological surveillance is the uncertainty about which specific methods are best for detecting clinically important increases in infection rates.Reference Gustafson13 Carroll et alReference Carroll, Au, Detwiler, Fu, Painter and Abernethy4 performed a systematic review on data visualization for infectious disease epidemiology. It revealed that people had diverse purposes, needs, and preferences with different tools. Organizations also have noticed challenges in integrating tools into their routines and in obtaining administration support.Reference Carroll, Au, Detwiler, Fu, Painter and Abernethy4
Some evidence indicates that using data visualization principles impacts healthcare outcomes. Graber et alReference Graber, Jones and Goetz14 demonstrated a 2% decrease in total antimicrobial use (the greatest decrease was ~11% in agents for methicillin-resistant Staphylococcus aureus) after the implementation of an interactive web-based antimicrobial dashboard and a standardized antimicrobial usage report. As with most infection prevention and antimicrobial stewardship interventions, we believe that data visualization is a tool, and when it is used as part of a bundle, it can help change human behavior, identify areas where more efforts are needed, and ultimately impact outcome measures. Optimal data visualization is human factors engineering for the eye: a well-designed graph will be aesthetically pleasing, convey complex information, and should require little background information, allowing decision makers to understand information efficiently and to reach more informed decisions faster. In addition, healthcare epidemiologists are accessing massive volumes of data currently being collected in healthcare settings (eg, temperature and blood pressure monitoring in operating rooms, sensors for monitoring hand hygiene compliance). More complex methods of studying pathogen transmission are being used, too (eg, bioinformatics approaches for genomic data). Data visualization helps healthcare professionals understand the complexity derived from these larger datasets and intricate methods and to effectively present it to stakeholders.
One of the main uses of data visualization in infection prevention and antimicrobial stewardship is the tracking of healthcare-associated infection incidence and antibiotic utilization rates. These data are usually updated on a monthly or quarterly basis. Many hospitals currently use an electronic surveillance system (eg, Theradoc by Premier Healthcare Solutions, Charlotte, NC, or Epic ICON/Bugsy by Epic Solutions, Verona, WI) to abstract information and to present trends to stakeholders. Data are also uploaded to the Centers for Disease Control and Prevention National Healthcare Safety Network (NHSN) for benchmarking and public reporting. Using the abstraction system as the main data repository can be problematic: data can be lost when transferring from the abstraction tool to NHSN. Also, maintaining parallel systems can be resource intensive.
We use NHSN as our main data repository, decreasing the possibility of discrepancies in the data. We download data from NHSN on a monthly basis and create dashboards using visualization software. We have validation steps every time data travels from one software to another because data can be distorted or missed in each transfer. After downloading data from NHSN and completing validation, we link the NHSN data to automated data extracts from the electronic medical record to pair HAI and antibiotic utilization outcomes with hospital process metrics not reported to the NHSN (eg, chlorhexidine bathing compliance, antibiotic prophylaxis timeliness, and patient temperatures in the operating room) (Fig. 2).
Healthcare-associated infection and antimicrobial utilization data flow from (1) the electronic medical record to the Centers for Disease Control National Healthcare Safety Network (NHSN). (2) Detailed line list data downloads from the NHSN database into a visualization software for data visualization creation, followed by (3) display of graphics to frontline staff. (4) Graphics can be enhanced by adding process metric data mined from the electronic medical record.

Best practices in data visualization
Technically, any visual display of quantitative data can be considered data visualization. Knowing and following best practices, however, can make visualizations easier to understand, with less possibility of information distortion: an interactive version of the dashboards presented here can be found in: “https://public.tableau.com/profile/uiowaipc#!”.
Use of color
Institutions tend to use green, yellow, and red (ie, the stoplight format) to denote progress in achieving goals: for example, whether an inpatient unit has met central-line–associated bloodstream infection (CLABSI) goals, is close to meeting them, or needs improvement. However, this color selection may not be optimal: up to 8% of men and 0.5% of women of Northern European ancestry have the common form of red–green color blindness.15 There are many alternatives to green and red. For instance, to highlight problems, simply use red, with white (eg, no color) being the default. Another option is to use blue and red, with blue replacing green. If green and red must be used, design redundancy can be used to make marks distinguishable, regardless of color. For instance, using a green “up arrow” and a red “down arrow” does not rely on color alone, but encodes performance via the type of arrow. Whatever the selection of colors, the visualization should translate into greyscale without loss of information, since visualizations may often be printed in black and white. Lisa Charlotte Rost has nicely summarized key aspects related to colors in data visualization.Reference Rost16
Data-to-ink ratio and chart junk
When creating a graph, avoid details that do not add information. A graph should strive to provide the most information with the least amount of ink (or pixels). Common details that are often unnecessary include 3-dimensional graphs, heavy grid lines, and excessive tick marks.Reference Tufte9 These unnecessary and distracting elements that add little meaning are often called “chart junk.”Reference Tufte9 Avoid using dots, dashes, hatching, or checkered patterns to fill the interior of bar charts or polygons because they may provide a false sense of movement. Instead, we recommend using different shades of the same color (eg, light blue, medium blue, and dark blue). Adding unnecessary details to a graph can make the graph harder to interpret.
Zero as baseline
To avoid introducing bias, it is almost always best to display information with the axis beginning at zero. For example, when displaying compliance with a process metric, use an axis going from 0% to 100% compliance. Occasionally, it is acceptable to zoom in on a smaller range in your axes: if zero is not a meaningful reference point or if the numbers will always be in a very small range and relative change is important. It is important to not mislead the viewer—only zoom in if it is truly the best way to communicate your data.
Useful graphs for infection prevention and antimicrobial stewardship
Choosing the correct type of graph or chart depends on the data being analyzed as well as the message being conveyed. For instance, we have used multiple types of graphs (including bar, line, and scatter plots) to display data, depending on the purpose at hand. Here, we outline some of the most important examples.
Case counts, rates, ratios, and days of therapy
We routinely display case counts and rates as line graphs. In Figure 3, we display HAI rates as lines. Such visualization allows users to rapidly detect increases in counts or rates compared to previous quarters and determine the HAIs with the highest rates of infection. Although differentiating clinically or epidemiologically significant changes from nonsignificant changes is tough, these obvious visual changes trigger meaningful discussions. For example, in Figure 3, CLABSI rates have been decreasing for the last 3 years, whereas Clostridioides difficile infection rates have remained stable. There are two main reasons to consider a line graph instead of a bar graph. First, if you need to zoom in on the axis, this is better done in a line chart. Truncating a bar chart is misleading, as bars are interpreted based on their length, whereas lines are interpreted based on their location. Second, line graphs allow you to display multiple categories of data simultaneously via multiple lines. Avoid plotting too many lines in the same graph. Graphs with too many lines can be hard to interpret and are commonly known as spaghetti charts.
Integrated dashboard containing standardized infection ratios, infection rates, and process metrics: hand hygiene and chlorhexidine bathing over time. Note. CLABSI, central line-associated bloodstream infection; SIR, standardized infection ratio; CAUTI, catheter-associated urinary tract infection; C.diff, Clostridiodes difficile infection; MBI, mucosal barrier injury; CHG, chlorhexidine; FY, fiscal year.

Plotting SIRs or rates per surgeon
Sorted horizontal bar graphs are good when there are several data points (eg, nursing units in a hospital, or type of surgeries) and allow for spelling out the entire unit name without having to rotate one’s head to read them (Fig. 4). In the left graph of Figure 4, we present standardized infection ratios (SIR) on the x-axis, stratified by the type of surgery (NHSN code) on the y-axis. Such a graph allows departments to detect outliers who may benefit from coaching or assessment of surgical site infection (SSI) prevention practices. Scatter plots are useful when comparing 2 continuous variables (eg, number of surgeries per surgeon and infection rates; see Fig. 4, graph on the right side), and they are especially useful for data exploration. Scatter plots allow users to easily compare individuals and identify cohorts. In the graph at the right of Figure 4, we also display how the SIR (x-axis) varies in relationship with the number of procedures performed (y-axis) by each surgeon. This plotting system itself cannot identify underlying problems such as risk factors for SSIs in each procedure. However, Figure 4 may suggest that infection preventionists should investigate SSIs after CABG first.
Surgical site infection standardized infection rates (SIR) by surgery type (left) and by surgeon (right): Each dot represents a surgeon. Note. CABG, coronary artery bypass grafting.

Temperature monitoring in operative rooms
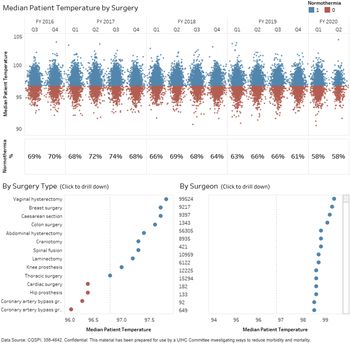
The top graph of Figure 5 displays median intraoperative patient temperatures over time, classified as normothermia (top) and hypothermia (bottom). This dashboard can be stratified by surgery type (left lower graph) or primary surgeon (right lower graph).
Median patient temperature in the operating room. The top graph shows the distribution of median patient temperatures above and below 36°C (ie, the normothermia threshold) for the entire hospital. The middle row displays the percentage of patients above the normothermia threshold. The bottom row displays median temperature by procedure type and surgeon. The dashboard allows for selection of either surgery type or surgeon for drill down of temporal trends.

Surgical site infection prevention metrics compliance
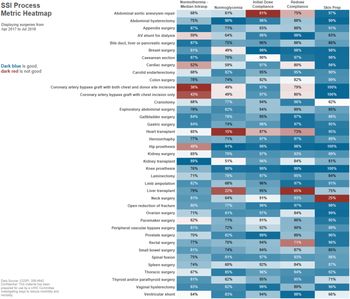
Heat maps show the relationship of 2 variables while a third variable varies in color. For example, a heatmap can be used to display surgery types versus prevention recommendations, with compliance as the third variable (Fig. 6). We display 6 SSI prevention process metrics (x-axis) versus the 40 NHSN procedures (y-axis). Color is used to emphasize procedures or metrics in need of improvement. These graphs allow users to rapidly identify potential areas of improvement.
Surgical site infection prevention metrics compliance for 40 National Healthcare Safety Network Procedures. Color is used to emphasize procedures or metrics in need of improvement Note. Dark red color is worse, dark blue is better.

Displaying process metrics to frontline staff
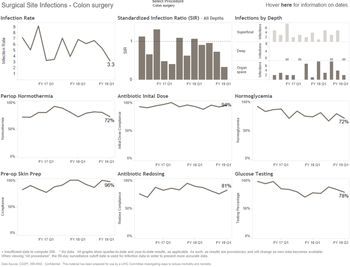
We often present infection rates next to infection prevention process metrics. For example, we show SSI rates next to plots for compliance with antibiotic prophylaxis, normothermia, glucose monitoring, fraction of inspired oxygen, etc (Fig. 7).
Surgical site infection (SSI) rates, standardized infection ratios, and SSI depth next to plots for compliance with process metrics: normothermia, antibiotic prophylaxis, glucose monitoring, and skin preparation.

Antimicrobial stewardship
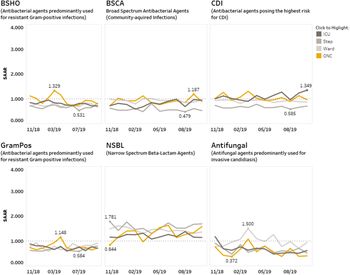
Figure 8 displays days of therapy and standardized antimicrobial administration ratios. When presenting antimicrobial data, multiple options are required: inpatient unit type (intensive care unit [ICU], hematology oncology units, medical surgical units, etc), antimicrobial group (anti–methicillin-resistant Staphylococcus aureus, antipseudomonal, narrow-spectrum β-lactams, anti–multidrug-resistant organisms, etc), moment of antimicrobial utilization (ie, choice, change or completionReference Graber, Jones and Goetz14 or the 4 or 5 moments of antibiotic decision makingReference Devchand, Stewardson and Urbancic17,Reference Tamma, Miller and Cosgrove18 ), route (ie, intravenous, oral, etc), and progress over time. For instance, the upper left graph suggests that antibiotics used for resistant gram-positive bacteria are most used in oncology unit around March 2019. Given patients in oncology unit are often sicker than patients in other units, this might be an expected result. However, given that the number is higher than that in the ICU, we likely need to further investigate reasons (eg, provider preference, prophylaxis vs treatment, patient demographics). The lower left graph reveals that infection due to gram positive bacteria were high in the oncology unit. These findings should lead to discussion regarding why the infection was high in that month. The upper right graph shows that use of antibiotics with high risk for Clostridiodes difficile appear to be increasing in the ICU. The lower right graph reveals that antifungal agents are most used in medical-surgical wards. These data should trigger chart reviews in all patients receiving antifungal therapy in these wards to investigate appropriateness of the use of antifungal agents.
Interactive antimicrobial utilization dashboard. Note. ICU, intensive care unit; Step, stepdown unit; ONC, hematology-oncology unit; SAAR, standardized antimicrobial administration ratio.

The future of visualization in healthcare epidemiology
Although healthcare epidemiologists tend to primarily use data visualization to present HAIs and their respective process metrics over time, more complex uses are increasingly being presented. Bush et alReference Bush, Barbosa and Farooq19 created a mobility network and calculated network centrality measures for each hospital unit. They showed that measures calculated using inpatient transfers, unit-wide risk, and current infections helped warn about risk of Clostridiodes difficile outbreaks using network plots.Reference Bush, Barbosa and Farooq19 Willemsen et alReference Willemsen, Jefferson, Mermel and Kluytmans5 described the infection risk scan (IRIS method) and spider plots as tools to measure and compare infection control practices in 2 hospitals in Europe and the United States.Reference Willemsen, Jefferson, Mermel and Kluytmans5 Additionally, the almost inevitable introduction of whole-genome sequencing and machine learning in healthcare epidemiology will add a large amount of data that will be best understood if presented using data visualization.Reference Reagan, Chan and Vanhoozer20-Reference Roth, Battegay, Juchler, Vogt and Widmer23 As healthcare epidemiologists, we will need to become better acquainted with phylogenetic analysis, neighbor-joining trees, and single-nucleotide polymorphism matrices. Mathematical modeling and computational epidemiology are also expanding into healthcare epidemiology. Examples include the use of Markov chain models to estimate the effects of HAI prevention efforts, such as chlorhexidine bathingReference Reagan, Chan and Vanhoozer20; assessment of patient and healthcare worker mobility within institutionsReference Butler, Monsalve and Thomas24; and pattern recognition using cell phones, wearables, and scraping social media data.Reference Miller, Singh, Koehler and Polgreen25 The complexity of data in these disciplines can be translated into graphics for easier understanding. Healthcare epidemiology data science will have to constantly evolve to increase the accessibility of graphics to people without formal training in bioinformatics. Great advice is now available regarding how to use data visualization for storytellingReference Knaflic26 and how to create dashboards.Reference Wexler, Shaffer and Cotgreave27,Reference Benevento, Rowell, Steeger, Cutrell and Morales28 Helpful resources are also available on the web,29-31 in blogs,Reference Knaflic32-Reference Kritzman and Salinas36 and on social media.
In conclusion, as healthcare facilities become more reliant on their big data assets to make important decisions regarding patient outcomes and financial strategies, optimal data visualization habits have become significantly crucial for ensuring that information is interpreted and utilized appropriately. At our institution, we strive to make our data visualization projects informative but also aesthetically pleasing and even fun. We enjoy creating new ways of visualizing infection prevention and antimicrobial stewardship data, and we hope that by considering aesthetics, the intended audience for our graphs will enjoy viewing them as well. Creating striking, engaging, and meaningful data visualization can help to break down complex infection problems into manageable component parts, enabling infections preventionists understand underlying problems, and enabling providers deliver the highest quality care to patients.
Acknowledgments
We thank the infection prevention professionals, antimicrobial stewardship pharmacists, performance improvement engineers, and data analysts from the quality improvement program and frontline staff at the University of Iowa for their ongoing support and feedback.
Financial support
No financial support was provided relevant to this article.
Conflicts of interest
All authors report no conflicts of interest relevant to this article.