1. Introduction
Two-dimensional flow models have often been used as an idealised description of atmospheric and oceanic fluid dynamics. These models afford the maximum simplicity while retaining the key advective nonlinearity of fluid motion and the associated scale cascade. However, such models fail to capture the intrinsic three-dimensionality of atmospheric and oceanic flows at ‘small’ scales, where the effects of rotation and stratification strongly compete (Dritschel, de la Torre Juárez & Ambaum Reference Dritschel, de la Torre Juárez and Ambaum1999). Nevertheless, mathematically, much interest remains in understanding how nonlinearity organises fluid motion in this simple context.
In this paper, we examine the behaviour of a bounded two-dimensional incompressible inviscid (dissipationless) flow at long times
 $t$
. The flow evolves freely from some prescribed initial condition, which is subsequently transformed by nonlinearity. No forcing is applied.
This problem has been the subject of much previous research. Almost all laboratory experiments and numerical simulations have indicated a final state consisting of a steady large-scale circulation pattern filling the whole domain (see Matthaeus et al.
Reference Matthaeus, Stribling, Martinez, Oughton and Montgomery1991a
,Reference Matthaeus, Stribling, Martinez, Oughton and Montgomery
b
; Montgomery et al.
Reference Montgomery, Matthaeus, Stribling, Martinez and Oughton1992; Montgomery, Shan & Matthaeus Reference Montgomery, Shan and Matthaeus1993; Brands et al.
Reference Brands, Stulemeyer, Pasmanter and Schep1997; Bouchet & Venaille Reference Bouchet and Venaille2012 for a sample of the vast literature). Unsteady final states have also been reported in several numerical simulations for doubly-periodic planar domains. Here, often two opposite-signed vortices emerge (see Qi & Marston Reference Qi and Marston2014 and references). Segre & Kida (Reference Segre and Kida1998) found various unsteady final states using initial configurations of constant-vorticity patches, but the simulations appear not to have gone far enough in time for the proper final state to evolve (Yin, Montgomery & Clercx Reference Yin, Montgomery and Clercx2003). Morita (Reference Morita2011) found a late-time persistent oscillatory state by starting from a perturbed zonal flow. However, both examples of unsteady final states start from special initial conditions that may not develop broad-band turbulence in which energy is widely shared among many wavenumbers. It is commonly believed that although various metastable states can persist for a long time due to insufficient mixing, the flow will settle into a steady final state if it undergoes strong turbulent mixing during the evolution (for example see Yin et al.
Reference Yin, Montgomery and Clercx2003). Theoretically, an explanation for this has been proposed by Miller (Reference Miller1990), Robert (Reference Robert1991), Robert & Sommeria (Reference Robert and Sommeria1991) and Miller, Weichman & Cross (Reference Miller, Weichman and Cross1992), hereafter ‘MRS’. (Reviews may be found in Chavanis Reference Chavanis2002; Eyink & Sreenivasan Reference Eyink and Sreenivasan2006; Majda & Wang Reference Majda and Wang2006; Chavanis Reference Chavanis2009; Bouchet & Venaille Reference Bouchet and Venaille2012; Herbert Reference Herbert2013; Qi & Marston Reference Qi and Marston2014.) The MRS theory predicts that the nonlinear dynamics, characterised by intense turbulent mixing, ultimately results in a stationary large-scale, domain-filling flow. Moreover, this flow is obtained as a statistical-mechanical equilibrium (assuming random fluctuations of fine-scale vorticity) dependent only on the inviscid invariants. Those include energy, circulation, and in general an infinite set of ‘Casimirs’ that determine the occupation of vorticity
 ${\it\omega}$
of each level within the fluid (this is the ‘vorticity measure’).
Verification of the MRS theory has met with mixed success (Qi & Marston Reference Qi and Marston2014). The theory itself is difficult to work with when many Casimirs are taken into account, and various simplifications have been put forth (see e.g. the review by Bouchet & Venaille Reference Bouchet and Venaille2012). Verification is also problematic when nearly all of the numerical methods used suffer from some form of dissipation, artificial or real, not present in the original inviscid system for which the theory was developed. A few numerical methods have been developed that conserve many invariants, including the Casimirs (Abramov & Majda Reference Abramov and Majda2003; Dubinkina & Frank Reference Dubinkina and Frank2010). Note that as numerical simulations inevitably have finite resolution, the Casimirs or the vorticity field observed numerically are only the coarse-grained counterparts of those quantities of the inviscid system: the resolved vorticity field corresponds to the coarse-grained vorticity
 $\bar{{\it\omega}}$
, not
 ${\it\omega}$
, and the second- and higher-order Casimirs of the resolved vorticity are different from the original fine-grained ones dependent on
 ${\it\omega}$
. These conservative numerical methods would appear to be ideal, and moreover they would overcome the long-standing problem of how unresolved scales impact on resolved ones, the ‘closure problem’. However, an irrefutable feature of two-dimensional turbulence is the enstrophy cascade, occurring as thin vorticity filaments stretch and thin to ever finer scales. By conservation, this cascade is necessary to build up energy at ever larger scales through an ‘inverse cascade’ (Fjørtoft Reference Fjørtoft1953; Dritschel et al.
Reference Dritschel, Scott, Macaskill, Gottwald and Tran2009, and references), as indeed is anticipated in the MRS theory. That is, energy growth at large scales requires a cascade of enstrophy to small scales. Since the Casimirs involve integrals of powers of the vorticity distribution, all but the first power (the circulation) cannot be even approximately conserved at any finite resolution, after sufficiently long time. Forcing conservation of quantities which cannot be conserved can only lead to spurious conclusions.
Verification of the MRS theory is further problematic because the invariant fine-grained Casimirs that the theory depends on cannot be measured from any numerical simulation of finite resolution. However, in practice the resolved Casimirs are often used to determine the values of the fine-grained Casimirs (at most approximately). Notably, the coarse-grained vorticity field
 $\bar{{\it\omega}}$
predicted by the MRS theory often agrees with that emerging at large times in numerical simulations, if the late-time values of the resolved Casimirs are applied. Still these resolved Casimirs are not conserved and cannot be predicted from an arbitrary initial flow state of a numerical simulation, which limits the predictive power of the MRS theory.
Another fundamental issue concerns ergodicity, namely that ensemble averages over equi-probable states with the same conserved quantities equate to time averages of a single state over a sufficiently long period of time. Two-dimensional flows are generally not ergodic (Whitaker & Turkington Reference Whitaker and Turkington1994; Bricmont, Kupiainen & Lefevere Reference Bricmont, Kupiainen and Lefevere2001; Bouchet & Corvellec Reference Bouchet and Corvellec2010), though they are assumed to be in the MRS theory. It has been argued that MRS theory may still apply to states which exhibit strong turbulent mixing over the course of their evolution, e.g. to initially small-scale isotropic vorticity fields. There are many such states. But it is unclear whether they satisfy ergodicity even approximately.
The present paper is not intended to be a critique only of MRS theory; rather, we wish to present fresh evidence that even the central claim for the existence of a final steady equilibrium vorticity distribution
 $\bar{{\it\omega}}$
is likely to be false. Instead of the much studied doubly periodic planar domain, we consider flows on the sphere, where statistical mechanics has not seen much application. While we agree that one can never carry out numerical simulations to infinite time, our results strongly suggest that, at least for flows on a sphere, unsteadiness persists for all time. Note that both Segre & Kida (Reference Segre and Kida1998) and Morita (Reference Morita2011) have focused on the type of final unsteadiness that is a result of special initial conditions (or insufficiently developed turbulence), but we argue that unsteadiness is generic by using a random initial state that generates fairly strong turbulent mixing: the unsteadiness is intrinsic to a system of compact coherent vortices. Our simulations are carried out much further in time and at much higher resolutions compared to those two studies, and the robustness of our result is verified by comparing two very different numerical approaches with fundamentally different forms of numerical dissipation.
The paper is organised as follows. In the next section, we briefly review the equations and the associated conserved quantities, then describe two very different numerical methods employed. Both methods are used in § 3 at many different resolutions, on the same initial data, to study the long-time convergence of the results. A few conclusions are offered in § 4.
2. Governing equations and numerical methods
2.1. Two-dimensional flow on a sphere
We wish to study a freely evolving incompressible two-dimensional flow, with no forcing or dissipation, confined to the surface of a unit sphere centred at the origin. In this case, the scalar vorticity
 ${\it\omega}$
normal to the surface is materially conserved,
 $$\begin{eqnarray}\frac{\text{D}{\it\omega}}{\text{D}t}=\frac{\partial {\it\omega}}{\partial t}+\boldsymbol{u}\boldsymbol{\cdot }\boldsymbol{{\rm\nabla}}{\it\omega}=0,\end{eqnarray}$$
where
 $\boldsymbol{u}=\boldsymbol{r}\times \boldsymbol{{\rm\nabla}}{\it\psi}$
is the incompressible velocity field,
 $\boldsymbol{r}$
is the position of a point on the surface (
 $|\boldsymbol{r}|=1$
), and
 ${\it\psi}$
is the scalar streamfunction. With
 $\boldsymbol{{\rm\nabla}}\boldsymbol{\cdot }\boldsymbol{u}=0$
, the definition
 ${\it\omega}=\boldsymbol{r}\boldsymbol{\cdot }(\boldsymbol{{\rm\nabla}}\times \boldsymbol{u})$
yields Poisson’s equation for
 ${\it\psi}$
:
 $$\begin{eqnarray}{\rm\nabla}^{2}{\it\psi}={\it\omega}.\end{eqnarray}$$
These equations were originally derived by Zermelo (Reference Zermelo1902) and Charney (Reference Charney1949).
2.2. Constants of the motion
Inviscid two-dimensional flow is an infinite-order Hamiltonian system with the kinetic energy
 $$\begin{eqnarray}E=\frac{1}{2}\iint |\boldsymbol{u}|^{2}\,\text{d}{\it\Omega}=-\frac{1}{2}\iint {\it\omega}{\it\psi}\,\text{d}{\it\Omega}\end{eqnarray}$$
serving as the Hamiltonian. Above, the second expression is obtained after integration by parts, and
 $\text{d}{\it\Omega}$
is the differential surface area element. The integral is taken over the entire surface of the sphere. Besides
 $E$
, rotational symmetry about any axis implies that the vector angular impulse
 $$\begin{eqnarray}\boldsymbol{L}=\iint {\it\omega}\boldsymbol{r}\,\text{d}{\it\Omega}\end{eqnarray}$$
is also conserved. Non-zero
 $\boldsymbol{L}$
implies a mean rotation with vector angular velocity
 $\propto \boldsymbol{L}$
. (Below, we only consider flows with
 $\boldsymbol{L}=0$
to avoid starting with a flow organised at the largest possible scale.) Finally, material conservation of vorticity and incompressibility imply that a generally infinite number of additional quantities, namely
 $$\begin{eqnarray}\mathscr{C}_{n}=\iint {\it\omega}^{n}\,\text{d}{\it\Omega},\quad n=2,3,4,\ldots ,\end{eqnarray}$$
are conserved. (
 $\mathscr{C}_{1}=0$
automatically; no net circulation is possible on a closed surface.) The
 $\mathscr{C}_{n}$
are called the ‘Casimirs’. Their conservation is a consequence of the fact that the fractional area occupied by each vorticity value is conserved. For a continuous vorticity distribution, this fractional area is generally infinitesimal, and it is then useful to describe it as a ‘measure’, or probability density
 $p({\it\omega})$
: the area occupied by vorticity in the range
 $[{\it\omega},{\it\omega}+\text{d}{\it\omega}]$
is
 $4{\rm\pi}p({\it\omega})\,\text{d}{\it\omega}$
. The conservation of all
 $\mathscr{C}_{n}$
is equivalent to the conservation of
 $p({\it\omega})$
.
The quadratic Casimir
 $\mathscr{C}_{2}$
is proportional to the ‘enstrophy’
 $Z$
(i.e.
 $Z=\mathscr{C}_{2}/2$
). It plays a key role in the so-called ‘dual cascade’ of two-dimensional turbulence, where nonlinearity generally results in a direct cascade of the spectral enstrophy density, enabling an inverse cascade of the spectral energy density (Fjørtoft Reference Fjørtoft1953). This inverse cascade is often associated with the emergence of large-scale flow features, a general prediction of the MRS theory discussed in § 1.
Beyond the conservation of an infinite number of Casimirs, (2.1) further implies the existence of a topological constraint that contours of vorticity cannot cross. This non-local constraint is usually ignored in the construction of statistical descriptions.
2.3. Numerical methods
Two very different numerical methods are used to cross-verify our conclusions. The first is a purely grid-based method using a quasi-isotropic spherical ‘geodesic’ grid consisting of
 $D$
cells, hereafter referred to as the ‘geodesic grid method’ or ‘GGM’ (Heikes & Randall Reference Heikes and Randall1995a
,Reference Heikes and Randall
b
; Qi & Marston Reference Qi and Marston2014). In the absence of explicit numerical dissipation, the GGM conserves both energy
 $E$
and enstrophy
 $Z$
. To remove enstrophy cascading to small scales, quad-harmonic hyperviscosity is applied by adding the term
 ${\it\nu}_{4}({\rm\nabla}^{2}+2){\rm\nabla}^{6}{\it\omega}$
to the right-hand side of (2.1) (the
 $({\rm\nabla}^{2}+2)$
operator ensures
 $\boldsymbol{L}$
is conserved). The coefficient
 ${\it\nu}_{4}$
for any given resolution
 $D$
is chosen so that the most rapidly dissipating mode decays at a rate of
 $160$
(initially,
 $|{\it\omega}|_{max}=5.8$
, see below). Adding explicit dissipation of course changes the original problem, but we argue it is necessary to account for the forward cascade of enstrophy from resolved to unresolved scales. Hyperviscosity, however, has unwanted side effects, and in particular it can amplify vorticity extrema (Jiménez Reference Jiménez1994; Mariotti, Legras & Dritschel Reference Mariotti, Legras and Dritschel1994; Yao, Dritschel & Zabusky Reference Yao, Dritschel and Zabusky1995). Nonetheless, hyperviscosity is more scale selective than ordinary viscosity and much less dissipative overall for a given resolution
 $D$
. Time stepping is carried out with a second-order leapfrog scheme, using a time step of
 ${\rm\Delta}t=0.005$
at all resolutions. (The time step respects the CFL stability constraint.) Decorrelation of even and odd time levels in the leapfrog scheme is avoided by applying a weak Robert–Asselin time filter (
 ${\it\alpha}=0.001$
), improved as recommended in Williams (Reference Williams2009), with the modification parameter
 $0.53$
. We have checked that using a smaller value of
 ${\it\alpha}=10^{-4}$
makes little difference. Hyperviscosity is implemented explicitly. GGM is freely available online. (GGM is implemented in the application ‘GCM’ that is available for OS X 10.9 and higher on the Apple Mac App Store at URL http://appstore.com/mac/gcm.)
The second method is the ‘combined Lagrangian advection method’ (CLAM, Dritschel & Fontane Reference Dritschel and Fontane2010). This is a hybrid method, using material vorticity contours (solving
 $\text{d}\boldsymbol{r}/\text{d}t=\boldsymbol{u}(\boldsymbol{r},t)$
) to accurately and straightforwardly satisfy the conservative form of (2.1), but also making use of conventional grid-based procedures to invert (2.2) and to interpolate
 $\boldsymbol{u}$
at contour nodes. CLAM is an extension of the closely related contour-advective semi-Lagrangian algorithm (CASL, Dritschel & Ambaum Reference Dritschel and Ambaum1997). CLAM additionally solves (2.1) for
 ${\it\omega}$
on a grid and blends this grid-based solution with the contour-based one at the end of every time step to significantly improve energy conservation compared to CASL. This is essential for carrying out exceptionally long simulations, as required here. In contrast to GGM, which represents the vorticity as a continuous variable on a discrete grid in space, in CLAM the vorticity itself is discretized, and the contours can move continuously in space. A contour spacing of
 ${\rm\Delta}{\it\omega}=0.1$
is used in all simulations here, corresponding to 109 contour levels. Details of the method along with tests and comparisons with other methods may be found in Dritschel & Fontane (Reference Dritschel and Fontane2010).
A few additional features are required for the implementation of CLAM in spherical geometry. Following Mohebalhojeh & Dritschel (Reference Mohebalhojeh and Dritschel2007), we employ a regular latitude–longitude grid of dimensions
 $n_{g}\times 2n_{g}$
, enabling fast Fourier transforms (FFTs) in longitude. Polar points are avoided by placing latitudes at
 $-{\rm\pi}/2+(\,j-1/2){\rm\pi}/n_{g}$
, for
 $j=1,2,\ldots ,n_{g}$
. Latitude derivatives are computed spectrally after carrying out FFTs along great circles passing through the poles. The inversion of Poisson’s equation (2.2) for
 ${\it\psi}$
is performed using fourth-order compact differencing in latitude for each longitudinal wavenumber. For the time evolution, CLAM evolves side-by-side a contour representation of
 ${\it\omega}$
, a gridded representation, and a residual gridded field to minimise numerical dissipation and to achieve excellent conservation properties (see Dritschel & Fontane Reference Dritschel and Fontane2010). The gridded fields are evolved semi-spectrally, using the pseudo-spectral method whereby nonlinear products are carried out in physical space. Only the small residual field is damped by a weak bi-harmonic hyperviscosity to control the build-up of high-wavenumber enstrophy, using a damping rate of
 $2{\it\omega}_{rms}(t)$
on wavenumber
 $n_{g}$
(initially,
 ${\it\omega}_{rms}=1.7060324$
and decays thereafter). A fourth-order Runge–Kutta method is used for time stepping, with an adaptive time step
 ${\rm\Delta}t=$
min
 $\{0.1{\rm\pi}/|{\it\omega}|_{max},0.7{\rm\pi}/(n_{g}|\boldsymbol{u}|_{max})\}$
. Contours are regularised periodically by ‘contour surgery’ at the subgrid scale
 ${\rm\pi}/16n_{g}$
(Dritschel Reference Dritschel1988), and occasionally by contour regeneration, using the standardised parameter settings set out in Fontane & Dritschel (Reference Fontane and Dritschel2009).
Notably, the effective resolution of CLAM is approximately
 $16$
times finer in each direction than the basic ‘inversion’ grid of dimensions
 $2n_{g}\times n_{g}$
, based on previous direct comparisons with standard pseudo-spectral methods (Dritschel & Scott Reference Dritschel and Scott2009; Dritschel & Fontane Reference Dritschel and Fontane2010; Dritschel & Tobias Reference Dritschel and Tobias2012).
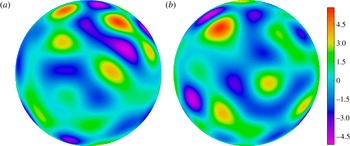
Initial vorticity distribution
 ${\it\omega}(\boldsymbol{r},0)$
as seen from the equatorial plane, (a) at
 $0^{\circ }$
longitude and (b) at
 $180^{\circ }$
longitude. Colours (online) range from blue/purple for
 ${\it\omega}={\it\omega}_{min}=-5.1187$
through green to red for
 ${\it\omega}={\it\omega}_{max}=5.7996$
. An orthographic projection is used.

3. Results
3.1. Flow initialisation and evolution
A number of simulations differing only in resolution were carried out using both the GGM and the CLAM methods. In GGM, we used resolutions
 $D=163\,842$
,
 $655\,362$
and
 $2\,621\,442$
, while in CLAM, we used resolutions
 $n_{g}=128$
,
 $256$
,
 $512$
and
 $1024$
. All simulations start with an identical vorticity field
 ${\it\omega}(\boldsymbol{r},0)$
built from a set of spherical harmonics with degree
 $4\leqslant l\leqslant 10$
; this field is shown in figure 1 (see appendix A for the amplitudes used). Other initial conditions were tried and produce qualitatively similar results. Generally, these lead to a dominantly quadrupolar but unsteady vorticity field at late times, except for special initial conditions when the vorticity is nearly proportional to the streamfunction or when the energy is shared among only a few low-wavenumber modes.
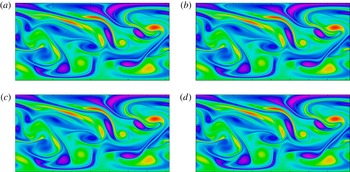
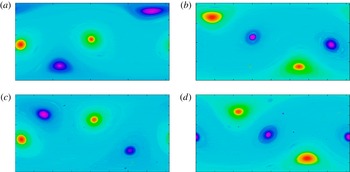
For the specific initial conditions in figure 1, the subsequent evolution, for early times, is nearly indistinguishable in all of the numerical simulations conducted; this is illustrated in figure 2 at
 $t=4$
(note, the eddy turnover time
 $t_{eddy}=4{\rm\pi}/|{\it\omega}|_{max}=2.1668$
). Here, the two highest-resolution simulations carried out using GGM are compared with the two lowest-resolution simulations carried out using CLAM. By this stage of the evolution, the scale cascade of
 ${\it\omega}$
is still well resolved, though a small fraction of the enstrophy
 $Z$
(
 ${<}1\,\%$
) has already been lost.
Early-time vorticity distribution
 ${\it\omega}(\boldsymbol{r},4)$
shown as a function of longitude and latitude for (a) GGM at
 $D=655\,362$
, (b) GGM at
 $D=2\,621\,442$
, (c) CLAM at
 $n_{g}=128$
, and (d) CLAM at
 $n_{g}=256$
. The images are rendered as described in figure 1. The percentage decay in enstrophy
 $Z$
by this time is 0.13 %, 0.02 %, 0.48 % and
 ${<}0.01\,\%$
, respectively. Same colour scale as in figure 1.

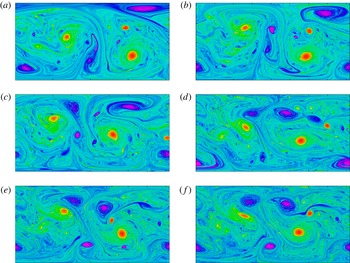
By
 $t=40$
, ten times further into the evolution, the simulations begin to diverge: see figure 3 which includes now the two highest-resolution CLAM simulations at
 $n_{g}=512$
and
 $1024$
. By this time, significant enstrophy dissipation has occurred, albeit least in the highest-resolution case. Vorticity contours are stretched nearly exponentially (at a rate comparable to
 $|{\it\omega}|_{max}$
, see e.g. Dritschel, Tran & Scott (Reference Dritschel, Tran and Scott2007)). By incompressibility, this forces filaments to thin exponentially and gradients to grow exponentially. This behaviour cannot be followed indefinitely in numerical simulations at finite resolution, so inevitably dissipation occurs. In CLAM, unlike in GGM and other grid-based numerical methods, the steep gradients can be preserved, without dissipation, due to the contour representation of
 ${\it\omega}$
used in CLAM. This preservation of steep gradients is the key feature which enables CLAM to model flows at very long times albeit at the cost of representing the continuous vorticity field by a discrete set of levels. There is no progressive erosion of vorticity gradients, as in grid-based methods. The vorticity filaments, on the other hand, play a relatively benign role in the dynamics. They contribute negligibly to the flow field and have little chance of rolling up into coherent vortices (Dritschel et al.
Reference Dritschel, Haynes, Juckes and Shepherd1991).
Early–intermediate-time vorticity distribution
 ${\it\omega}(\boldsymbol{r},40)$
, depicted as in figure 2, for (a) GGM at
 $D=655\,362$
, (b) GGM at
 $D=2\,621\,442$
, (c) CLAM at
 $n_{g}=128$
, (d) CLAM at
 $n_{g}=256$
, (e) CLAM at
 $n_{g}=512$
and (f) CLAM at
 $n_{g}=1024$
. The percentage decay in enstrophy
 $Z$
by this time is 56.8 %, 52.2 %, 50.0 %, 44.1 %, 38.3 % and 32.4 %, respectively. In CLAM, the results are plotted on a grid 16 times finer in each direction except in (e) where every other fine grid point is plotted, and in (f) where every 4th grid point is plotted. Same colour scale as in figure 1.

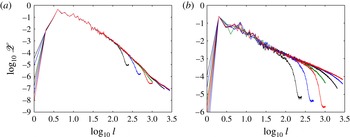
One-dimensional vorticity power spectra
 $\mathscr{Z}(l,t)$
at (a)
 $t=4$
and (b)
 $t=40$
. Colours (online) cycle from black, to blue, to red, to green and back to black, starting from the lowest-resolution GGM simulation (
 $D=163\,842$
) and ending with the highest-resolution CLAM one (
 $n_{g}=1024$
). Three spectra are shown for GGM and four are shown for CLAM. The lowest-resolution CLAM spectrum is shown in green.

Notably, the CLAM simulations exhibit more structure than the GGM ones. The GGM simulations appear to be at lower resolution, and the effects of numerical diffusion are visible. The one-dimensional vorticity power spectra
 $\mathscr{Z}(l,t)$
, shown in figure 4 at time
 $t=4$
and
 $40$
, confirm this impression. The CLAM spectra are undissipated out to the maximum wavenumber computed (which is limited to spherical wavenumber
 $\ell =2800$
in the SHTOOLS software package used). The GGM spectra turn down from hyperdiffusion but also exhibit a rise near the maximum wavenumber (the spectral amplitudes are, however, too weak to play a significant role). From the ordering of the spectra, and of the percentage decay in enstrophy, the highest-resolution GGM simulation appears to correspond, in resolution, to a CLAM simulation with
 $n_{g}=64$
. As the effective resolution in CLAM is roughly 16 times finer, this means that the number of cells
 $D$
in GGM approximately corresponds to the number of grid points used in a conventional numerical method.
In all simulations, there is a significant shallowing of the spectrum in time, as nonlinearity transfers a large fraction of the enstrophy to small scales. The spectral slope over the range
 $l\geqslant 100$
shallows from approximately
 $-2.9$
to
 $-1.9$
between
 $t=4$
and
 $40$
in the highest-resolution CLAM simulations.
Intermediate–late-time vorticity distribution
 ${\it\omega}(\boldsymbol{r},400)$
, depicted as in figures 2 and 3, for (a) GGM at
 $D=655\,362$
, (b) GGM at
 $D=2\,621\,442$
, (c) CLAM at
 $n_{g}=512$
and (d) CLAM at
 $n_{g}=1024$
. Note, only the two highest-resolution CLAM results are shown, but the lower-resolution results are qualitatively similar. By this time, the enstrophy
 $Z$
has decayed to approximately 21 % of its initial value in all cases. No further significant decay occurs to
 $t=4000$
(
 ${<}0.05\,\%$
). Same colour scale as in figure 1.

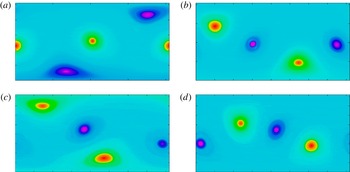
By
 $t=400$
, a further ten times later in the evolution, much of the complex structure evident at
 $t=40$
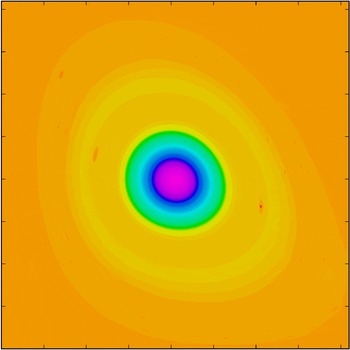
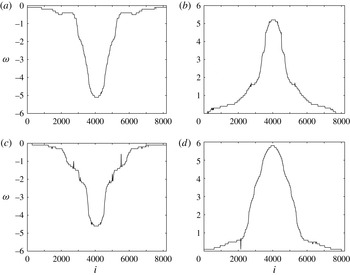
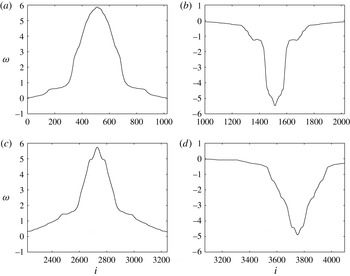
has cascaded beyond the maximum scale resolved in all simulations: see figure 5 for the two highest-resolution GGM and CLAM results. Nonetheless, extensive small-scale structure survives, particularly in the CLAM results. The main four vortices exhibit stepped distributions, ‘vorticity staircases’ (evident also in the GGM results, see below), together with a multitude of small-scale vortices caught between the sharp vorticity gradients. This structure persists, albeit somewhat reduced, all the way to the end of the simulations at
 $t=4000$
(see figure 6). A zoom at
 $t=4000$
, shown in figure 7 for the highest resolution CLAM case, reveals the extent of this fine-scale structure: literally hundreds of small-scale vortices exist between the vorticity steps on this large-scale vortex alone. Notably, virtually all of these small-scale vortices have vorticity anomalies which cause the vortices to rotate with the shear associated with the differential rotation of the main large-scale vortex they are embedded in. This gives rise to stabilising ‘cooperative shear’, enabling them to persist for long times, perhaps indefinitely (Dritschel Reference Dritschel1990).


Zoomed, full-resolution view at
 $t=4000$
of the vortex seen in the lower-left part of figure 6(d). The view is centred at longitude
 $-15{\rm\pi}/16$
and latitude
 $-{\rm\pi}/8$
, and shows a
 ${\rm\pi}/2$
range in longitudes and latitudes (
 $1/8$
th of the domain or
 $8192^{2}$
grid points). Colours (online) range from the minimum to the maximum vorticity in the domain of view. Concentric steps seen in the vorticity are an artifact of the discretization of the vorticity levels in the CLAM algorithm.

The reduction in the size and number of small-scale vortices between
 $t=400$
and
 $t=4000$
is likely to be a numerical artefact, the effect of very weak dissipation accumulated over a very long time. In CLAM, every few eddy turnover times (about 7 or so units of time), contours are rebuilt on an ultra-fine grid to prevent overlapping (Fontane & Dritschel Reference Fontane and Dritschel2009; Dritschel & Fontane Reference Dritschel and Fontane2010). Each time this happens, inevitably small contours tend to shrink slightly on average (and the effect is strongest for the smallest resolved contours). This, we believe, is the primary cause for the reduction of small-scale structure. Notably, each resolution doubling performed here reveals significantly more structure persisting to the end of the simulation, and in the limit of infinite resolution – a perfect model – we expect a multitude of vortices occupying an ever-extending range of scales. Unlike in the case of inviscid two-dimensional turbulence in an unbounded space (Dritschel et al.
Reference Dritschel, Scott, Macaskill, Gottwald and Tran2009), where vortices are free to roam and occasionally collide to form both larger and smaller vortices, here the large-scale flow imposed by the finite domain (the sphere) channels vortices to move along the quasi-steady streamlines of each large-scale vortex, preventing vortex collisions. As a result, vortices may persist indefinitely once the possibility of encountering another vortex in a nearby streamline at close range has been eliminated.
(a–d) Constant-latitude cross-sections of the vorticity field taken through each of the four large-scale vortices (from left to right in figure 6
d) in the highest-resolution CLAM simulation at
 $t=4000$
. The relative longitudinal grid point
 $i$
is indicated on the horizontal axis. The small steps show the vorticity contour level spacing used in the CLAM simulation. The important features are the large steps, seen in many of the vortices. Note also that the cross-sections occasionally pass through a small-scale vortex.

As in figure 8 but for highest-resolution GGM simulation at
 $t=4000$
. Large steps in the vorticity remain evident.

Vorticity cross-sections through the four main vortices in figure 6(d) exhibit stepped vorticity distributions, with alternating steep and shallow gradients (see figure 8). These are also found in the highest-resolution GGM simulation together with some small-scale vortices (though fewer due to the effects of hyperdiffusion, see figure 9). The continuous representation of the vorticity in GGM removes the small steps due to the CLAM contour level spacing evident in figure 8 but reproduces the larger steps. The stepped vorticity distributions seen here appear to be closely analogous to those arising spontaneously in rotating two-dimensional turbulent flows having a mean ‘planetary’ vorticity gradient (see Dritschel & McIntyre Reference Dritschel and McIntyre2008 for a review). There, turbulence cannot entirely break down this gradient but, rather, mixes vorticity inhomogeneously, resulting in a stepped vorticity distribution in the inviscid limit (Scott & Dritschel Reference Scott and Dritschel2012). The associated flow consists of a series of eastward (prograde) jets centred on each step, reminiscent of the jets observed in many planetary atmospheres, most notably Jupiter’s (Marcus Reference Marcus1993). In the simulations conducted here, each large-scale vortex has a vorticity gradient which is reshaped into a stepped distribution early on in the turbulent flow evolution.
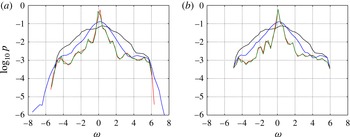
The log-scaled vorticity measure
 $\log _{10}p({\it\omega},t)$
at selected times in (a) the highest-resolution GGM simulation, and (b) the highest-resolution CLAM simulation. The times shown (colours online) are
 $t=0$
(black),
 $t=40$
(blue),
 $t=400$
(red) and
 $t=4000$
(green).

The impact of this turbulent mixing can also be seen in the area fraction occupied by each vorticity level, the so-called ‘vorticity measure’
 $p({\it\omega},t)$
. This is shown at a few selected times in figures 10(a) and 10(b) for the highest-resolution GGM and CLAM simulations, respectively. In a perfectly inviscid fluid,
 $p({\it\omega},t)$
is time-independent and generates the conserved Casimirs in (2.5) through the relations
 $\mathscr{C}_{n}=4{\rm\pi}\int {\it\omega}^{n}p({\it\omega})\,\text{d}{\it\omega}$
,
 $n=2,3,\ldots .$
The lack of conservation seen here is caused by the inevitable cascade of vorticity to small scales: none of the Casimirs can be preserved in simulations at finite resolution (indeed,
 $\mathscr{C}_{2}$
decays by 79 % here). The initial vorticity measure
 $p({\it\omega},0)$
is broadly distributed between
 ${\it\omega}_{min}=-5.1187$
and
 ${\it\omega}_{max}=5.7996$
, then narrows and diminishes nearly everywhere except for values of
 ${\it\omega}$
near
 $0$
. By
 $t=400$
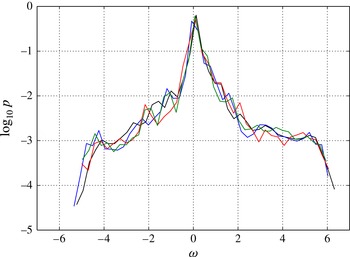
, the vorticity measure has converged to a nearly fixed form, which is noticeably jagged, perhaps related to the non-monotonic vorticity profiles seen in figure 8(a). At late times, despite the inherently unpredictable nature of the flow evolution,
 $p({\it\omega},t)$
remains closely similar between the numerical methods and across resolutions, as shown in figure 11. Hence, the vorticity measure is not sensitive to differences in the vorticity dynamics.
Comparison of
 $\log _{10}p({\it\omega},t)$
at
 $t=4000$
between the two highest-resolution GGM simulations with (colours online)
 $D=655\,362$
(black) and
 $D=2\,621\,442$
(blue), and the two highest-resolution CLAM simulations with
 $n_{g}=512$
(red) and
 $n_{g}=1024$
(green).

In the CLAM results in figure 10(b), notice that
 ${\it\omega}_{min}$
and
 ${\it\omega}_{max}$
are conserved, and that the area occupied by these extreme vorticity values does not change significantly over time. This is sensible physically, as the extreme values are most resilient to deformation. On the other hand, in the GGM results, there is clear evidence of hyperviscous overshoot: the extreme values are not conserved (at times not shown here they are nearly twice their initial values). Slightly greater and unphysical extreme values persist to the end of the simulation, though they have very small measure. In both simulations, the observed strong growth of
 $p({\it\omega},t)$
near
 ${\it\omega}=0$
is due to the efficient mixing of weak vorticity, which essentially behaves as a passive scalar. As
 $|{\it\omega}|$
increases, it becomes increasingly difficult to shear out vorticity structures and mixing becomes less efficient.
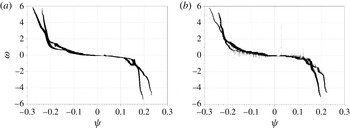
Scatter plots of vorticity
 ${\it\omega}$
versus streamfunction
 ${\it\psi}$
at
 $t=4000$
in (a) the highest-resolution GGM simulation, and (b) the highest-resolution CLAM simulation.

3.2. Unsteadiness
We next address the possible long-term equilibration of the flow, a core prediction of the MRS statistical-mechanical theory. As
 $t\rightarrow \infty$
, that theory predicts a steady flow characterised by a functional relation between vorticity and streamfunction
 ${\it\omega}=F({\it\psi})$
. The precise functional
 $F$
depends on the energy, angular momentum (here zero), circulation (here zero due to the absence of boundary) and the unobservable higher-order fine-grained Casimirs. The resolved ‘coarse-grained’ Casimirs associated with the non-cascading vorticity field are often used to approximately determine the values of the fine-grained Casimirs (see e.g. Qi & Marston Reference Qi and Marston2014 and references therein). The details do not matter for what concerns us here. If the flow is steady, then
 $F$
can be obtained from a scatter-plot of
 ${\it\psi}$
versus
 ${\it\omega}$
, in which
 $F$
would appear as a single curve. Our results are shown for both GGM and CLAM at the highest resolutions and at the final time in figure 12. First of all, there are clearly multiple branches, each corresponding to one of the main vortices. Second, the data do not collapse on a line, but rather in a band, indicating that the flow is not steady (see below for further evidence). Third, in the CLAM results, one sees myriad small-scale vortices, due to the much weaker level of dissipation present. In fact, due to the need to keep the figure size manageable, the CLAM results are downsampled by a factor of 16 in each direction. The true number of small-scale vortices is far greater. Figure 12(b) gives a simplified view. The upshot is that the flow remains unsteady and extremely complex, even despite the inevitable dissipation in CLAM which acts to remove small-scale structure over time (see discussion above).
An alternative way of measuring the unsteadiness of the flow was introduced by Qi & Marston (Reference Qi and Marston2014). They developed a rotation- and amplitude-independent measure of the flow configuration that involves only the streamfunction amplitudes
 ${\it\psi}_{\ell m}$
of the spherical harmonics
 $Y_{\ell }^{m}$
of degree
 $\ell =2$
(these coefficients characterise the main quadrupolar pattern seen at late times). The order
 $m$
satisfies
 $-2\leqslant m\leqslant 2$
. Using the standard convention for spherical harmonics (for which
 $Y_{\ell }^{-m}=(-1)^{m}Y_{\ell }^{m\ast }$
where
 $\ast$
denotes complex conjugation), the configuration is obtained from the amplitudes by:
 $$\begin{eqnarray}W(t)=\frac{-2{\it\psi}_{20}^{3}+6{\it\psi}_{20}({\it\psi}_{2,-1}{\it\psi}_{21}+2{\it\psi}_{2,-2}{\it\psi}_{22})-3\sqrt{6}({\it\psi}_{2,-2}{\it\psi}_{21}^{2}+{\it\psi}_{2,-1}^{2}{\it\psi}_{22})}{({\it\psi}_{2,-2}^{2}+{\it\psi}_{2,-1}^{2}+{\it\psi}_{20}^{2}+{\it\psi}_{21}^{2}+{\it\psi}_{22}^{2})^{3/2}}.\end{eqnarray}$$
 $W$
ranges from
 $-2$
to
 $+2$
; when
 $|W|=2$
, there are just two vortices, while when
 $W=0$
there are four of equal intensity. The sign of
 $W$
indicates the sign of the dominant pair of same-signed vortices.
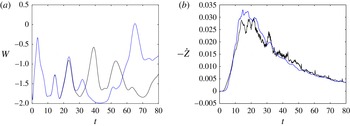
Early-time evolution (
 $0\leqslant t\leqslant 80$
) of (a) the ‘configuration’
 $W(t)$
(defined in the text) and (b) the rate of enstrophy dissipation
 $-\text{d}Z/\text{d}t=-{\dot{Z}}$
, for both the highest-resolution CLAM and GGM simulations. Colours (online) show CLAM in black and GGM in blue.

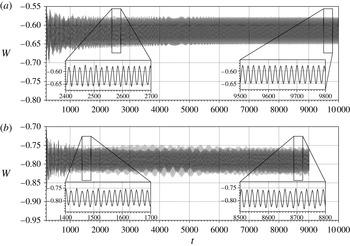
Late-time evolution (
 $t\geqslant 200$
) of the ‘configuration’
 $W(t)$
for both the second-highest-resolution GGM simulation (a) and highest-resolution CLAM simulation (b).

The evolution
 $W(t)$
at early times,
 $0\leqslant t\leqslant 80$
, for both GGM and CLAM at the highest resolutions is compared in figure 13(a). The correspondence is excellent until around
 $t=20$
, a little after the time of peak enstrophy dissipation rate
 $-\text{d}Z/\text{d}t$
(shown in figure 13
b). After this time, the results diverge due to the loss of predictability. However, both methods, at all resolutions, exhibit the same qualitative behaviour in
 $W(t)$
thereafter: quasi-periodic and non-diminishing oscillations, i.e. persistent unsteadiness. This is shown in figure 14 for two very long integrations carried out to around
 $t=10\,000$
; figure 14(a) shows GGM at
 $D=655\,362$
while figure 14(b) shows CLAM at
 $n_{g}=1024$
(both for
 $t\geqslant 200$
). Movies of the flow evolution indicate that the oscillations are caused by the four main vortices moving around each other, with global-scale excursions, and with no sign of relaxing to equilibrium. Note that similar oscillations are also seen in the dipole case of figure 2 of Morita (Reference Morita2011), where they are described as ‘small perturbations’ without detailed discussion.
A simple model of this vortex motion is to consider just four point vortices, singular distributions, in place of the continuous vorticity distribution above. For point vortices, the dynamical system has just three degrees of freedom, after taking into account conservation of energy, angular momentum and the fact that the dynamics depends only on the relative (angular) separation of the vortices (Polvani & Dritschel Reference Polvani and Dritschel1993; Newton Reference Newton2001). The vortex motion is therefore either quasi-periodic or chaotic in general; steady configurations are rare (indeed of zero probability for arbitrary choices of the vortex circulations and positions).
To test the effectiveness of this simple model, the four main vortices from the highest-resolution CLAM simulation at
 $t=4000$
(see figures 6 and 8) were identified by locating contiguous vorticity regions having
 $|{\it\omega}|>0.2$
, a small threshold value enabling one to capture most of the circulation within each vortex. The circulations
 ${\it\Gamma}_{k}$
(
 $k=1,2,3$
and
 $4$
) were found by area integration over each contiguous region of vorticity
 $R_{k}$
, and the centres
 $\boldsymbol{r}_{k}$
from
 $$\begin{eqnarray}\boldsymbol{r}_{k}=\frac{1}{{\it\Gamma}_{k}}\iint _{R_{k}}{\it\omega}\boldsymbol{r}\,\text{d}{\it\Omega}.\end{eqnarray}$$
This procedure, however, does not lead to zero angular impulse
 $\boldsymbol{L}$
, which for point vortices is equal to
 $\sum _{k}{\it\Gamma}_{k}\boldsymbol{r}_{k}$
. Since
 $\boldsymbol{L}=0$
in the original flow, we adjust the circulations
 ${\it\Gamma}_{k}$
by subtracting
 ${\bf\lambda}\boldsymbol{\cdot }\boldsymbol{r}_{k}$
for each
 $k$
, where
 ${\bf\lambda}$
is determined from a
 $3\times 3$
linear system. This adjustment is not biased toward any one vortex and leads to a 10–15 % change in the circulations.
With
 ${\it\Gamma}_{k}$
and
 $\boldsymbol{r}_{k}$
determined in this way, the governing dynamical system
 $$\begin{eqnarray}\frac{\text{d}\boldsymbol{r}_{k}}{\text{d}t}=\frac{1}{4{\rm\pi}}\mathop{\sum }_{j=1,j\neq k}^{4}{\it\Gamma}_{j}\frac{\boldsymbol{r}_{j}\times \boldsymbol{r}_{k}}{1-\boldsymbol{r}_{j}\boldsymbol{\cdot }\boldsymbol{r}_{k}}\quad (k=1,2,3,4)\end{eqnarray}$$
(Polvani & Dritschel Reference Polvani and Dritschel1993) was integrated forwards for
 $4000$
time units, with the results diagnosed as above for the configuration
 $W(t)$
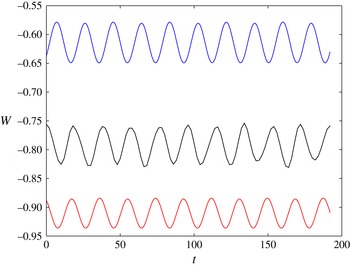
to compare with the CLAM and GGM results. The key finding is that
 $W(t)$
exhibits the same behaviour, in particular with the same dominant frequency of oscillation; the last 10 periods of oscillation in all three simulations is shown in figure 15. (The averages and amplitudes of
 $W(t)$
differ slightly due to the largely unpredictable nature of turbulence and the crude fitting method of the point-vortex system.) Much longer point-vortex simulations carried out to
 $t=10^{6}$
exhibit the same behaviour, with undiminished oscillations.
 $W(t)$
over the final 10 periods of evolution (approximately 192 time units) in the CLAM, GGM and point-vortex simulations. Time is shown relative to
 $t_{max}-192$
in each simulation. Colours (online) show CLAM in black, GGM in blue, and the point-vortex model in red.

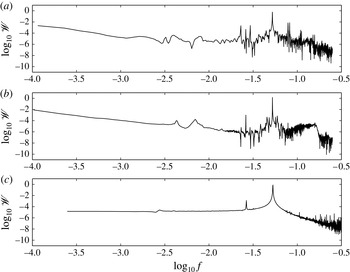
Configuration frequency spectrum
 $\mathscr{W}(\,f)$
for the second-highest-resolution GGM simulation (a), the highest-resolution CLAM simulation (b), and the point vortices (c). In GGM,
 $\mathscr{W}(\,f)$
was computed from the time series of
 $W$
for
 $t\in [400,10\,000]$
; in CLAM we used
 $[400,9022]$
, while in the point-vortex model we used
 $[0,4000]$
.

The correspondence between the three simulations is even more remarkable if one examines the frequency power spectrum of
 $W$
, namely
 $\mathscr{W}(\,f)=|{\hat{W}}|^{2}$
, where
 ${\hat{W}}$
is the Fourier transform of
 $W$
and
 $f$
is the frequency (here equal to the inverse period). The frequency spectra (
 $\log _{10}$
scaled) for the three simulations are shown in figure 16, vertically aligned, with GGM in figure 16(a), CLAM in figure 16(b), and the point vortices in figure 16(c). Most strikingly, the dominant frequency
 $f=1/T$
with
 $T\approx 19.14$
is matched in all three simulations. The power at this frequency is orders of magnitude above surrounding frequencies, indicating that the dynamics are very nearly periodic. Other less prominent peaks also line up, corresponding to longer-period oscillations. Overall, the agreement is remarkable, given the enormous simplifications made to reduce the dynamics to that of four point vortices. Most importantly, the point-vortex model strongly supports our claim that the dynamics never comes to equilibrium.
4. Conclusions
In this paper, we have studied the long-time asymptotic behaviour of a bounded two-dimensional inviscid flow. Statistical-mechanical theories stemming from Miller (Reference Miller1990), Robert (Reference Robert1991), Robert & Sommeria (Reference Robert and Sommeria1991) and Miller et al. (Reference Miller, Weichman and Cross1992) argue that this behaviour reaches a steady equilibrium state, characterised by a functional relation between vorticity and streamfunction. We have tested these theories by carrying out very long-time simulations of two-dimensional turbulence on a sphere, for zero angular momentum, employing highly distinct numerical methods. The key finding, which is robust across both methods at all resolutions, is that the flow remains persistently unsteady with no indication of equilibration in a steady flow.
Of course, we cannot carry out simulations indefinitely, and one can always argue that equilibration will happen eventually. However, we have shown there is a plausible alternative. At long times, the vorticity field is primarily concentrated in four large vortices. They are generally unequal in circulation, and not regularly spaced. If one replaces each vortex by a point vortex of the same circulation, we have shown that the point vortices typically exhibit unsteady quasi-periodic motion: persistent unsteadiness. Fundamentally, we argue, the observed unsteadiness in the Euler equations for continuous vorticity is intimately associated with the unsteadiness of four point vortices moving on the surface of a sphere.
We have also found that small-scale vortices pepper the flow field at high resolution. These vortices commonly have vorticity anomalies which cause them to rotate in the same sense as the shear induced by differential rotation of the main vortex they circulate about. The small-scale vortices therefore experience a stabilising cooperative shear (Dritschel Reference Dritschel1990). As a result, even these small-scale vortices may persist indefinitely. Moreover, as the resolution increases, more structure at small scales appears. Our main conclusion is that bounded inviscid flows on a sphere, with zero angular momentum, typically do not settle down to an equilibrium; instead, a few robust compact vortices emerge from the early flow evolution and interact chaotically or quasi-periodically.
In the much studied case of doubly-periodic geometry, by contrast, often two opposite-signed vortices emerge. In this case, the corresponding point-vortex system is integrable, and the only possible motion is simple steady translation. This difference from spherical geometry greatly facilitates the emergence of a steady flow (in a translating frame of reference), though one still cannot rule out the persistence of small-scale vortices circulating around the main large-scale vortices. Inviscid flows in a doubly-periodic domain are likely to be less unsteady than flows on a sphere, though unsteadiness may persist forever.
Acknowledgements
We are grateful for helpful discussions with F. Bouchet, J. Cho, B. Turkington, A. Venaille, and P. Weichman. We thank the Kavli Institute for Theoretical Physics for supporting our participation in the 2014 Program ‘Wave-Flow Interaction in Geophysics, Climate, Astrophysics, and Plasmas’ where this work was initiated. The KITP is supported in part by the NSF grant no. NSF PHY11-25915. This work was also supported in part by the NSF under grant nos. DMR-1306806 and CCF-1048701 (J.B.M. and W.Q.).
Appendix A. Initial condition
The initial streamfunction at time
 $t=0$
is a superposition of spherical harmonics with spherical wavenumber in the range
 $4\leqslant \ell \leqslant 10$
,
 $$\begin{eqnarray}\displaystyle {\it\psi}({\it\theta},{\it\phi})=\mathop{\sum }_{\ell =4}^{10}\mathop{\sum }_{m=-\ell }^{\ell }{\it\psi}_{\ell m}Y_{\ell }^{m}({\it\theta},{\it\phi}), & & \displaystyle\end{eqnarray}$$
with
 ${\it\psi}_{\ell -m}=(-1)^{m}{\it\psi}_{\ell m}^{\ast }$
and the following choice of amplitudes
 ${\it\psi}_{\ell m}$
:
 $$\begin{eqnarray}\displaystyle \left.\begin{array}{@{}c@{}}{\it\psi}_{40}=-0.0114727\\ {\it\psi}_{41}=0.0255012+0.0337679\text{i}\\ {\it\psi}_{42}=-0.0366116-0.0312419\text{i}\\ {\it\psi}_{43}=0.000614585+0.000602384\text{i}\\ {\it\psi}_{44}=0.0160784-0.0194655\text{i}\end{array}\!\!\right\} & & \displaystyle\end{eqnarray}$$
 $$\begin{eqnarray}\displaystyle \left.\begin{array}{@{}c@{}}{\it\psi}_{50}=0.00357198\\ {\it\psi}_{51}=-0.000446705-0.0100286\text{i}\\ {\it\psi}_{52}=0.0100984+0.00778139\text{i}\\ {\it\psi}_{53}=-0.0142904-0.00864324\text{i}\\ {\it\psi}_{54}=0.0156104-0.0111872\text{i}\\ {\it\psi}_{55}=-0.00275238-0.0106832\text{i}\end{array}\!\!\right\} & & \displaystyle\end{eqnarray}$$
 $$\begin{eqnarray}\displaystyle \left.\begin{array}{@{}c@{}}{\it\psi}_{60}=-0.00352493\\ {\it\psi}_{61}=-0.00739953+0.00218422\text{i}\\ {\it\psi}_{62}=0.0140976+0.00864871\text{i}\\ {\it\psi}_{63}=-0.0141289-0.00654953\text{i}\\ {\it\psi}_{64}=0.0200989-0.0152088\text{i}\\ {\it\psi}_{65}=0.00682398+0.0132045\text{i}\\ {\it\psi}_{66}=0.00919374+0.00889445\text{i}\end{array}\!\!\right\} & & \displaystyle\end{eqnarray}$$
 $$\begin{eqnarray}\displaystyle \left.\begin{array}{@{}c@{}}{\it\psi}_{70}=0.00269739\\ {\it\psi}_{71}=-0.00607359-0.00179029\text{i}\\ {\it\psi}_{72}=0.00299202-0.0115332\text{i}\\ {\it\psi}_{73}=-0.00418447-0.000665072\text{i}\\ {\it\psi}_{74}=0.00853673-0.0011805\text{i}\\ {\it\psi}_{75}=-0.00229449-0.00731682\text{i}\\ {\it\psi}_{76}=0.00315312-0.00332254\text{i}\\ {\it\psi}_{77}=0.0127047+0.000153664\text{i}\end{array}\!\!\right\} & & \displaystyle\end{eqnarray}$$
 $$\begin{eqnarray}\displaystyle \left.\begin{array}{@{}c@{}}{\it\psi}_{80}=-0.0070908\\ {\it\psi}_{81}=-0.00820113-0.00180399\text{i}\\ {\it\psi}_{82}=0.00726466-0.00109238\text{i}\\ {\it\psi}_{83}=0.00327615+0.00732665\text{i}\\ {\it\psi}_{84}=-0.00418371+0.00764604\text{i}\\ {\it\psi}_{85}=-0.00506492+0.00152613\text{i}\\ {\it\psi}_{86}=0.00289222-0.0126644\text{i}\\ {\it\psi}_{87}=-0.00113653-0.00983086\text{i}\\ {\it\psi}_{88}=0.00390903+0.00337946\text{i}\end{array}\!\!\right\} & & \displaystyle\end{eqnarray}$$
 $$\begin{eqnarray}\displaystyle \left.\begin{array}{@{}c@{}}{\it\psi}_{90}=0.00366743\\ {\it\psi}_{91}=-0.00670701-0.0052387\text{i}\\ {\it\psi}_{92}=-0.00102863-0.00831521\text{i}\\ {\it\psi}_{93}=-0.00429645+0.00881862\text{i}\\ {\it\psi}_{94}=0.00487287-0.00708109\text{i}\\ {\it\psi}_{95}=-0.00183309-0.00476393\text{i}\\ {\it\psi}_{96}=0.0124893-0.00170479\text{i}\\ {\it\psi}_{97}=0.00438044+0.00091529\text{i}\\ {\it\psi}_{98}=-0.00309726-0.000427295\text{i}\\ {\it\psi}_{99}=-0.0053439+0.00203709\text{i}\end{array}\!\!\right\} & & \displaystyle\end{eqnarray}$$
 $$\begin{eqnarray}\displaystyle \left.\begin{array}{@{}c@{}}{\it\psi}_{100}=-0.00507863\\ {\it\psi}_{101}=-0.00247735+0.00024564\text{i}\\ {\it\psi}_{102}=-0.00357194-0.00141963\text{i}\\ {\it\psi}_{103}=-0.00077508+0.00719427\text{i}\\ {\it\psi}_{104}=-0.00462811-0.00550109\text{i}\\ {\it\psi}_{105}=-0.00101044-0.00773111\text{i}\\ {\it\psi}_{106}=0.00395564+0.0027653\text{i}\\ {\it\psi}_{107}=0.00121852+0.00310834\text{i}\\ {\it\psi}_{108}=0.00314655+0.000289766\text{i}\\ {\it\psi}_{109}=-0.00279021-0.00314691\text{i}\\ {\it\psi}_{1010}=0.00258861-0.000254598\text{i}.\end{array}\!\!\right\} & & \displaystyle\end{eqnarray}$$