

Women are strongly underrepresented in politics and, more specifically, in parliaments (Thames and Williams Reference Thames and Williams2013). While this fact is clearly illustrated by descriptive statistics, it is more challenging to analyze the factors that cause this phenomenon. One aspect that is frequently discussed as a potential source of gender discrimination is the electoral system (see, e.g., Fortin-Rittberger and Eder Reference Fortin-Rittberger and Eder2013; Fortin-Rittberger and Rittberger Reference Fortin-Rittberger and Rittberger2014; Roberts, Seawright, and Cyr Reference Roberts, Seawright and Cyr2013; Schwindt-Bayer, Malecki, and Crisp Reference Schwindt-Bayer, Malecki and Crisp2010; Thames and Williams Reference Thames and Williams2010; Valdini Reference Valdini2012; Vengroff, Nyiria, and Fugiero Reference Vengroff, Nyiria and Fugiero2003). In particular, it has been shown how electoral systems that allow voters to cast preferential votes for individual candidates, such as open-list proportional representation (PR) systems, impact women's political representation (e.g., Allik Reference Allik2015; Golder et al. Reference Golder, Stephenson, Van der Straeten, Blais, Bol, Harfst and Laslier2017; Górecki and Kukołowicz Reference Górecki and Kukołowicz2014; Holli and Wass Reference Holli and Wass2010; Jankowski and Marcinkiewicz Reference Jankowski and Marcinkiewicz2016; Kukołowicz Reference Kukołowicz2013; Matland Reference Matland1994; McElroy and Marsh Reference McElroy and Marsh2010).
Despite a viable and large corpus of literature about gender effects in open-list PR systems, findings regarding women's political representation remain ambiguous. While some scholars have found evidence of a potential gender bias against women in voters’ decision-making process and candidates’ electoral success (e.g., Górecki and Kukołowicz Reference Górecki and Kukołowicz2014; Kukołowicz Reference Kukołowicz2013; Millard Reference Millard2014; Sanbonmatsu Reference Sanbonmatsu2002), others have not observed such effects and argue that women are not disadvantaged at the ballot box (e.g., Jankowski and Marcinkiewicz Reference Jankowski and Marcinkiewicz2016; McElroy and Marsh Reference McElroy and Marsh2010). Some even argue that open-list systems have a positive effect on women's election chances, at least in specific contexts (e.g., Golder et al. Reference Golder, Stephenson, Van der Straeten, Blais, Bol, Harfst and Laslier2017; Kostadinova and Mikulska Reference Kostadinova and Mikulska2015; Kunovich Reference Kunovich2012; Stegmaier, Tosun, and Vlachova Reference Stegmaier, Tosun and Vlachova2014). Millard, Popescu, and Tóka (Reference Millard, Popescu and Tóka2013, 16), for example, conclude that open-list PR systems “usually help rather than hurt women candidates.”
While most studies focus on the demand side of politics—that is, voter preferences for candidates—others have also begun to analyze the influence of candidate selection and nomination on women's political representation (e.g., Kunovich Reference Kunovich2003; Luhiste Reference Luhiste2015; Milyo and Schosberg Reference Milyo and Schosberg2000). The idea behind this research is that even when voters are unbiased in their decision making, women might still be (dis)advantaged in an election because of their placement on the party list. Parties may set positive incentives to promote the election of women “by granting women (more and) better positions on the ballot list, including the top position” (Marien, Schouteden, and Wauters Reference Marien, Schouteden and Wauters2016, 331). The importance of list placement is recognized by research on the impact of gender quotas, which require parties to nominate a certain proportion of candidates of both genders to their lists (e.g., Baldez Reference Baldez2004; Fréchette, Maniquet, and Morelli Reference Fréchette, Maniquet and Morelli2008; Jones Reference Jones1998).
Several democracies have adopted such gender quotas in recent years (Krook, Lovenduski, and Squires Reference Krook, Lovenduski and Squires2009; Quota Project 2016), but it is important to mention that gender quotas come in different flavors. In the simplest form, gender quotas only require parties to nominate a certain proportion of candidates from both genders to the party list. More sophisticated quotas, in contrast, also have a placement mandate, accounting for the fact that the probability of being elected to parliament often depends heavily on the list position. Belgian legislation, for example, requires that one of the two top positions on the party list be reserved for a female candidate (Marien, Schouteden, and Wauters Reference Marien, Schouteden and Wauters2016, 10).
While quotas are usually implemented for the purpose of increasing women's political representation, their effectiveness is subject to intensive scholary debate. In particular, gender quotas without a specific placement mandate have often been described as ineffective in improving female list placement or increasing the number of female legislators (e.g., Millard Reference Millard2014). Luhiste (Reference Luhiste2015, 96), for example, summarizes that quotas without a placement mandate “appear to be the least efficient measure to increase women's descriptive representation.” While this strand of research suggests that quotas without a placement mandate are ineffective, others go even further and argue that they might harm instead of foster women's numerical political representation. As claimed by Górecki and Kukołowicz (Reference Górecki and Kukołowicz2014), gender quotas may increase the overall number of women on the party lists, but they simultaneously lower women's chances of being elected because voters can now choose among more women. Górecki and Kukołowicz (Reference Górecki and Kukołowicz2014, 76) conclude that “the introduction of quotas and a sudden substantial increase in the numbers of female candidates might lower drastically an ‘average’ female candidate's electoral performance.”
Summarizing this previous literature, we can state that existing research has found ambiguous and sometimes contradictory results regarding gender effects in open-list elections. In general, the effect of gender on personal vote-earning is not clear.Footnote 1 Moreover, the effects of gender quotas on women's election chances in open-list systems are unclear as well, but they are often described as ineffective or even paradoxical when no placement mandate is used.
This article contributes to this ongoing debate on the impact of gender quotas on women's political representation in open-list PR electoral systems. Specifically, we analyze the consequences of the introduction of a mandatory gender quota without a placement mandate for the Polish national elections in 2011. The quota in Poland requires that each gender is represented by at least 35% of all candidates on a party list. The quota has no placmeent mandate, meaning that parties have more leeway in how they respond to the quota requirements in their candidate nomination patterns. We examine how this quota influences women's list placement as well as their electoral success. By using detailed information on more than 17,000 candidates who ran for the Polish parliament between 2001 and 2015, we are able to analyze candidate nomination and vote casting patterns in great detail and offer a comparison between the pre- and post-quota period while keeping the overall context as stable as possible. Focusing on Poland is advantageous, as several other studies on gender quotas analyze the case of Poland, and our study thus allows for direct comparability between these cases. In addition, we discuss methodological shortcomings in existing research on candidate nomination patterns and highlight how they affect the observed results and conclusions about gender quotas.
Our main finding is that the gender quota in Poland has a positive effect on candidate nomination and the number of elected female candidates, despite the claim about gender quotas without placement mandate being ineffective or even paradoxical. More specifically, we show (1) that the gender quota increased the proportion of female candidates at favorable ballot positions and (2) that the impact of gender on the number of preferential votes cast for a candidate is rather limited. In addition, we provide a simulation analysis that demonstrates that the descriptive increase in female legislators can be directly related to the more favorable candidate nomination patterns.
The article is structured as follows: in the following section, we describe our theoretical approach. We proceed by discussing the data and methods that we apply. We then turn to the empirical analysis, which is divided into two sections, reflecting our desire to perceive separately the supply- and demand-side effects of the gender quota. First, we present the results referring to the party nomination process. In the second step, we examine the effect of gender quotas on women's electoral success. The article concludes with a discussion of the results and an outline of possible future extensions.
GENDER QUOTAS AND OPEN-LIST PR SYSTEMS
Institutional Background: The Gender Quota and Open-List PR System in Poland
Before turning to the theoretical debate on the impact of gender quotas in open-list PR systems, this section provides a brief overview of the case we focus on in our empirical analysis: the gender quota under the open-list PR system in Poland.
Poland uses a very simple open-list PR system for its elections to the lower house of the national parliament (the Sejm). Parties compete in 41 electoral districts over a total of 460 seats. Each voter has only one vote that can be cast for a candidate. In contrast to a flexible-list system applied, for example, in Belgium or the Czech Republic, there is no option to vote for the overall party list. The seat share of parties is determined based on their share of all preferential votes. The number of preferential votes received by each candidate determines which candidates are elected. The aforementioned characteristics of the Polish electoral system have remained unchanged since 2001.
In 2011, a bill was passed that introuced a mandatory gender quota. This quota requires that all party lists consist of at least 35% candidates from one gender. Almost all party lists violated this quota in the election of 2007 (the last Sejm election before the introduction of the quota). Since there is a strong enforcement mechnism (lists violating the quota requirements cannot be registered and hence cannot appear on the ballot), almost all parties had to change their nomination patterns in 2011. The quota does not contain a placement mandate, meaning that parties are entirely free to choose to which rank positions on a party list candidates are nominated.
The quota reflects a compromise among political actors that had diverging preferences about the specific quota requirements. Legislators from the right-wing Law and Justice (PiS) party strongly opposed all forms of gender quotas (see Gwiazda Reference Gwiazda2015; Jankowski and Marcinkiewicz Reference Jankowski and Marcinkiewicz2016). Since PiS was part of the opposition, the diverging preferences within the ruling coalition consisting of the liberal Civic Platform (PO) and the socially conservative Polish People's Party (PSL) were more important for the quota implementation. Important as well was the position of the left-of-the-center opposition represented in the Sejm by the Democratic Left Alliance (SLD). Parts of the SLD and PO rallied for a stricter version of the gender quota. The Congress of Polish Women, an influential nongovernmental actor in Poland, also lobbied for a “zipper system” that would have required women and men to be placed in alternating order on the ballot (Gwiazda Reference Gwiazda2015, 688). Finally, the coalition agreed on the implementation of the quota as described here and passed it in the Sejm with support of the SLD. Legislators of the PiS voted against the bill and vocally opposed it in the debate (Gwiazda Reference Gwiazda2015, 689). As a response to this compromise, the PO has implemented internal regulations that go beyond the legal quota requirements. It requires that in every district, one of the three top ballot positions be reserved for a female candidate (Gwiazda Reference Gwiazda2016, 50).
The Impact on Candidate Nomination
While the vast majority of analyses regarding gender effects are concerned with whether women receive fewer votes at the ballot box in comparison with men, more studies have recently started to include candidate nomination patterns in their analyses (Górecki and Kukołowicz Reference Górecki and Kukołowicz2014; Jankowski and Marcinkiewicz Reference Jankowski and Marcinkiewicz2016; Kostadinova and Mikulska Reference Kostadinova and Mikulska2015; Luhiste, Reference Luhiste2015; Stegmaier, Tosun, and Vlachova Reference Stegmaier, Tosun and Vlachova2014). They do so for good reason. Under a closed-list PR system, the importance of analyzing candidate placement is obvious, as candidate placement in combination with the overall success of a party determines whether a candidate is elected or not. In open-list PR systems, in contrast, every candidate has, at least theoretically, the chance of being elected to parliament because the candidates with the highest number of preferential votes on the party list are elected to parliament. This has led to the assumption that “placement mandates make little sense in open list or in flexible formats in which seats are primarily allocated by preferential votes” (Schmidt 2009, 192). Such a perspective ignores, however, that under open-list PR systems, all candidates only theoretically have the same chance of being elected to parliament. Under open-list PR systems, certain aspects of the nomination process may influence candidates chances of being elected. Particularly important are the decisions of the party elite, including the allocation of resources to candidates (Wylie and dos Santos Reference Wylie and Santos2016) and their list placement (Wauters, Weekers, and Maddens Reference Wauters, Weekers and Maddens2010).
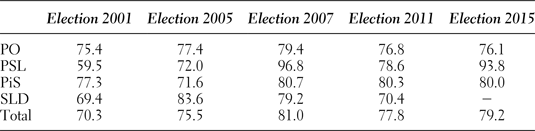
In systems in which voters are confronted with long lists of candidates arranged in a certain order by party leaders, list placement has a tremendous impact on candidate nomination because of the existence of ballot position effects (Faas and Schoen Reference Faas and Schoen2006). That is, candidates at top ballot positions are much more likely to receive preferential votes than candidates at lower ballot positions simply because of their position on the ballot paper (e.g., Marcinkiewicz 2014). Several factors explain this finding: top-placed candidates are more prominent, have more political experience, and receive more media attention (Van Erkel and Thijssen Reference Van Erkel and Thijssen2016). Moreover, Blom-Hansen et al. (Reference Blom-Hansen, Elklit, Serritzlew and Villadsen2016) demonstrate that there is a causal effect simply because of the high attention voters pay to candidates at the top ballot positions. Therefore, while it is true that personal vote-earning strategies matter for the electoral success of candidates, the position effects observed in open-list PR systems are so strong that parties still have a huge influence on the composition of the parliament. Bluntly put, parties’ nomination patterns already determine a large part of the election outcome (Milyo and Schosberg Reference Milyo and Schosberg2000), and thus “parties remain the most important gate-keepers, even in candidate-centered electoral systems such as open-list PR” (Jankowski and Marcinkiewicz Reference Jankowski and Marcinkiewicz2016, 10). To illustrate this point, Table 1 displays the percentage of legislators in Polish Sejm elections that would have been elected under a closed-list system—that is, they were nominated to a ballot position that is smaller or equals the party magnitude. As can be seen, usually more than 70% of all candidates who would have been elected under a closed-list system were also elected under the open-list PR system.Footnote 2
Percentage of candidates that would have been elected under a closed-list system in Poland

Note: In 2015, the SLD was part of the electoral coalition that missed the electoral threshold of 8% and did not elect any candidates to the Sejm.
Gender imbalance in candidate nomination patterns can thus have severe consequences for gender representation, even when voters are not biased in their decision making by a candidate's gender. In this regard, Kelley and McAllister (Reference Kelley and McAllister1984, 455) summarize findings on the relationship between gender, party nomination patterns, and vote choice in Australia as follows: “the major parties are less likely to nominate women but … , once nominated, women candidates fare neither better nor worse than men.” In a similar vein, Wauters, Weekers, and Maddens (Reference Wauters, Weekers and Maddens2010, 483) argue for the case of Belgium that “women do not obtain a lower number of preferential votes because they are women (no voter bias), but because they are less likely to occupy crucial positions on the list.”
Given the importance of ballot positions and nomination patterns, scholars usually differentiate between favorable and unfavorable ballot positions based on the number of “winnable” seats for a certain party and the ballot position of a candidate. Drawing on the importance of favorable and unfavorable ballot positions, we can speak of a gender bias in candidate nomination patterns when women are more likely to be placed at unfavorable ballot positions than favorable ballot positions (see, e.g., Dahlerup Reference Dahlerup2007, 84–85). This definition of a gender bias in candidate nomination takes into account that women are also usually less likely to be (active) party members and thus less likely to be nominated. We cannot take into account, however, whether women are disadvantaged at the recruitment stage of the candidate nomination process. That is, we cannot analyze whether the proportion of women in the “recruitment pool” of all potential candidates is equal to the proportion of women among the nominated candidates (Matland Reference Matland2004). Such an analysis would require detailed knowledge of all potential candidates and party nomination practices, which is not available for our case.
In the absence of a gender quota, such a disadvantage in candidate placement might already exist (Folke and Rickne Reference Folke and Rickne2016). For example, incumbents are more likely to be men and also very likely to be nominated to a top position on the ballot paper. With regard to gender quotas, research suggests that this disadvantage in candidate placement becomes more severe when a quota without a placement mandate is employed (see, e.g., Krook Reference Krook2009, 110, 180, 202). This means that women are more likely to be nominated to marginal positions when there is no placement mandate. In this regard, Besley et al. (Reference Besley, Folke, Persson and Rickne2017, 2222) summarize that with such quotas, “one often find the required share of women towards the bottom of the list [ … and] more effective quotas include placement mandates that require women to be placed in certain electable position on the ballot.” Similar results are reported by Luhiste (Reference Luhiste2015, 96), Jones (Reference Jones2009, 58), and Krook and Norris (Reference Krook and Norris2014, 7), among others.
It is important to note that such nomination patterns do not necessarily imply that parties are discriminating against women by placing them at lower ballot positions more frequently. In general, all candidates who are nominated for the first time to the party list probably lack political experience compared with other candidates. It is only natural that less experienced candidates would be placed at rather unfavorable ballot positions when they are nominated for the first time. Moreover, most of the rather favorable ballot positions are probably resevered for prominent party members and incumbents who pursue reelection. Finally, at least for some parties, it might also be that they lack a sufficient number of female candidates who are interested in pusuing a political career. In this case, some female candidates might be nominated in order to fulfill the legal quota requirements, but these candidates are not really interested in being elected to parliament. Therefore, they are probably fine with being nominated to unfavorable positions. Hence, we expect that the gender quota results primarily in an increase in female candidates in positions close to the bottom of the party lists.
In contrast to existing research, however, it is important to highlight that the arguments outlined here only suggest that the increase in the number of women on the ballot paper due to a gender quota will be (1) stronger at less favorable ballot positions and thus (2) less effective compared with a different quota system that also dictates where certain candidates have to be placed. Nonetheless, both conclusions do not dismiss the possibility that the gender quota can also be effective in increasing the proportion of women at favorable ballot positions. Put differently, the fact that a large increase in the number of female candidates can be witnessed toward the end of the ballot paper does not imply that there is no such increase in the proportion of women at promising ballot positions compared with previous elections. Admittedly, the reasons for such an increase might be more subtle, particularly when the quota is applied for the first time. However, it is not unreasonable to expect positive effects of the gender quota on female candidate nomination to favorable ballot positions. One of the most important reasons is compliance: the implementation of quotas is not a random treatment assigned to some party lists or some countries. Instead, it is usually the outcome of a political process specifically aimed at increasing the numeric representation of women (Dubrow Reference Dubrow2011). The introduction of gender quotas thus usually reflects a normative concept to which at least some parties are committed. Therefore, it would be inconsistent for parties (at least for those in favor of gender quotas) not to pursue their goal of more balanced gender representation by solely placing women at the end of the ballot paper.
In sum, we can conclude that while gender quotas are more likely to increase the share of women at rather unfavorable ballot positions, this does not imply that there will be no increase in the number of women at favorable ballot positions. Moreover, the increase in the number of women occupying favorable ballot positions should be stronger for parties that are in favor of the gender quota. This will be a result of both conscious decisions taken by the party elite during the recruitment process and the attitudes of members of parties supporting gender quotas. As observed by Verge (Reference Verge2015, 758), “parties’ gender regime molds candidate recruitment … demand makes its own supply of aspirants among party members.” These expectations constitute our hypotheses for the list placement analysis:
H 1:
After the introduction of the gender quota, women have a higher probability of being nominated to both favorable and unfavorable ballot positions, but the increase will be stronger for unfavorable ballot positions.
H 2:
The increase in the proportion of women placed at favorable ballot positions will be stronger for parties that actively supported the introduction of the gender quota.
The Impact on Preferential Votes
Having discussed the potential influence of parties’ candidate nomination patterns, we now turn to the political demand side of candidate selection, that is, the number of preferential votes cast for each candidate. As described earlier, preferential voting is mandatory in the Polish open-list PR system—that is, each voter has to vote for a candidate, and there is no direct way of confirming the list order by voting for the party list (Marcinkiewicz and Stegmaier Reference Marcinkiewicz and Stegmaier2015). However, many scholars have argued that voters might substitute the missing “party vote” option simply by voting for one of the first candidates on the party list, hence largely confirming the name order provided by the party (Faas and Schoen Reference Faas and Schoen2006, 94). However, voters in open-list PR system are free to choose among all candidates on the list, and thus they might also cast a preferential vote based on factors other than the ballot position of a candidate (see, e.g., Jankowski Reference Jankowski2016). Obviously, in the context of this article, the focus is on the gender of a candidate.
As discussed in the introduction, research has found only mixed evidence for gender effects with respect to voters’ behavior. Some have found evidence for a bias against women, while others have argued that women are not particularly disadvantaged at the ballot box. Other authors observe even positive bias in favor of female candidates, especially when they occupy a psychologically prominent position close to the top of the list (Spierings and Jacobs Reference Spierings and Jacobs2014, 217). In addition, Golder et al. (2017, 119) provide experimental evidence that “among a sophisticated subset of the population,” voters are more likely to vote for women in open-list systems. Finally, Schwindt-Bayer, Malecki, and Crisp (Reference Schwindt-Bayer, Malecki and Crisp2010) argue convincingly that the propensity of voters to support female candidates in open-list elections may depend on the overall political context and political culture, which makes it hard to draw generalizable conclusions about electoral support for female candidates. In their analysis, Schwindt-Bayer, Malecki, and Crisp (Reference Schwindt-Bayer, Malecki and Crisp2010) find positive, negative, or no gender effects in different countries using the single transferable vote system.
As we are primarily concerned with how gender quotas affect the electoral success of women, we will not discuss the rich corpus of literature regarding gender effects in open-list systems in more detail and instead focus on the impact of the gender quota. While there is a lot of research on how gender plays a role in candidate evaluation, there is less research on the question of how a gender quota might impact voter behavior in the context of open-list systems.
One study that explicitly addresses this topic is the contribution of Górecki and Kukołowicz (Reference Górecki and Kukołowicz2014), who argue that gender quotas have a “paradoxical” effect on women's political representation. The quota increases the number of women on the party list, but this increase might lower the average number of votes cast for female candidates. This argument relies on the assumption that a certain proportion of the electorate cast votes specifically for female candidates in order to increase their electoral chances. Schmidt (Reference Schmidt2009, 194) argues quite similarly that “under open lists high quotas … may excessively fragment votes for female candidates.”
At first glance, this assumption is not unjustified. For example, scholars have found evidence of “same-gender voting” in Finland (Giger et al. Reference Giger, Holli, Lefkofridi and Wass2014; Holli and Wass Reference Holli and Wass2010), Belgium (Marien, Schouteden, and Wauters Reference Marien, Schouteden and Wauters2016), and the United States (Sanbonmatsu 2002), meaning that voters are more likely to support candidates of the same gender (the effect is usually stronger for men than women). If we assume the proportion of voters who prefer to support candidates of their own gender to be fixed, then an increase in the number of female candidates simply implies that these votes are now distributed among more candidates.
There are, however, good reasons to question this assumption. First, as demonstrated by Giger et al. (Reference Giger, Holli, Lefkofridi and Wass2014), the proportion of voters who engage in same-gender voting depends on the supply side. With more female candidates on the list, same-gender voting for women increases, while it drops for male candidates. Therefore, the assumption of a fixed proportion of votes for women does not hold. Second, the assumption implicitly suggests that each candidate is equally likely to receive preferential votes. As demonstrated by previous research and summarized earlier, this is not the case. A vast majority of votes are not cast because of the gender of the candidate but because of other factors, such as a candidate's previous political experience or position on the list. The argument then applies solely to those voters who only consider voting for candidates of a certain gender and do not take other factors of the candidates into account when selecting a candidate. While some of these voters may exist, they will probably only constitute a small portion of the electorate.
Although we have have highlighted serious concerns about the mechanism that might lead to a paradoxical effect of the gender quota, we use the argument from Górecki and Kukołowicz (Reference Górecki and Kukołowicz2014) to formulate our third hypothesis:
H3:
After the introduction of the gender quota, an average female candidate receives fewer preferential votes than an average male candidate, all else being equal.
Evaluating the Impact of Gender Quotas
In line with our theoretical expectations, we believe the gender quota will have moderately positive effects on female candidate placement and negative (or no) effects on the number of preferential votes received by women. By distinguishing between candidate nomination and voter preferences, we account for the two different mechanisms that might impact women's numerical representation in parliament. However, as we face two different mechanisms that might prevent women's political representation, it becomes challenging to analyze how the gender quota influences the main outcome of interest: the success of the gender quota in increasing the number of female legislators. From our discussion of the two different mechanisms, candidate nomination and preferential voting, we clearly argue for a positive effect of the quota on female candidate nomination. This expected improvement in list placement should result in a higher number of preferential votes and thus increase a woman's chances of being elected to parliament. Simultaneously, however, preferential voting is often assumed to hurt women's electoral success. Hence, this mechanism potentially decreases a woman's probability of election.
In terms of effect sizes, however, research suggests that candidate placement has a tremendous effect on the number of votes a candidate receives (Wauters, Weekers, and Maddens Reference Wauters, Weekers and Maddens2010). While some studies find that female candidates are indeed disadvantaged at the ballot box, this finding is more contested. It has already been noted that negative gender effects cannot be witnessed in every context (Spierings and Jacobs Reference Spierings and Jacobs2014, 217). Conjoint experiments on candidate evaluation often do not display significant or substantive effect sizes, which could imply a severe bias against female candidates (e.g., Carnes and Lupu Reference Carnes and Lupu2016). Therefore, when weighing the different mechanisms that might impact women's political representation, we come to the conclusion that improvement in the placement of candidates should have a stronger effect on electoral success. Assuming that our hypotheses can be positively verified, we formulate our last hypothesis as follows:
H 4:
The gender quota increases the number of female candidates elected to parliament.
DATA AND METHODS
In the following sections, we will first describe the data used to analyze our research questions. Then we will discuss the specific research design we employ and highlight some problematic modeling choices in existing research, particularly with regard to the analysis of candidate nomination patterns.
Data
The data we use come from two sources. First, we use the East European Parliamentarian and Candidate data set (EAST PaC 2015), which contains detailed information on all candidates running for the Polish Sejm between 1985 and 2011. We keep only the information regarding the elections of 2001, 2005, 2007, and 2011, as they were all held using the open-list PR system. The data set contains detailed information about the election results of parties and candidates as well as candidate background, such as gender, age, and incumbency. We expand this data set by appending the results from the Polish Sejm elections of 2015. These data come from the Polish National Election Commission. Thus, our analysis relies on five elections, of which three were held without the gender quota and two with the gender quota.
Members of the Polish Sejm are elected in 41 multimember districts. In the elections of 2001, 2005, 2007, 2011, and 2015, 39,246 candidates appeared on ballots. Roughly 45% of them (17,633) represented four major parties, which participated in all five elections under consideration and secured (with one exception) seats in all five legislative periods of the Sejm. The relevance of the aforementioned parties is corroborated by the fact that their representatives accounted for 87% of all elected members. In order to secure consistency, we therefore select for the empirical analysis only candidates running from the lists of the aforementioned four groupings. The parties selected for analysis are Law and Justice (PiS), Civic Platform (PO), Polish People's Party (PSL), and Democratic Left Alliance (SLD). In the elections of 2007 and 2015, the SLD participated in the broader leftist electoral coalitions, in which it remained the dominating group. For the sake of simplicity, we refer to these alliances also as SLD. In 2015, the United Left (ZL) alliance, led by the SLD, failed to surpass the 8% threshold for electoral alliances and did not win any seats in the Sejm (Marcinkiewicz and Stegmaier Reference Marcinkiewicz and Stegmaier2016). For the first time since 2001, one of the four major parties lost its parliamentary representation.
Analyzing Candidate Nomination Patterns
In order to test the first three hypotheses, we have to analyze the candidate nomination patterns of Polish parties. However, analyzing the impact of gender on candidate nomination patterns is surprisingly challenging, for two reasons that we will discuss in this section.
The first challenge stems from the fact that we have to define certain positions as promising, while other positions are less promising, as we have already discussed. Existing research provides no clear definition of when a ballot position can be considered to be particularly favorable or unfavorable. Instead, most of the existing research uses ad hoc definitions of promising ballot positions, which usually rely on the expected party magnitude (the number of elected candidates from a party list, M). Górecki and Kukołowicz (Reference Górecki and Kukołowicz2014, 71), for example, define all ballot positions that are smaller than or equal to twice the party magnitude as “viable positions.” Others simply use ordinal measures of promising ballot positions by differentiating between “very promising,” “rather promising,” “less promising,” and “unpromising” ballot positions (Jankowski and Marcinkiewicz Reference Jankowski and Marcinkiewicz2016).
All of these approaches, however, do not fully reflect the complexity of ballot position effects in open-list PR systems. While considering the party magnitude is certainly helpful, it is still a rather rough approach to use a categorical operationalization. Most importantly, existing approaches cannot take into account that the advantage of a candidate due to a certain ballot position decreases nonlinearly. For example, it is questionable to consider the ninth ballot position unpromising when party magnitude equals eight. Candidates’ vote shares are rather small toward the bottom of the ballot paper, and very few preferential votes are often decisive.
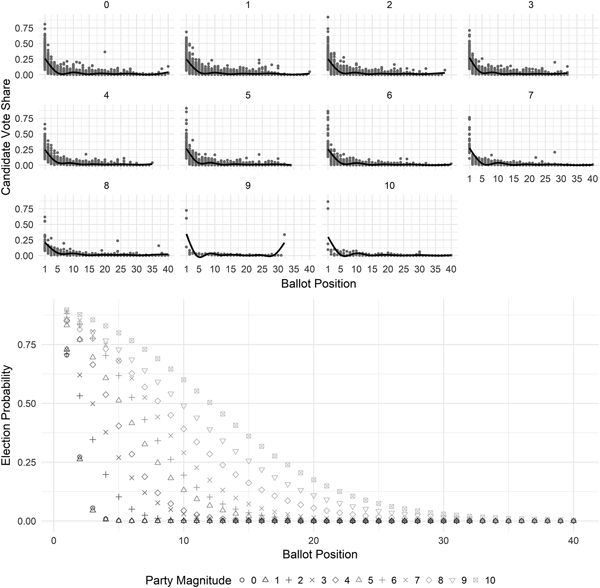
We display this aspect in the upper panel of Figure 1, which depicts a candidate's list vote share for each ballot position and for different party magnitudes. As can be seen, the relationship between vote share and ballot position is clearly nonlinear for all party magnitudes. Simply dichotomizing ballot positions as promising and unpromising does not fully account for the severe differences in the worthiness of ballot positions. Bluntly put, very few ballot positions are relevant when party magnitude is low, while a large number of ballot positions are relevant when party magnitude is high.
Vote share and election probabilities of an individual candidate conditional on ballot position and party magnitude

Therefore, we use a data-driven approach to compute the “value” of a ballot position. We define the value of each ballot position as the probability of being elected from the ballot position conditional on the party magnitude. For this purpose, we first run a logistic regression in which the dependent variable measures whether a candidate was elected. For lists without any elected candidates (i.e., M = 0) we treat the candidate with the highest number of preferential votes as elected since this candidate came closest to being elected. As independent variables, we use the ballot position (P) and party magnitude (M) as well as their interaction. In short, the model we estimate is defined as follows:
 $${\rm Pr}(Elected) = logit^{( - 1)}({\rm \alpha + \beta} \; \ast \; P + {\rm \gamma} \; \ast \; M + {\rm \delta} \; \ast \; (P \; \ast \; M) + {\rm \varepsilon}).$$
This model predicts the probability of being elected based on the ballot position and party magnitude. The model accounts for the fact that the probability of being elected from, for example, the fourth ballot position is very likely when M is large but rather low when M is small. We thus have a continuous measure for the value of each ballot position. It is therefore better suited to analyzing candidate nomination than categorical operationalizations, which are not sufficient to account for the difference in probabilities of being elected from different ballot positions. In the lower panel of Figure 1, we display how these probabilities are distributed based on the ballot position and district magnitude. As can be seen from the figure, this measure relaxes the distinction between promising and unpromising positions.
A second challenge when analyzing candidate nomination is the proper specification of the regression model used to analyze candidate nomination patterns. The standard approach in the literature is to run a regression in the following form:
 $$Position = {\rm \alpha} + {\rm \beta} \; \ast \; Female + {\rm \gamma} \; \ast \; X + {\rm \varepsilon},$$
where β is the effect of a candidate's gender and X is a vector of additional control variables. When the dependent variable is binary (favorable versus unfavorable position), a logit model is usually chosen for estimating the coefficients. Different variations of this logic can be found in a number of studies that analyze candidate placement (e.g., Allik 2015; Górecki and Kukołowicz Reference Górecki and Kukołowicz2014; Kunovich 2003; Put and Maddens Reference Put and Maddens2013).
The intention behind this approach is to estimate the probability of a candidate being elected to a promising ballot position. Unfortunately, the aforementioned model is ill suited for fulfilling this task. It estimates the probability of observing a promising position among women and men. This is a different quantity compared with the probability that a candidate on a promising ballot position is female. The latter is the quantity in which scholars are usually interested. Unfortunately, this quantity is rarely estimated. The approach outlined here can lead to paradoxical and heavily biased results because lists that nominate more women would often be considered less favorable for women.
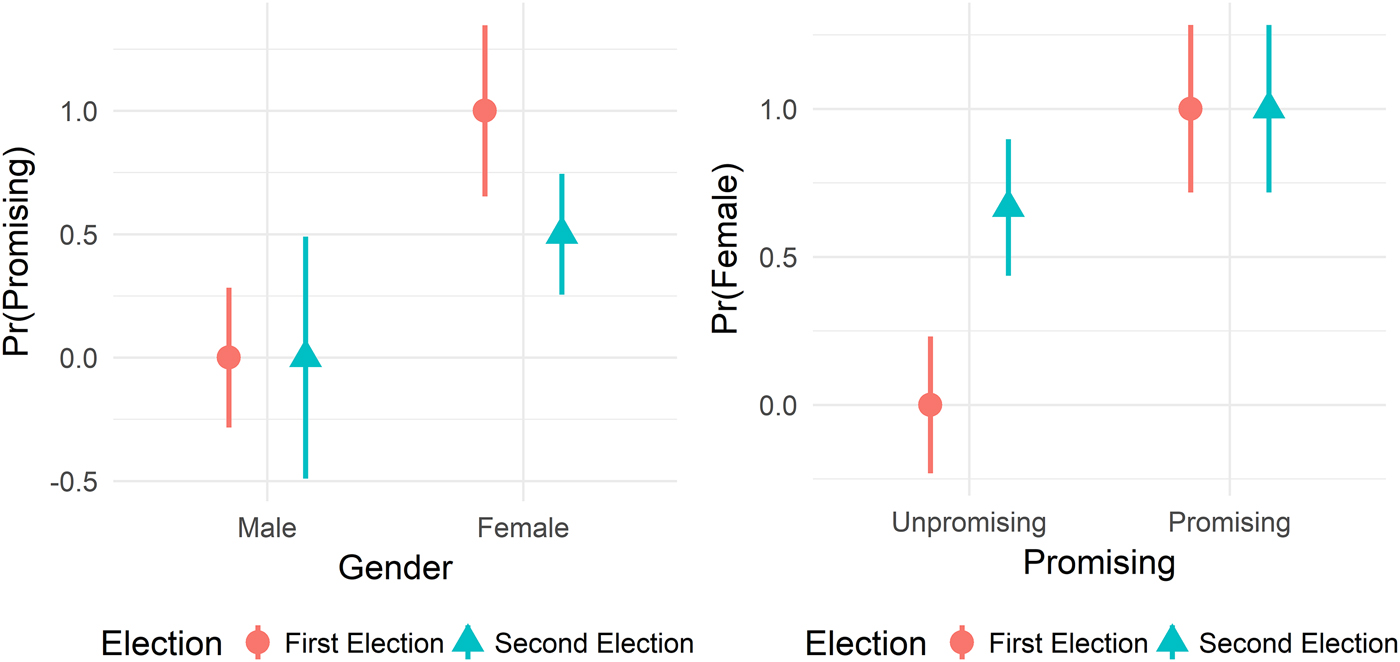
Consider the following example of party lists in two different elections. In both elections, the party nominated 10 candidates, and the first four positions are considered to be promising. In the first election, there are only four female candidates on the list, and all of them occupy the four promising ballot positions. In the second election, everything remains as in the previous election, except that now four additional female candidates are on the list (in unpromising ballot positions). The other four women are still nominated to the four favorable ballot positions. Obviosuly, the proportion of female candidates among the promising ballot positions in both elections equals 1. However, a regression analysis as specified earlier predicts something very different. The model predicts the probability of observing a promising position among women and this probability obviously decreased since more women are on the list. This would be interpreted as a negative effect of the second election on the nomination patterns, although there was no change at the promising positions and the overall share of women increased from 0.5 to 0.8. Therefore, this model leads to misleading results. In the left panel of Figure 2, we display these misleading predictions.
Comparison of different modeling strategies for analyzing nomination patterns

To account for this problem in analyzing candidate nomination patterns, we can simply exchange the main dependent and independent variables (i.e., gender and list placement):
 $$Female = {\rm \alpha} + {\rm \beta} \; \ast \; Position + {\rm \gamma} \; \ast \; X + {\rm \varepsilon}.$$
This new model yields the quantity we are interested in. Consider again the example of the two lists where the proportion of women increased drastically in the second election. When using the gender of a candidate as dependent variable, the predictions make sense as displayed in the right panel of Figure 2. We see no change in the probability of candidates nominated to the promising positions being female. In both cases, all promising positions were occupied by women. In the second election, the probability of also observing a woman at an unpromising position increased from 0 to 0.6. The ability of the alternative model with female as the dependent variable to account for this effect speaks to its superiority compared with the approach explaining a candidate's ballot position.
As discussed earlier, we use the value of the ballot position as our independent variable instead of the categorical indicator of a promising or unpromising position. Moreover, since we cover five elections, of which only two were held using the quota, we interact the position indicator with the election year. Finally, to account for differences between parties, we also interact position and election year with the party dummy. To analyze the impact of prior political experience, we control for incumbency. Since the dependent variable is binary (male or female), we use a logit model with clustered standard errors at the level of each party list.
Analyzing Preferential Votes
To estimate the number of votes received by each candidate, we rely on a mixture of the approaches outlined in Marcinkiewicz (Reference Marcinkiewicz2014) and Jankowski and Marcinkiewicz (Reference Jankowski and Marcinkiewicz2016). The dependent variable is a candidate's list vote share, defined as the number of votes for a candidate divided by the number of all votes for the party list. Again, the ballot position plays an important role in this analysis, as it is one of the main predictors of a candidate's electoral success. To account for the strong nonlinearity observed between ballot position and vote share (see upper panel of Figure 1), we use dummy variables for the first four ballot positions and a continuous variable of the ballot position for the remaining positions.
The variable of interest is the gender of a candidate included as a dummy variable in the model. We additionally control for incumbency, age, and age squared, since this might also influence candidate evaluation by voters (see, e.g., Campbell and Cowley Reference Campbell and Cowley2014, 753). Again, we include interaction terms in the model to capture the varying effect of gender depending on the election and party.
Simulations
To address our fourth hypothesis regarding the effects of the gender quota on the proportion of elected female candidates, we rely on a simulation approach. As outlined earlier, the previous hypotheses only suggest that the quota might have an impact on list placement or the received vote share, but it remains unclear whether the potentially observed effect sizes also translate into more parliamentary seats for women. This question cannot be answered by simply looking at the proportion of elected women in each election, as this quantity reflects only one of many possible election outcomes. For example, when those parties that showed less favorable placements for women perform well in the election, we might see a decrease in the number of women, even though the overall nomination patterns might have improved for women.
We account for this problem by simulating several different election outcomes using the following procedure:
1. For each election (2001, 2005, 2007, 2011, and 2015) and for each electoral district (41), we draw a random number of elected candidates for each party, which in total equals the district magnitude (M).
2. In the second step, we analyze how many women would have been elected from the district based on the party magnitude that emerged in Step 1 and the actual received preference vote share of the candidates. We hence establish who would fill the mandates assigned to the party in the simulation using the actual electoral performance of candidates representing a given party.
3. We calculate the proportion of elected female candidates as the total number of elected women in all district divided by 460 (total number of seats).
We repeat this procedure 10,000 times for each election. This simulation assumes that the vote shares of candidates within a party would have remained stable if the party received fewer or more votes. This is an assumption that might be questionable but we consider not unrealistic. Moreover, for this simulation, each party has the same chance of winning a seat, which is, of course, unrealistic, as the PO and PiS dominate the political landscape in most elections. We account for this aspect by running weighted simulations in which the probability for a party to win a seat is not equally distributed. We report these results in addition to the simulation with equal weights.
GENDER AND QUOTA EFFECTS ON CANDIDATE NOMINATION
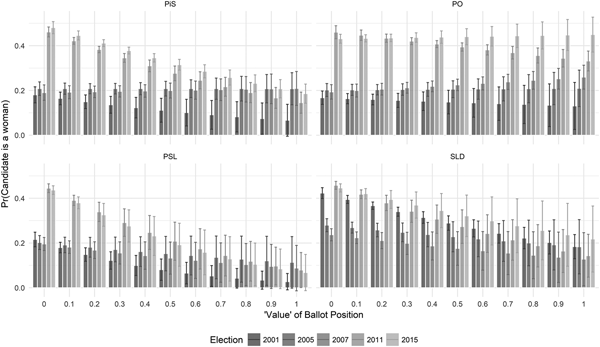
In Figure 3, we display the results of our nomination analysis. As outlined earlier, the main predictor variable is the value of a ballot position, which reflects the probability of being elected to parliament. On the y-axis, the figure displays the predicted probability of a candidate being female, while the x-axis displays the ballot position's value. Each bar reflects one of the five elections.
Probability of a candidate being a woman conditional on the value of a ballot position

We first focus on the two main parties of the Polish party system during the period under consideration (except for the election 2001), PiS and PO, which are displayed in the upper panel of Figure 3. For both parties, we can see a clear increase in the proportion of women at ballot positions with a very low election probability. For example, the expected share of women amounted to approximately 20% for both parties at very unpromising positions prior to the introduction of the gender quota. In 2011 and 2015, however, this share increased drastically to more than 40%. This finding nicely reflects the common assumption of ineffective gender quotas, which only increase the share of women at the lower end of the ballot paper.
When looking at the change at more promising ballot positions, however, we can see clear differences between the right-wing party, PiS, and the liberal party, PO. PiS displays nomination patterns in line with our theoretical expectations regarding right-wing parties—that is, the nomination probability of women decreases as the ballot position becomes more promising. Still, it is remarkable that for ballot positions with an election probability of 0.5, we can still see an increase in the predicted share of women compared with the pre-quota period. At ballot positions that basically guarantee election, nomination patterns remained stable for PiS. The picture looks very different for the PO. Here, the quota had a strong effect even at very promising positions with a high election probability. The effect was reinforced with respect to the PO by the internal quota including a placement mandate. In general, for the PO, we can see only a very small negative trend in the probability of nominating a woman with an increase in the election probability of the ballot position. It is also remarkable that the female candidate nomination patterns further improved on the lists of the PO in 2015.
We now turn to the results of the two smaller parties, the conservative agrarian PSL and the leftist SLD. For the PSL, the very low probability of nominating women in the pre-quota period has to be mentioned. The PSL nominated less than 20% female candidates for almost every ballot position, but the probability of nominating a woman to very promising positions was even lower, amounting to virtually zero. The quota did not change this picture very much. Clear increases in the proportion of women can only be witnessed up to positions with an election probability of 0.4. Finally, the leftist SLD is an interesting case. While it displayed a high probability of nominating women in 2001, in the elections of 2005 and 2007, we observe a clear decrease in the probability of nominating women to the lists of the SLD. Here we can also see the clear increase in the proportion of women on ballot positions with a low election probability. Because of the nonlinear candidate nomination pattern of this party, the change due to the gender quota is less obvious compared with the other parties.
What do these patterns indicate with regard to our first two hypotheses regarding candidate nomination? Our first hypothesis can be partly confirmed. We say partly not only because we solely find an increase at unpromising ballot positions. The hypothesis is also only partly confirmed because our continuous measure of the value of ballot positions can lead to different interpretations of when candidate nomination is really promising. For almost all parties, we find that female candidates were at least more likely to be nominated to positions characterized by the election probability of 0.5. While the election probability 0.5 is far from being a secure seat, it is also definitely not a hopeless list placement. Moreover, we also estimated models with the traditional dichotomous variable for list placement, solely differentiating between promising and unpromising positions; this approach shows an increase in women at favorable positions for all parties. Therefore, it is true that the quota in Poland was not as effective as a quota with a clear placement mandate, such as a zipper system. But the assumption that parties only filled up their lists with women at the bottom end of the ballot paper is too simplistic and ignores the fact that female candidates were more frequently nominated to positions with a reasonable chance of being elected.
These results are corroborated with regard to H 2, which expected differences in the nomination patterns for supporters and opponents of the gender quota. PiS and PSL, both of which were against the introduction of the quota (PSL voted finally in favor under the pressure of its coalition partner PO), show less favorable list placements of women and only a very small increase in the proportion of women at favorable positions. In contrast, the PO shows a clear adoption of more favorable nomination patterns for women since 2011. For the leftist SLD, this pattern is not as pronounced as for the PO.
Our results do not only question the widespread assumption that gender quotas without placement mandates are mostly ineffective. They also strongly contrast with the results presented in Górecki and Kukołowicz (Reference Górecki and Kukołowicz2014), who find that the quota in Poland had negative effects on women's placement. Comparing the nomination patterns of 2007 and 2011, Górecki and Kukołowicz (Reference Górecki and Kukołowicz2014, 73) argue that
[I]n the 2007 election the effects of being a woman on the probability of a candidate being ranked at a “viable” position on a party list are pervasively negative—regardless of whether or not candidate background was taken into account. The sole exception is the largest party—the Civic Platform. … These within-election year differences are, however, of negligible size. A major shift from this pattern takes place in 2011. For almost all the parties for which a comparison with the 2007 election is possible, the effects of being a woman on the probability of a candidate being ranked as “viable” move in the negative direction. Moreover, in the basic model those effects are substantial, ranging from –25.9 per cent to –11.7 per cent, and statistically significant.
Based on these results it is concluded that
It can thus be said that in 2011 women were universally placed at low list positions, a radical change in comparison to the more nuanced 2007 picture. … The evidence … indicates that after the quota adoption an ‘average’ female candidate was less likely to be placed at a viable list position than she was in the pre-quota period. (Górecki and Kukołowicz Reference Górecki and Kukołowicz2014, 73).
We highlight these differences between our results and the conclusions from Górecki and Kukołowicz (Reference Górecki and Kukołowicz2014) for two reasons. First, both analyses rely on the case of Poland and thus are comparable, but they yield extremely different results. Second, as argued in the methods section of this article, the results of Górecki and Kukołowicz (Reference Górecki and Kukołowicz2014) are caused by the employed research design, which is currently frequently used to analyze candidate nomination patterns.Footnote 3 The purpose of this article is not to point fingers but to highlight more generally how established approaches of analyzing candidate nomination patterns yield strongly biased effects. What is estimated by most existing approaches is not the probability of women being placed at promising ballot positions but instead the probability of observing a promising ballot position among women. Of course, this quantity decreased after introduction of the quota since more women were nominated and a majority of them were nominated to rather unpromising ballot positions. Still, this does not preclude the possibility that at least some women benefited from better list placement. As demonstrated by our analysis, this is exactly the case.
GENDER AND QUOTA EFFECTS ON WOMEN'S ELECTORAL SUCCESS
The results of the party nomination analysis suggest that parties did indeed nominate more women to at least somewhat favorable ballot positions. This does not necessarily mean, however, that women benefited from this better placement because of the open-list PR system, in which parliament composition is based solely on preferential votes. Voters can choose between different candidates and thus select a candidate based on gender. In this case, women might be ranked higher on the ballot paper, but they could still be disadvantaged in the election and ranked below male candidates by voters in the election.
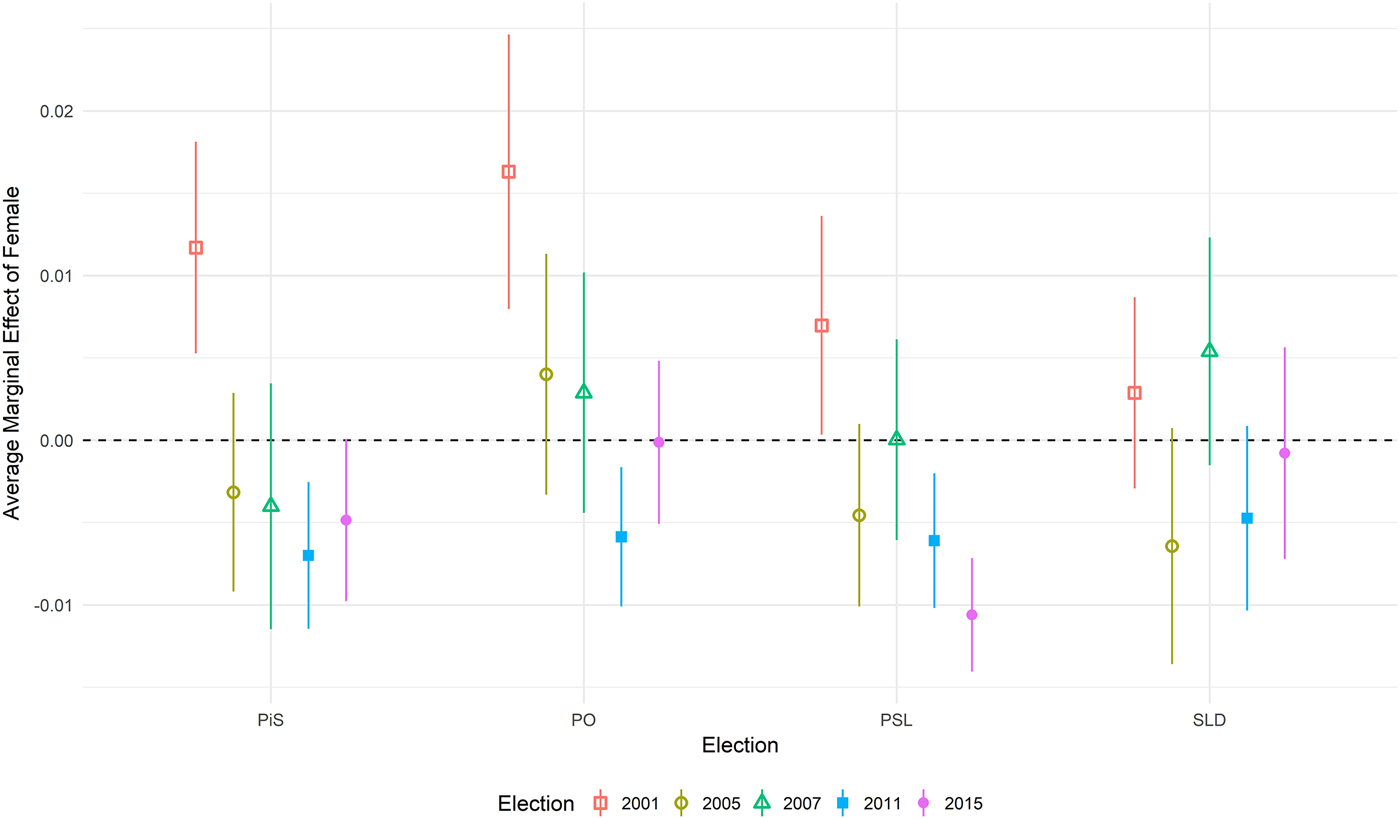
We present the results of our analysis in Figure 4. The figure depicts the marginal effect for female candidates. Negative values indicate that women were, on average, disadvantaged and received fewer votes than men. The x-axis displays the four parties under consideration. For each party, five estimates are shown—one for each election. Two conclusions can be drawn from these results. First, there is little evidence of a systematic disadvantage for women in Polish elections. There is no election and no model in which the gender effect is negative for all parties. The exception is the election of 2011, in which the effect of being female is negative for three of the four parties. The effect for the SLD is not significant at the .05 level, but the point estimate is also negative. This is in line with the observation by Górecki and Kukołowicz (Reference Górecki and Kukołowicz2014) that after the implementation of the gender quota in 2011, the number of votes for an “average” female candidate were lower compared with the elections of 2007. Given the fact that this pattern can only be observed for two of the four parties in the election of 2015, however, it is questionable how much of this effect can really be attributed to the quota or whether the results for 2011 occurred simply by chance. In the election of 2015, the negative gender effect can only be observed for the socially conservative parties, PiS and the PSL, while gender shows no significant effect for the two socially liberal parties, the PO and the SLD. This corresponds with our expectations regarding the interaction between gender effects and the left-right placement of the parties. It is also consistent with the findings reported by Wauters, Maddens, and Put (Reference Wauters, Maddens and Put2014), who find negative effects of gender quota immediately after its introduction and moderate positive effects in the long term.
Average marginal effect of female on vote share conditional on party and election
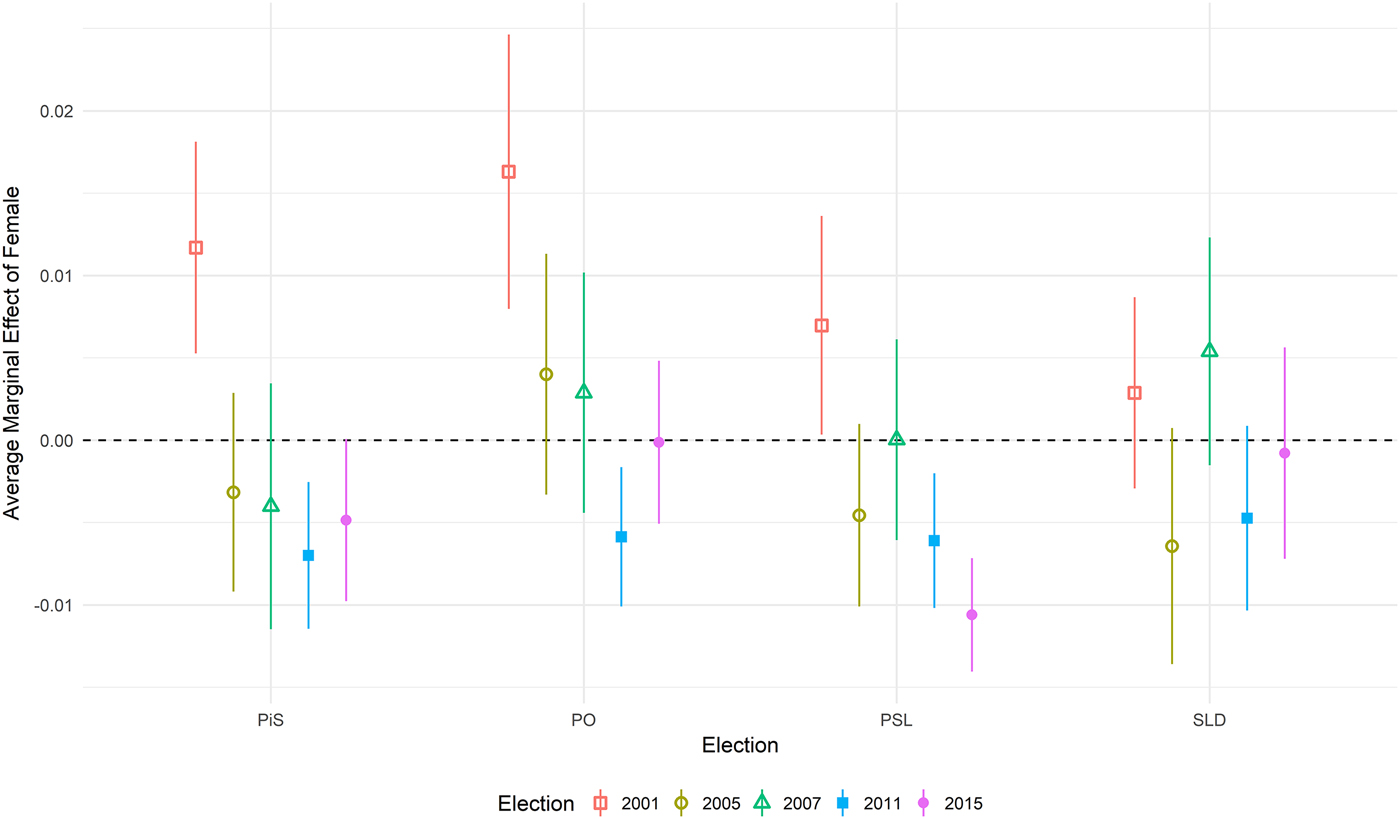
The second finding visible from Figure 4 is that gender effects are, if at all, modest in magnitude. Almost all of the marginal effects fall into a range between –1 and + 1 percentage points, which is very little and unlikely to make a difference except for very close races. While such close races are possible, in particular when district magnitude is large and several candidates occupying unfavorable ballot positions have the chance of being elected, the variation in the effect direction suggests that it is rather implausible to conclude that women will be systematically disadvantaged due to the open-list PR system. While a potential influence of gender cannot be excluded, the effect should not be overemphasised.
EVALUATING THE EFFECT OF THE GENDER QUOTA IN POLAND: SIMULATIONS
Given the aforementioned results, how can we evaluate the effectiveness of the gender quota in Poland? Our results suggest that, first and foremost, the gender quota had positive effects. It is not the case that more women were nominated only to the lower ballot positions; the introduction of the gender quota also increased the proportion of women at favorable ballot positions. Since the number of votes received by a candidate is strongly influenced by the placement of candidates on the party list, women thus obtained a higher chance to receive enough preferential votes to be elected to parliament. On the other hand, one might argue that there is little evidence for a negative effect of the gender quota on an average woman's vote share. The results with respect to the 2011 election confirm findings by Górecki and Kukołowicz (Reference Górecki and Kukołowicz2014), and in 2015, at least two out of four parties still show negative effects for women. Therefore, we observe effects that point in diverging directions. The candidate nomination analysis suggests that women benefited from the introduction of the gender quota, while the effects observed for the preferential vote analysis indicate that female candidates might be disadvantaged because of the introduction of the quota. In the following, we present results from a simulation of elected candidates that suggest that the positive effect of candidate nomination outweighs the potentially negative effect of gender-based preferential voting.
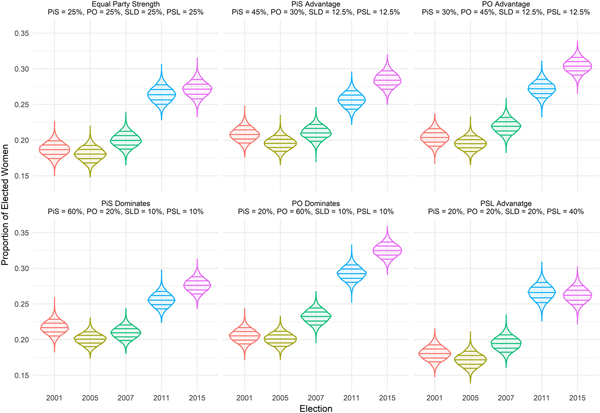
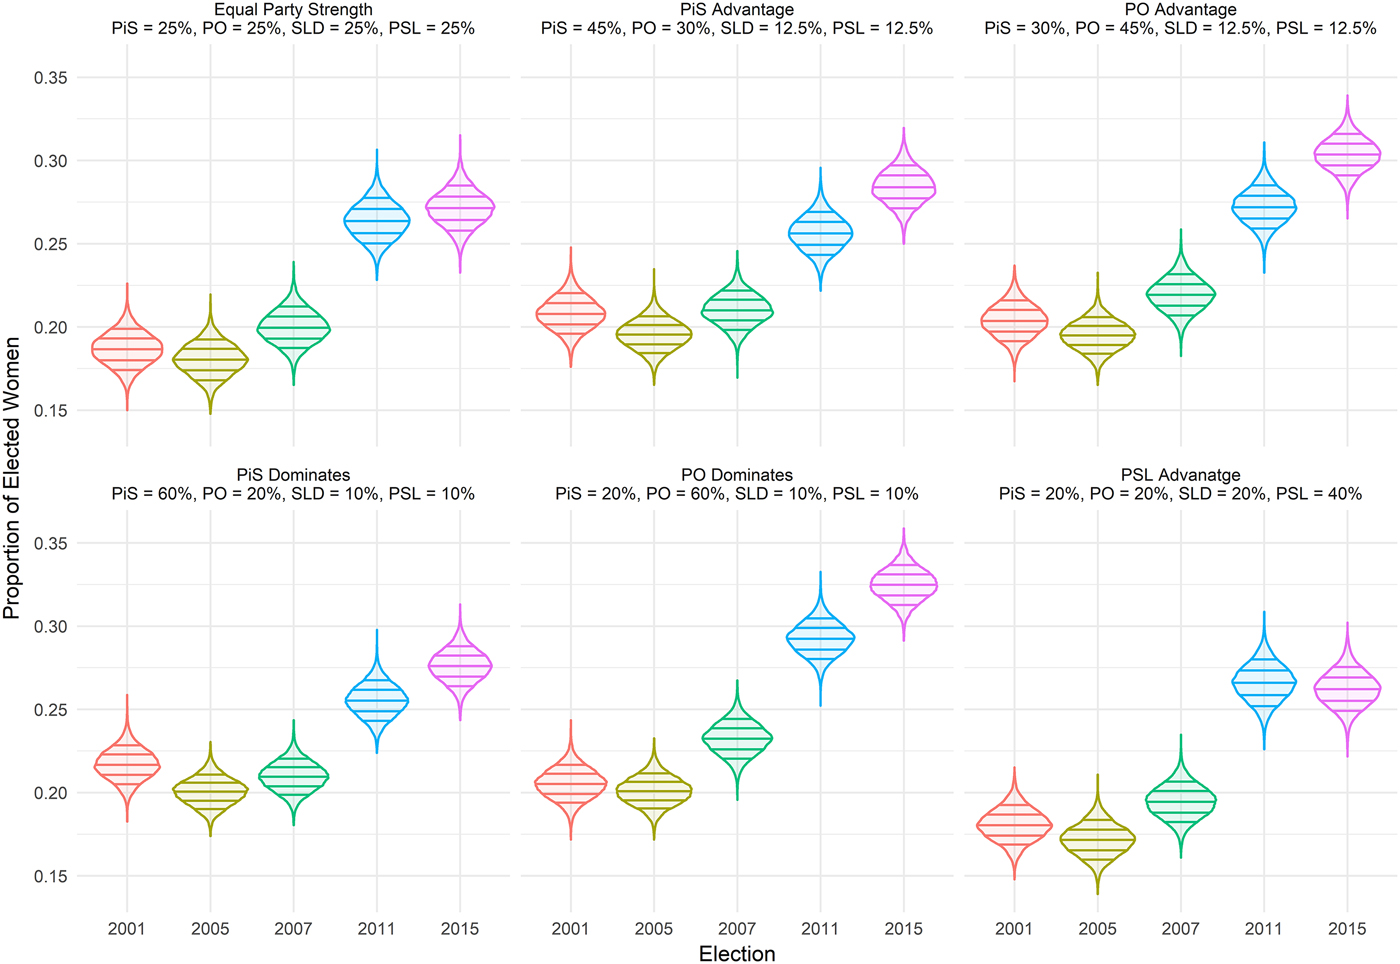
In Figure 5, the simulation results are displayed for six hypothetical election outcomes. The figure is a violin plot, which displays the distribution of the 10,000 simulation results for each election year. The horizontal lines within the violins are the 0.1, 0.25, 0.5, 0.75, and 0.9 quantiles. Under each of the displayed outcomes, which reflect different party strengths, we can see a clear increase in the proportion of female legislators after the implementation of the quota. In line with our results from the candidate nomination analysis, the proportion of female legislators is higher as the liberal PO performs better and lower as the socially conservative parties, such as PiS and the PSL, perform better. Comparing the elections 2007 and 2011, it is never the case that the 0.1 quantile from 2011 and the 0.9 quantile of the 2007 election overlap. In sum, the results strongly suggest that the increase in number of elected women to the Sejm is no random occurrence or caused by the specific strength of a party with particularly favorable candidate nomination patterns or preferential voting. Moreover, the simulated results for the election of 2011 and 2015 are often rather similar, indicating a large degree of stability in the electoral success of women. For some cases, the simulated increase in the proportion of women is even greater for the election 2015 which might indicate that the effectiveness of the quota might become more visible in future elections (Wauters, Maddens, and Put Reference Wauters, Maddens and Put2014).
Proportion of women elected to parliament under different election results
CONCLUSION
In this article, we have offered a detailed analysis of the effects of the introduction of a gender quota without a placement mandate in the open-list PR system of Poland. We have argued that in open-list PR systems, list placement is an important precondition for being elected, and therefore we analyzed list placement as well as preferential vote patterns.
Theoretically, we expected that under quotas without a placement mandate, parties would be likely to nominate more women to unfavorable ballot positions. However, we also argued that this does not preclude the possibility of small increase in favorable list placement for women. Using data on more than 17,000 candidates in Poland, we find that this is indeed the case: female candidates were nominated to less promising positions, but we can also observe an increase at positions that have at lease some chance of being advantageous. Moreover, we have shown that this increase is stronger for more liberal parties. Nonetheless, our simulations demonstrate that even if conservative parties had won by a large margin, the proportion of elected women would have increased.
Our analysis has also demonstrated that the effect of preferential voting on women's electoral success should not be exaggerated. While we observed some negative effects with respect to the electoral success of women, these effects are rather small in magnitude. Comparing the effects of the nomination analysis, the vote pattern analysis, and our simulations, we conclude that female candidates benefited from the quota because of better list placement. In this regard, our results suggest that the list placement of candidates was more relevant for the electoral success of a candidate than the candidate's gender. Of course, our analysis could not analyze how many voters prefer to vote for women or men. Our results are also compatible with, for example, high degrees of gender-based voting. Our point is that such biases seem to outweigh each other at the aggregate level, meaning that they do not affect the overall success of candidates.
More generally, our results suggest that gender quotas in open-list systems are at least partially successful in increasing women's numerical representation. Of course, the increase would be stronger under a closed-list PR system in combination with a placement mandate (e.g., in the case of a zipper approach). But analyzing placement and vote share data at the individual level, we can see a clear positive effect of the gender quota. This effect contrasts with the conclusions drawn from aggregate analyses, which focus on the determinants of institutional variables (e.g., Luhiste Reference Luhiste2015; Schmidt Reference Schmidt2009).
The results of this study have several implications for future research. First, it is obvious that we have only focused on the descriptive representation of women—that is, we simply analyzed the number of women elected to parliament. We did not analyze the impact of the gender quota on issues related to substantive representation, which might be considered to be an even more important question (e.g., Erzeel and Celis Reference Erzeel and Celis2016).
Second, based on the available data, this study was only able to analyze the overall nomination and preferential vote patterns. We were not able, however, to directly assess the causal mechanisms that are at work. Therefore, a more detailed analysis of gender quotas’ impact on candidate nomination patterns within parties, as well as the voter decision-making process, seems highly desirable. We also could not analyze whether the overall proportion of women influenced the overall success of a party list. Our analysis is only concerned with the analysis of how vote patterns differed between candidates of the same party. However, it has also been suggested that parties with a more gender-balanced party list might be able to attract more votes (Golder et al. Reference Golder, Stephenson, Van der Straeten, Blais, Bol, Harfst and Laslier2017). By using the varying levels of increase in the proportion of female candidates on the list, future research can provide an empirical test of this hypothesis.
Finally, we focused on analyzing the case of the Polish Sejm elections. The scope of this article should be expanded to also include a comparative perspective. On the one hand, a comparison with local or European Parliament election results in Poland seems interesting in order to evaluate impact of the gender quota in different electoral contexts. On the other hand, cross-country comparisons should also be considered in order to better understand how different political institutions and political cultures influence the effectiveness of gender quotas.
SUPPLEMENTARY MATERIAL
To view supplementary material for this article, please visit https://doi.org/10.1017/S1743923X17000538.