Cardiovascular disease (CVD) remain the leading cause of death worldwide, accounting for 17·9 million deaths in 2019, corresponding to nearly one third of all global deaths(1). Beyond its clinical impact, the economic burden of CVD is escalating, with costs in the USA alone projected to exceed one trillion dollars annually by 2035(Reference Dunbar, Khavjou and Bakas2). Lifetime risk estimates from the Framingham Heart Study highlight the magnitude of this problem, showing that nearly one in two men and one in three women will develop CVD during their lifetime(Reference Fox, Pencina and Wilson3). Despite advances in pharmacological therapies, the persistence of high prevalence and rising costs highlights the urgent need for effective dietary and lifestyle strategies to reduce cardiometabolic risk.
Among the many modifiable risk factors, diet plays a central role. In addition to established determinants such as dyslipidaemia, hypertension and diabetes, chronic low-grade inflammation has emerged as a key driver of atherosclerosis and cardiovascular events(Reference Magnussen, Ojeda and Leong4). Inflammatory processes exacerbate atherosclerosis and are closely linked to adverse metabolic disturbances(Reference Geng, Chen and Yuan5,Reference Saltiel and Olefsky6) . Biomarkers such as C-reactive protein (CRP) have been consistently associated with cardiovascular events, underscoring the role of inflammation as both a predictor and mediator of disease progression(Reference Bisoendial, Boekholdt and Vergeer7,Reference Hartley, Rostamian and Kaura8) .
Dietary fibre is one of the most consistently protective components of a healthy diet. Higher intake of fruits, vegetables, legumes and whole grains is associated with reduced risk of CVD, partly through improvements in lipid metabolism and inflammation(Reference Shivakoti, Biggs and Djoussé9–Reference Larsson, Sun and Ahmad11). However, achieving recommended intake levels remains challenging in modern societies(Reference Cordain, Eaton and Sebastian12,Reference Sonnenburg and Sonnenburg13) . Current recommendations, such as those from the Academy of Nutrition and Dietetics (AND) (14 g/1000 kcal)(Reference Dahl and Stewart14) and the Institute of Medicine (IOM) (25 g/d for women, 38 g/d for men),(15) were established to support overall health and chronic disease prevention but may not reflect optimal intakes for cardiovascular protection.
Recent evidence suggests that current dietary fibre recommendations may underestimate the intake required to achieved optimal health benefits. Randomised controlled trials and cohort studies indicate that intakes substantially higher than current guidelines are associated with incremental improvements in systemic inflammation, lipid profile and other cardiometabolic outcomes(Reference Jew, AbuMweis and Jones16–Reference Li, Armet and Korpela18). This raises an important and timely question: are existing dietary fibre recommendations sufficient or should they be redefined to reflect higher levels of intake that may confer maximal cardioprotective effects?
To address this gap, the present study examined the associations between dietary fibre intake and systemic inflammation (CRP) as well as lipid biomarkers (total cholesterol, low-density lipoprotein (LDL), high-density lipoprotein (HDL) and triglycerides (TAG)) in a nationally representative sample of USA adults. We specifically evaluated whether exceeding current recommendations provides measurable additional benefits, thereby contributing evidence to inform potential reappraisal of dietary guidelines.
Methods
The National Health and Nutrition Examination Survey (NHANES) is a cross-sectional survey designed to assess the health and nutritional status of the USA population across all age groups. The survey’s publicly accessible database is released in two-year cycles, allowing data access through its website (www.cdc.gov/nchs/nhanes/). For the present analysis, we combined data from the 2015–2016 and 2017–2018 cycles.
Participant data were compiled from demographic, dietary, physical examination, laboratory and health-related questionnaire files, which included information on medical history, physical activity, medication use, smoking, alcohol intake and other relevant variables. Adults aged ≥ 20 years with valid day 1 dietary intake data and at least one biomarker of interest (LDL, HDL, TC, TAG or CRP) were eligible for inclusion. Pregnant women were excluded.
Demographics and dietary assessment
Demographic information (age, sex and race/ethnicity) was collected via household-administered questionnaires. Dietary intake was assessed using a single 24-h dietary recall, which captures food consumption in the preceding 24 h(Reference Willett19). For this study, only the first dietary interview, conducted in person at the NHANES Mobile Examination Centre (MEC), was included due to its higher participant count. Data collection protocols are available in detail in the NHANES interviewer procedure manuals(20).
Daily fibre intake was categorised according to the recommendations of the Academy of Nutrition and Dietetics (AND; 14 g/1000 kcal)(Reference Dahl and Stewart14) and the Institute of Medicine (IOM; 25 g/d for women, 38 g/d for men)(15). For IOM recommendations, sex-specific cut-offs were applied. Four intake categories were defined: 0–49 %, 50–99 %, 100–149 % and ≥ 150 % of the recommendations. This stratification allowed assessment of both adherences to and intake beyond the recommended levels.
C-reactive protein and lipid profile assessment
Blood samples were collected at the MEC for the measurement of CRP, TC, LDL, HDL and TAG. Samples were processed according to NHANES protocols and analysed in certified laboratories. A complete blood count was performed using a Coulter® DxH 800 analyser with EDTA-treated blood. Detailed laboratory methods are available in the NHANES Laboratory Procedures Manual(20,21) . For LDL and TAG, which require fasting, only participants from the fasting subsample (SAF; ≥ 12 h fast) were included.
Statistical analysis
All analyses were conducted in Stata version 14.0 using survey procedures (svy) to account for NHANES’ complex sampling design. Five analytic subpopulations were created according to the availability of biomarkers. The subpopulation with TC data (largest sample) was used for baseline characterisation. Continuous variables are presented as means with 95 % CI and categorical variables as prevalence estimates with 95 % CI. Associations between fibre intake categories and CRP, TC, LDL, HDL and TAG were examined using linear regression models. Dietary fibre intake, categorised into predefined ranges described above, was the main exposure variable. Models were adjusted for potential confounders, including energy intake (kcal), sex, race/ethnicity (Mexican American, other Hispanic, non-Hispanic White, non-Hispanic Black, non-Hispanic Asian and other/multiracial), age group (20–34; 35–59; 60–79; ≥ 80 years), alcohol use (never/rarely, 1 drink/d, 2 drinks/d, 3 drinks/d, ≥ 4 drinks/d, not reported), BMI (kg/m2), sedentary activity (min/d), smoking (past 30 d: yes/no) and use of lipid-lowering medications. For CRP models, all covariates except lipid-lowering medication use were considered. Confounders were selected using backward elimination, retaining variables with P < 0·20 in the final model. MEC sample weights were applied for CRP, TC and HDL analyses, and fasting subsample (SAF) weights for LDL and TAG. A 4-year weighting scheme was implemented to reflect the combined survey cycles. A two-tailed P < 0·05 was considered statistically significant.
Results
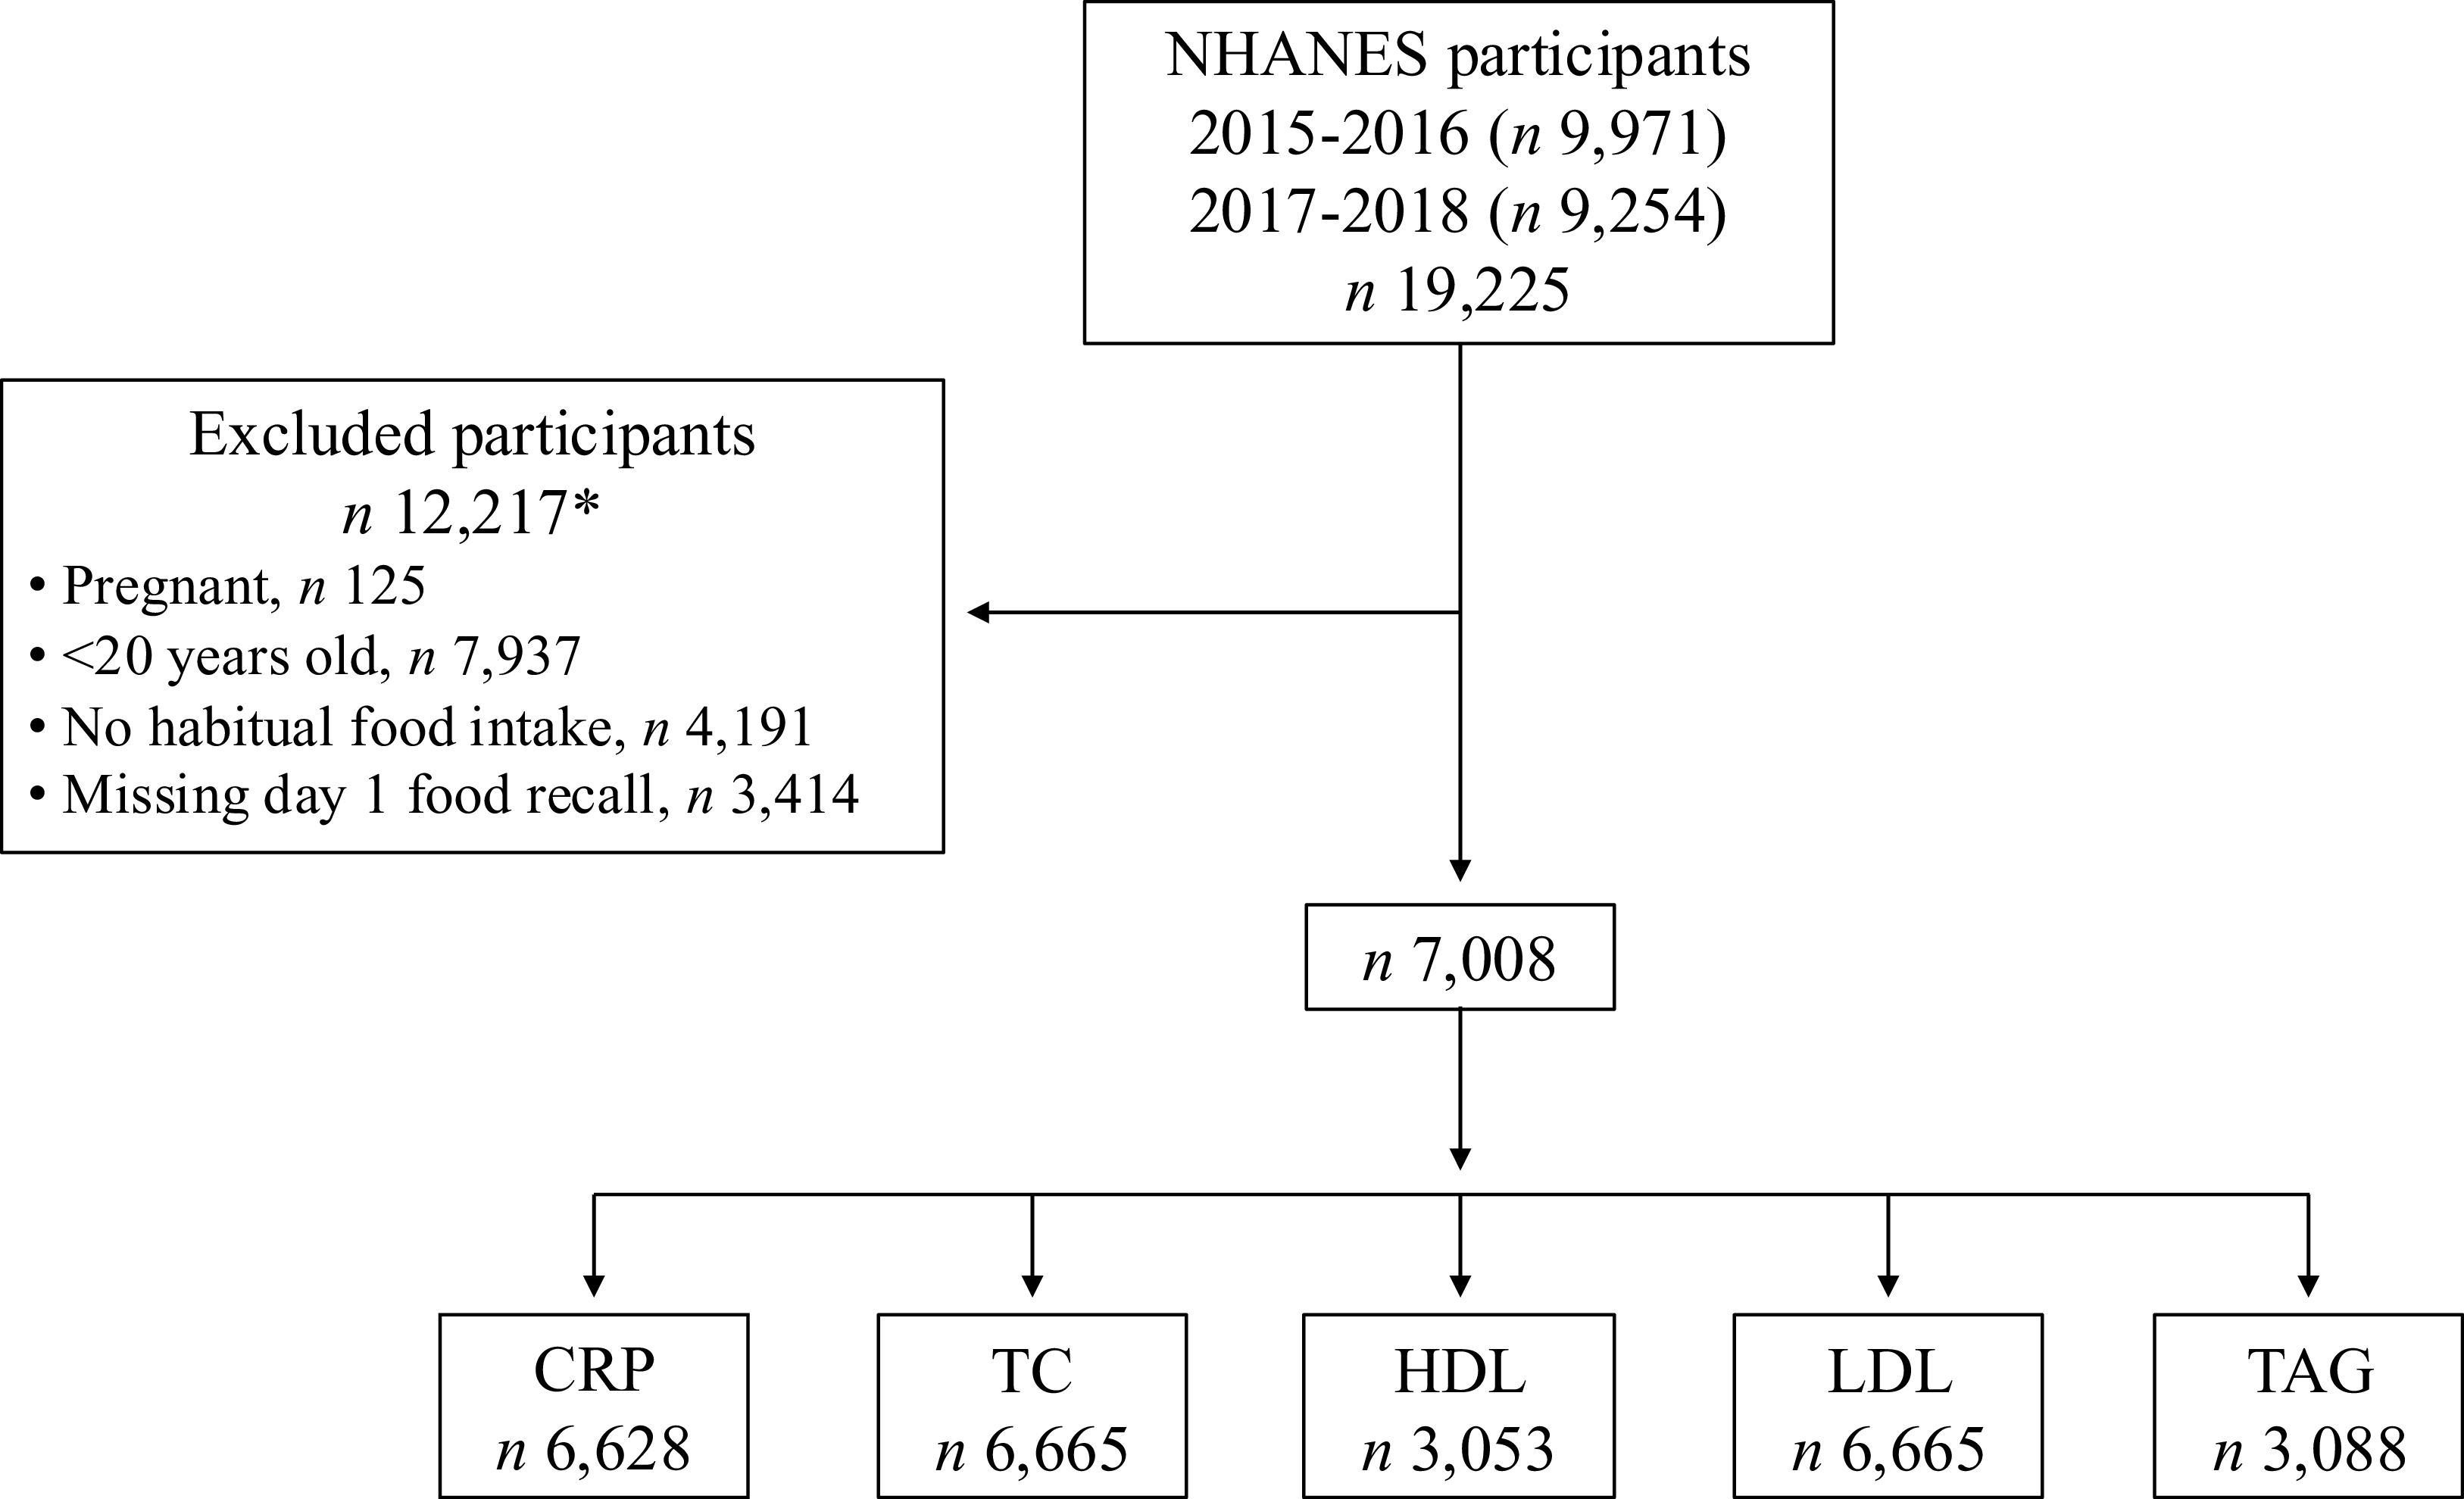
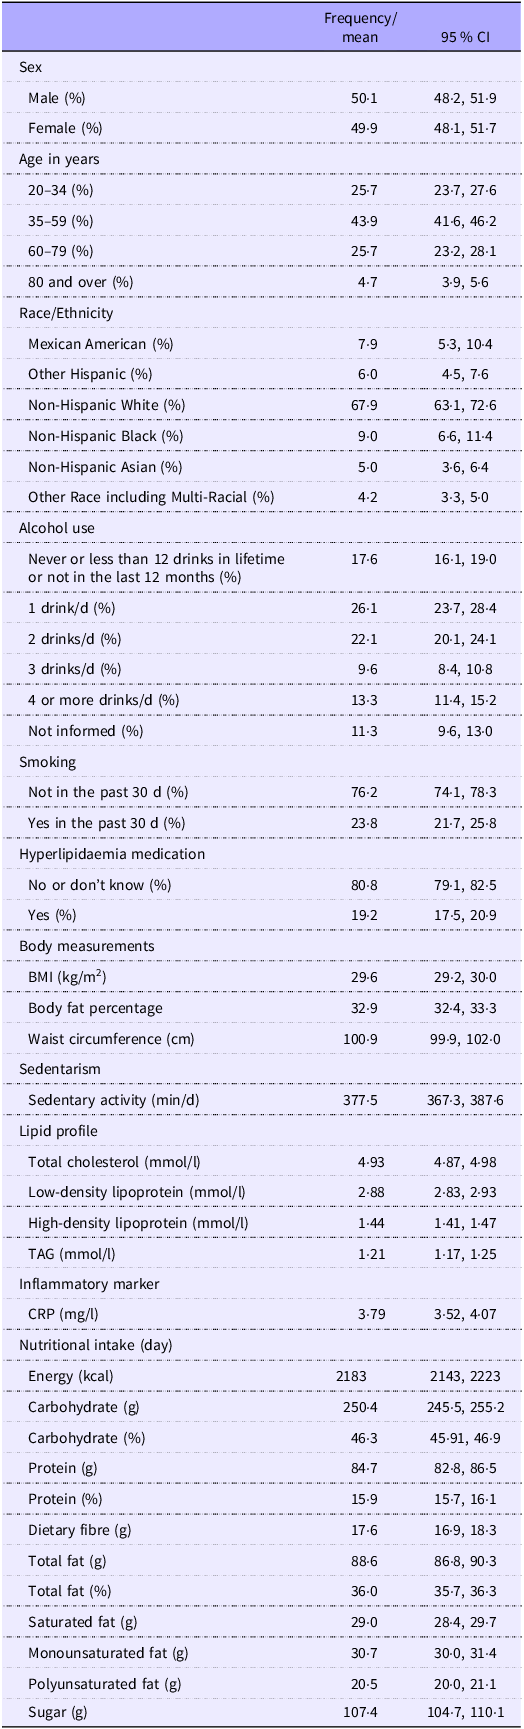
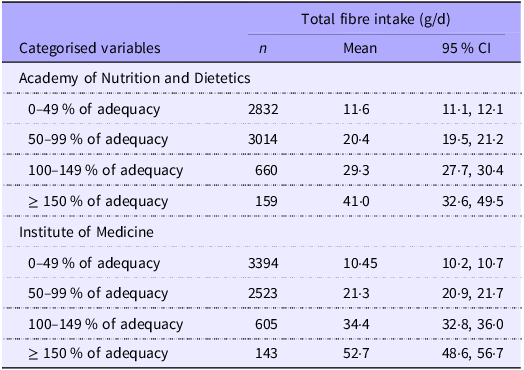
From 19 225 individuals enrolled in the 2015–2018 NHANES survey, 12 217 were excluded after applying eligibility criteria, leaving 7008 participants for analysis (Figure 1). Population characteristics are shown in Table 1. Mean daily energy intake was 2521 kcal (95 % CI: 2466, 2576) in males and 1844 kcal (95 % CI: 1808, 1880) in females. Mean fibre intake was 19·4 g/d (95 % CI: 18·5, 20·2) in males and 15·8 g/d (95 % CI: 15·2, 16·4) in females. The mean age was 48 years in males and 50 years in females. Mean BMI was 29·5 kg/m2 in males and 29·8 kg/m2 in females, with mean waist circumference of 103·3 cm and 98·6 cm, respectively. Most participants were non-Hispanic White (67·9 %); 76·2 % had not smoked in the past 30 d and 80·8 % were not taking lipid-lowering medications. Distribution of participants across fibre intake categories according to AND and IOM recommendations is shown in Table 2. Participants consuming 100–149 % and > 150 % of the IOM fibre recommendation had, on average, 5 g and 11 g more fibre, compared with those in the corresponding AND fibre intake categories (Table 2).
NHANES 2015–18 Participant Flow Diagram. * The sum of values is different from the total value because individuals may have more than one reason for exclusion.

Sample characterisation (n 7008)

Table 1. Long description
A table summarizing population characteristics from a survey of 7008 participants. The table has 32 rows and 3 columns. Column headers are Frequency/mean, 95% CI. Row labels include Sex, Age in years, Race/Ethnicity, Alcohol use, Smoking, Hyperlipidemia medication, Body measurements, Sedentary activity, Lipid profile, Inflammatory marker, Nutritional intake. Row 1: Sex, Male percent, 50.1, 48.2, 51.9. Row 2: Sex, Female percent, 49.9, 48.1, 51.7. Row 3: Age in years, 20-34 percent, 25.7, 23.7, 27.6. Row 4: Age in years, 35-59 percent, 43.9, 41.6, 46.2. Row 5: Age in years, 60-79 percent, 25.7, 23.2, 28.1. Row 6: Age in years, 80 and over percent, 4.7, 3.5, 5.6. Row 7: Race/Ethnicity, Mexican American percent, 7.9, 5.3, 10.4. Row 8: Race/Ethnicity, Other Hispanic percent, 6.0, 4.5, 7.6. Row 9: Race/Ethnicity, Non-Hispanic White percent, 67.9, 63.1, 72.6. Row 10: Race/Ethnicity, Non-Hispanic Black percent, 9.0, 6.6, 11.4. Row 11: Race/Ethnicity, Non-Hispanic Asian percent, 5.0, 3.6, 6.4. Row 12: Race/Ethnicity, Other Race including Multi-Racial percent, 4.2, 3.3, 5.0. Row 13: Alcohol use, Never or less than 12 drinks in lifetime or not in the last 12 months percent, 17.6, 16.1, 19.0. Row 14: Alcohol use, 1 drink/d percent, 26.1, 23.7, 28.4. Row 15: Alcohol use, 2 drinks/d percent, 22.1, 20.1, 24.1. Row 16: Alcohol use, 3 drinks/d percent, 9.6, 8.4, 10.8. Row 17: Alcohol use, 4 or more drinks/d percent, 13.3, 11.4, 15.2. Row 18: Alcohol use, Not informed percent, 11.3, 9.6, 13.0. Row 19: Smoking, Not in the past 30 d percent, 76.2, 74.1, 78.3. Row 20: Smoking, Yes in the past 30 d percent, 23.8, 21.7, 25.8. Row 21: Hyperlipidemia medication, No or don’t know percent, 80.8, 79.1, 82.5. Row 22: Hyperlipidemia medication, Yes percent, 19.2, 17.5, 20.9. Row 23: Body measurements, BMI kg/m2, 29.6, 29.2, 30.0. Row 24: Body measurements, Body fat percentage, 32.9, 32.4, 33.3. Row 25: Body measurements, Waist circumference cm, 100.9, 99.9, 102.0. Row 26: Sedentary activity min/d, 377.5, 367.3, 387.6. Row 27: Lipid profile, Total cholesterol mmol/l, 4.93, 4.87, 4.98. Row 28: Lipid profile, Low-density lipoprotein mmol/l, 2.88, 2.83, 2.93. Row 29: Lipid profile, High-density lipoprotein mmol/l, 1.44, 1.41, 1.47. Row 30: Lipid profile, TAG mmol/l, 1.21, 1.17, 1.25. Row 31: Inflammatory marker, CRP mg/l, 3.79, 3.52, 4.07. Row 32: Nutritional intake day, Energy kcal, 2183, 2143, 2223. Row 33: Nutritional intake day, Carbohydrate g, 250.4, 245.5, 255.2. Row 34: Nutritional intake day, Carbohydrate percent, 46.3, 45.91, 46.69. Row 35: Nutritional intake day, Protein g, 84.7, 82.8, 86.5. Row 36: Nutritional intake day, Protein percent, 15.9, 15.7, 16.1. Row 37: Nutritional intake day, Dietary fibre g, 17.6, 16.9, 18.3. Row 38: Nutritional intake day, Total fat g, 88.6, 86.8, 90.3. Row 39: Nutritional intake day, Total fat percent, 36.0, 35.7, 36.3. Row 40: Nutritional intake day, Saturated fat g, 29.0, 28.4, 29.7. Row 41: Nutritional intake day, Monounsaturated fat g, 30.7, 30.0, 31.4. Row 42: Nutritional intake day, Polyunsaturated fat g, 20.5, 20.0, 21.1. Row 43: Nutritional intake day, Sugar g, 107.4, 104.7, 110.1.
Fibre intake characterisation (n 7008)

Table 2. Long description
A table comparing fiber intake based on different adequacy categories and recommendations. The table has 8 rows and 5 columns. The columns are labeled ‘Categorised variables’, ‘n’, ‘Total fibre intake (g/d)’, ‘Mean’, and ‘95% CI’. The rows are grouped under two main categories: Academy of Nutrition and Dietetics and Institute of Medicine. Each category has four adequacy levels: 0-49% of adequacy, 50-99% of adequacy, 100-149% of adequacy, and >= 150% of adequacy. Row 1: Academy of Nutrition and Dietetics, 0-49% of adequacy, 2832, 11.6, 11.1, 12.1. Row 2: Academy of Nutrition and Dietetics, 50-99% of adequacy, 3014, 20.4, 19.5, 21.2. Row 3: Academy of Nutrition and Dietetics, 100-149% of adequacy, 660, 29.3, 27.7, 30.4. Row 4: Academy of Nutrition and Dietetics, >= 150% of adequacy, 159, 41.0, 32.6, 49.5. Row 5: Institute of Medicine, 0-49% of adequacy, 3394, 10.45, 10.2, 10.7. Row 6: Institute of Medicine, 50-99% of adequacy, 2523, 21.3, 20.9, 21.7. Row 7: Institute of Medicine, 100-149% of adequacy, 605, 34.4, 32.8, 36.0. Row 8: Institute of Medicine, >= 150% of adequacy, 143, 52.7, 48.6, 56.7.
Fibre intake categories were defined as follows: 0–49 % of adequacy (0–6·9 g/1000 kcal; 0–12·4 g/d in females (F); 0–18·9 g/d in males (M)); 50–99 % (7–13·9 g/1000 kcal; F: 12·5–24·9 g/d; M: 19–37·9 g/d); 100–149 % (14–20·9 g/1000 kcal; F: 25–37·4 g/d; M: 38–56·9 g/d) and ≥ 150 % (≥ 21 g/1000 kcal; F ≥ 37·5 g/d; M ≥ 57 g/d), based on Academy of Nutrition and Dietetics and Institute of Medicine recommendations. CI: confidence interval; n: number of participants.
Dietary fibre and systemic inflammation
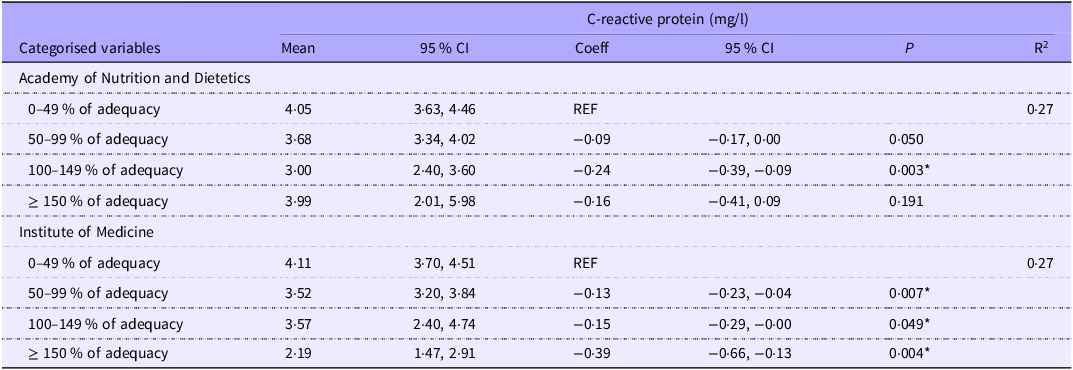
Higher fibre intake was associated with lower CRP concentrations (Table 3, online Supplementary Figure S1). According to AND categories, reductions were observed in participants consuming 100–149 % of the recommendation (−0·24 mg/l; 95 % CI: −0·39, −0·09; P = 0·003), but not in those consuming ≥ 150 %. Using IOM categories, significant reductions in CRP were observed in participants consuming 50–99 % (−0·13 mg/l; 95 % CI: −0·23, −0·04; P = 0·007), 100–149 % (−0·15 mg/l; 95 % CI: −0·29, 0·00; P = 0·049) and ≥ 150 % of the recommendation (−0·39 mg/l; 95 % CI: −0·66, −0·13; P = 0·004), compared with those consuming 0–49 % (Table 3). In sex-stratified analyses, CRP reductions were significant only in females consuming ≥ 150 % of the recommendation (mean intake: 44·2 g/d; coefficient = −0·39 mg/l; 95 % CI: −0·67, −0·12; P = 0·007; online Supplementary Table S2), with a borderline reduction in males in the same category (mean intake: 69·8 g/d; coefficient = −0·40 mg/l; 95 % CI: −0·81, 0·00; P = 0·052; online Supplementary Table S2).
Characterisation of C-reactive protein concentration across dietary fibre intake categories and their associations (n 7008)

Table 3. Long description
A table comparing C-reactive protein levels across dietary fiber intake categories. The table has 8 rows and 7 columns. The columns are labeled as Categorised variables, Mean, 95% CI, Coeff*, 95% CI, P, and R2. The rows are grouped under two headings: Academy of Nutrition and Dietetics and Institute of Medicine. Each group has four rows representing different percentages of adequacy: 0-49%, 50-99%, 100-149%, and >= 150%. The values in the table include mean, 95% confidence intervals, coefficients, and P-values for each category. Notable trends include reductions in C-reactive protein levels for certain categories of dietary fiber intake.
Fibre intake categories were defined as follows: 0–49 % of adequacy (0–6·9 g/1000 kcal; 0–12·4 g/d in females (F); 0–18·9 g/d in males (M)); 50–99 % (7–13·9 g/1000 kcal; F: 12·5–24·9 g/d; M: 19–37·9 g/d); 100–149 % (14–20·9 g/1000 kcal; F: 25–37·4 g/d; M: 38–56·9 g/d); and ≥ 150 % (≥ 21 g/1000 kcal; F ≥ 37·5 g/d; M ≥ 57 g/d), based on Academy of Nutrition and Dietetics and Institute of Medicine recommendations. CI: confidence interval; REF: reference group for regression; Coeff: regression coefficient. Models adjusted for caloric intake, sex, age, BMI and smoking. *Indicates statistical significance.
Dietary fibre and lipid profile
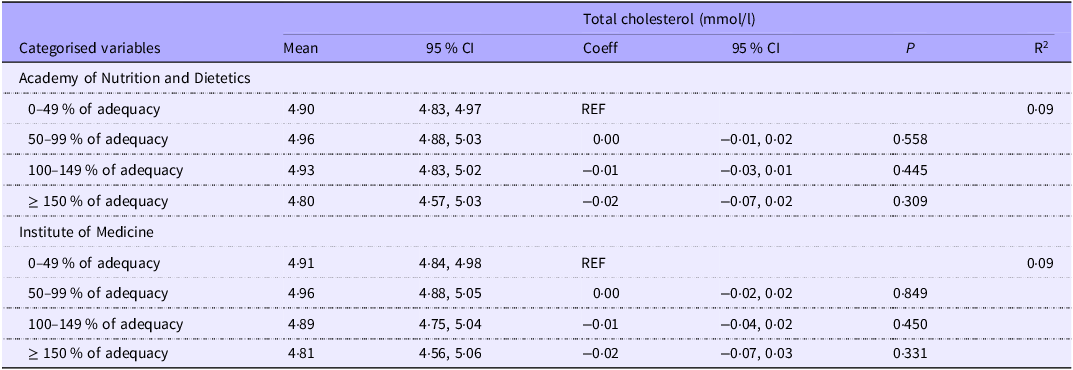
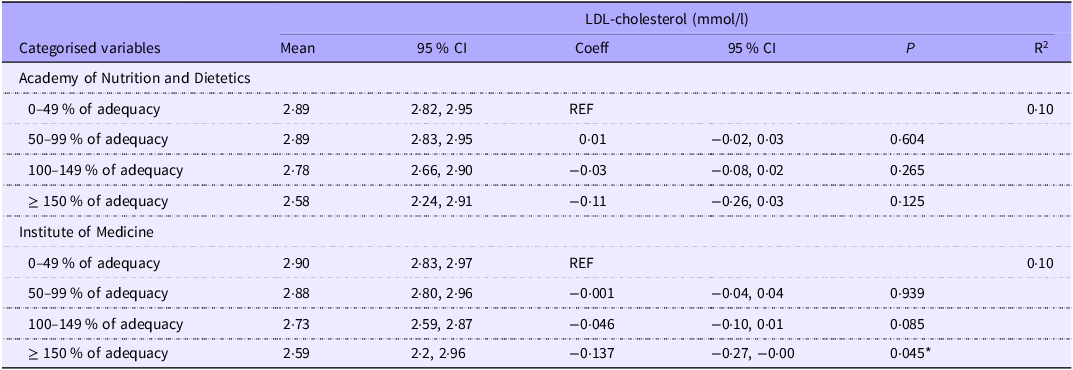
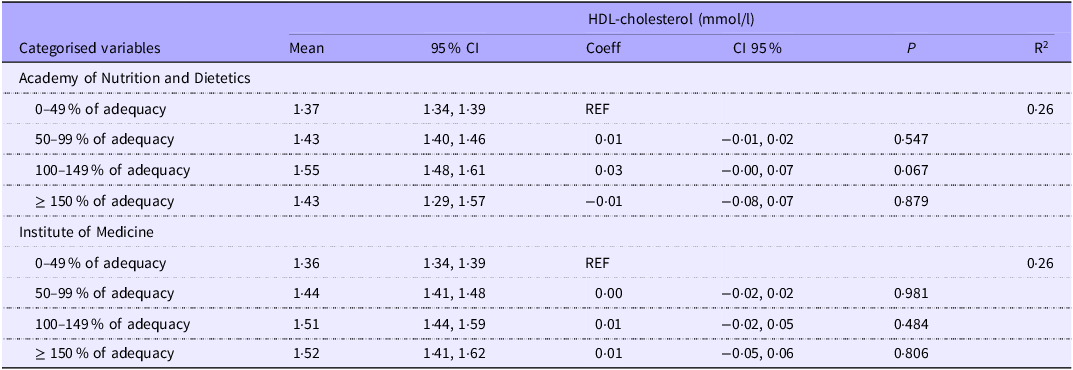
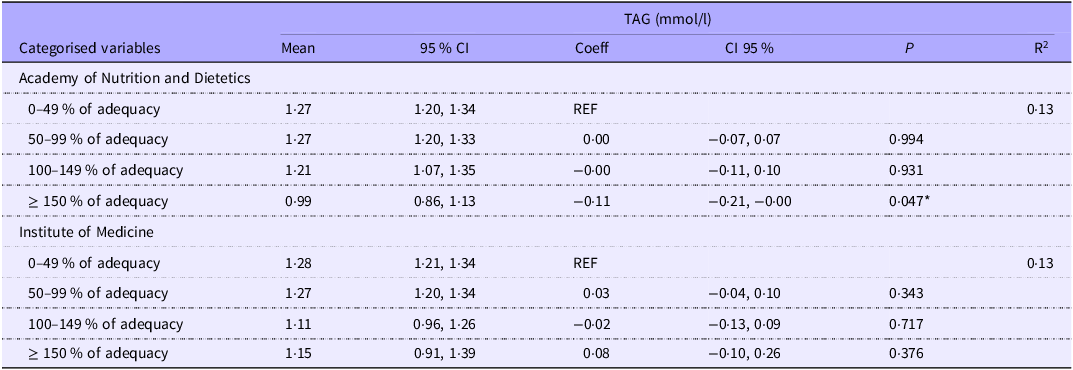
Among males, lower TC concentrations were observed in those consuming ≥ 150 % of the IOM fibre recommendation (−0·13 mg/dl; 95 % CI: −0·25, −0·01; P = 0·033; online Supplementary Table S3). No other significant associations with TC were identified (Table 4). For LDL-cholesterol, compared with those within 0–49 % of the recommendation, reductions were observed in participants consuming ≥ 150 % of the IOM recommendation (−0·14 mg/dl; 95 % CI: −0·27, 0·00; P = 0·045; Table 5), in females consuming 100–149 % (mean intake: 44·20 g/d; coefficient = −0·07 mg/dl; 95 % CI: −0·14, −0·01; P = 0·032, online Supplementary Table S4), and in males consuming ≥ 150 % (mean intake: 69·8 g/d; coefficient = −0·36 mg/dl; 95 % CI: −0·64, −0·09; P = 0·011; online Supplementary Table S4). No significant associations were observed for HDL-cholesterol across any categories (Table 6 and online Supplementary Table S5). For TAG, lower concentrations were observed in participants consuming ≥ 150 % of the AND fibre recommendation (mean intake: 25·1 g/1000 kcal/d; coefficient = −0·11 mg/dl; 95 % CI: −0·21, 0·00; P = 0·047; Table 7) and in males consuming 100–149 % of the IOM recommendation (mean intake: 44·7 g/d; coefficient = −0·14 mg/dl; 95 % CI: −0·32, −0·01; P = 0·031; online Supplementary Table S6).
Characterisation of total cholesterol concentration across dietary fibre intake categories and their associations (n 7008)

Table 4. Long description
The table presents data on total cholesterol levels (mmol/l) across various dietary fiber intake categories, categorized by the Academy of Nutrition and Dietetics and the Institute of Medicine. It includes mean values, 95% confidence intervals (CI), coefficients, and p-values for each category. The table has 8 rows and 7 columns. Column headers are Categorised variables, Mean, 95 % CI, Coeff*, 95 % CI, and P. Row labels include different adequacy percentages (0-49%, 50-99%, 100-149%, and >= 150%) for both the Academy of Nutrition and Dietetics and the Institute of Medicine. Each row provides specific mean values, confidence intervals, coefficients, and p-values for total cholesterol levels. Notable trends include variations in cholesterol levels across different adequacy percentages, with specific coefficients and p-values indicating the statistical significance of these variations.
Fibre intake categories were defined as follows: 0–49 % of adequacy (0–6·9 g/1000 kcal; 0–12·4 g/d in females (F); 0–18·9 g/d in males (M)); 50–99 % (7–13·9 g/1000 kcal; F: 12·5–24·9 g/d; M: 19–37·9 g/d); 100–149 % (14–20·9 g/1000 kcal; F: 25–37·4 g/d; M: 38–56·9 g/d) and ≥ 150 % (≥ 21 g/1000 kcal; F ≥ 37·5 g/d; M ≥ 57 g/d), based on Academy of Nutrition and Dietetics and Institute of Medicine recommendations. CI: confidence interval; REF, reference group for regression; Coeff, regression coefficient. Models adjusted for caloric intake, sex, age, BMI, sedentary activity, smoking and cholesterol-lowering medication. Values in bold mean statistically significant.
Characterisation of total low-density lipoprotein concentration across dietary fibre intake categories and their associations (n 7008)

Table 5. Long description
A table comparing LDL-cholesterol levels across different dietary fiber intake categories. The table has 10 rows and 7 columns. The columns are labeled as Categorised variables, Mean, 95 % CI, Coeff*, 95 % CI, P, and R2. The rows are grouped under two headings: Academy of Nutrition and Dietetics and Institute of Medicine. Each group has four rows representing different percentages of adequacy: 0-49%, 50-99%, 100-149%, and >= 150%. The values in the table include mean LDL-cholesterol levels, 95% confidence intervals, coefficients, and P-values for each category. Notable trends include variations in LDL-cholesterol levels and coefficients across different adequacy percentages.
Fibre intake categories were defined as follows: 0–49 % of adequacy (0–6·9 g/1000 kcal; 0–12·4 g/d in females (F); 0–18·9 g/d in males (M)); 50–99 % (7–13·9 g/1000 kcal; F: 12·5–24·9 g/d; M: 19–37·9 g/d); 100–149 % (14–20·9 g/1000 kcal; F: 25–37·4 g/d; M: 38–56·9 g/d) and ≥ 150 % (≥ 21 g/1000 kcal; F ≥ 37·5 g/d; M ≥ 57 g/d), based on Academy of Nutrition and Dietetics and Institute of Medicine recommendations. CI: confidence interval; REF, reference group for regression; Coeff, regression coefficient. Models adjusted for caloric intake, sex, age, BMI, sedentary activity, smoking and cholesterol-lowering medication. *Indicates statistical significance.
Characterisation of total high-density lipoprotein concentration across dietary fibre intake categories and their associations (n 7008)

Table 6. Long description
The table presents data on HDL-cholesterol levels (mmol/l) across various categories of dietary fibre intake adequacy as per the Academy of Nutrition and Dietetics and the Institute of Medicine. It includes mean values, 95% confidence intervals (CI), coefficients, and P-values for each category. The table is divided into two main sections: one for the Academy of Nutrition and Dietetics and one for the Institute of Medicine. Each section has four rows representing different percentages of adequacy: 0-49%, 50-99%, 100-149%, and >= 150%. For the Academy of Nutrition and Dietetics, the mean HDL-cholesterol levels are 1.37, 1.43, 1.55, and 1.43 mmol/l respectively. The corresponding 95% CI values are 1.34-1.39, 1.40-1.46, 1.48-1.61, and 1.29-1.57. The coefficients are REF, 0.01, 0.03, and -0.01 with P-values of 0.26, 0.547, 0.067, and 0.879 respectively. For the Institute of Medicine, the mean HDL-cholesterol levels are 1.36, 1.44, 1.51, and 1.52 mmol/l respectively. The corresponding 95% CI values are 1.34-1.39, 1.41-1.48, 1.44-1.59, and 1.41-1.62. The coefficients are REF, 0.00, 0.01, and 0.01 with P-values of 0.26, 0.981, 0.484, and 0.806 respectively.
Fibre intake categories were defined as follows: 0–49 % of adequacy (0–6·9 g/1000 kcal; 0–12·4 g/d in females (F); 0–18·9 g/d in males (M)); 50–99 % (7–13·9 g/1000 kcal; F: 12·5–24·9 g/d; M: 19–37·9 g/d); 100–149 % (14–20·9 g/1000 kcal; F: 25–37·4 g/d; M: 38–56·9 g/d) and ≥ 150 % (≥ 21 g/1000 kcal; F ≥ 37·5 g/d; M ≥ 57 g/d), based on Academy of Nutrition and Dietetics and Institute of Medicine recommendations. REF, reference group for regression; Coeff, regression coefficient. Models adjusted for caloric intake, sex, age, alcohol consumption, BMI, sedentary activity, smoking and cholesterol-lowering medication. Values in bold mean statistically significant.
Characterisation of TAG concentration across dietary fibre intake categories and their associations (n 7008)

Table 7. Long description
A table with categorized variables and TAG concentrations. The table has 10 rows and 7 columns. The columns are labeled as Categorised variables, Mean, 95% CI, Coeff*, CI 95%, P, and R2. The rows are grouped under two headings: Academy of Nutrition and Dietetics and Institute of Medicine. Each group has four categories of adequacy: 0-49%, 50-99%, 100-149%, and >= 150%. The values in the table include mean TAG concentrations, 95% confidence intervals, coefficients, and P-values for each category. Notable trends include a significant P-value of 0.047 for the >= 150% adequacy category under the Academy of Nutrition and Dietetics.
Fibre intake categories were defined as follows: 0–49 % of adequacy (0–6·9 g/1000 kcal; 0–12·4 g/d in females (F); 0–18·9 g/d in males (M)); 50–99 % (7–13·9 g/1000 kcal; F: 12·5–24·9 g/d; M: 19–37·9 g/d); 100–149 % (14–20·9 g/1000 kcal; F: 25–37·4 g/d; M: 38–56·9 g/d) and ≥ 150 % (≥ 21 g/1000 kcal; F ≥ 37·5 g/d; M ≥ 57 g/d), based on Academy of Nutrition and Dietetics and Institute of Medicine recommendations. REF, reference group for regression; Coeff, regression coefficient. Models adjusted for caloric intake, sex, age, BMI, sedentary activity, smoking and cholesterol-lowering medication. *Indicates statistical significance.
Discussion
The primary aim of this study was to clarify the effects of varying levels of dietary fibre intake on lipid profile and CRP and consequently its potential impact on cardiovascular risk. Our findings confirm a persistent gap between dietary guidelines and actual consumption in USA adults, with mean intake at only 17·6 g/d, well below both the Academy of Nutrition and Dietetics (AND)(Reference Dahl and Stewart14) and the Institute of Medicine (IOM)(15) recommendations. Importantly, even when fibre intake reached recommended levels, improvements in lipid profile and inflammation were modest, suggesting that current recommendations may underestimate the intake required for optimal cardiometabolic protection.
Notably, higher fibre intake was consistently associated with lower CRP concentrations, with the greatest benefits observed among those consuming ≥ 150 % of the IOM fibre recommendation (≥ 37·5 g/d for women and ≥ 57 g/d for men). The discrepancy between the IOM and AND classifications deserves attention. Associations were more evident under IOM cut-offs, likely because they capture higher absolute fibre intakes than the AND thresholds (e.g. mean 52 g v. 41 g/d at ≥ 150 % of the recommendation). This highlights a key message that the choice of reference framework strongly influences conclusions, and higher intake cut-offs may better reflect the true benefits of fibre.
Our findings are consistent with controlled trials demonstrating benefits of fibre beyond standard recommendations. For example, increasing fibre intake to ∼40 g/d in women and ∼53 g/d in men reduced inflammatory markers including TNF-α and calprotectin in adults with overweight(Reference Deehan, Zhang and Riva22). Consistent with these findings, we recently reported that a diet providing ∼42 g/d of fibre significantly reduced total cholesterol, LDL, CRP and calprotectin concentrations, with effects partly mediated by gut microbiome modulation(Reference Li, Armet and Korpela18). Similarly, plant-based dietary interventions providing > 30 g/1000 kcal markedly reduced CRP and improved lipid profiles(Reference Hall, Guo and Courville23). These observations align with ecological data showing that populations habitually consuming > 45 g/d of fibre exhibit strikingly low rates of inflammation-driven chronic diseases(Reference O’Keefe, Li and Lahti24,Reference Temba, Pecht and Kullaya25) .
The beneficial effects of dietary fibre on lipid metabolism are well established(Reference Fu, Zhang and Qian26). Viscous fibres reduce cholesterol absorption, promote bile acid excretion and increase hepatic LDL receptor activity(Reference Surampudi, Enkhmaa and Anuurad27). Fermentation-derived short-chain fatty acids also inhibit cholesterol synthesis, while slower glucose absorption reduces insulin secretion, indirectly suppressing HMG-CoA reductase activity(Reference Surampudi, Enkhmaa and Anuurad27). In line with these mechanisms, our study found lower LDL and total cholesterol concentrations in males with intakes > 150 % of IOM recommendations (mean intake: 69·8 g of fibre/d). When plotting markers by 10 g increments in fibre intake, we observed a linear decline in CRP with higher fibre consumption, while LDL, TC and TAG concentrations were markedly lower with fibre intake values above 60 g/d of fibre (data not shown).
Despite strong biological plausibility, most individuals fail to achieve even minimal recommendations. Modern diets tend to be low in fibre, partly due to the displacement of fibre-rich foods such as whole grains, legumes, fruits and vegetables by ultra-processed foods, which are typically low in fibre(Reference Gaesser and Angadi28–Reference Li and Heber30). Additionally, perceptions of fibre-rich foods as expensive, unpalatable or difficult to prepare create further barriers(Reference Quagliani and Felt-Gunderson31). Addressing these challenges is critical for public health. Strategies should focus not only on supplementation or fibre fortification but also on improving dietary quality and acceptance of fibre-rich foods(Reference Armet, Deehan and Thöne32–Reference Daoust35).
This study has certain limitations that should be acknowledged. The use of a single 24-h recall underestimates habitual intake variability, and residual confounding from other dietary nutrients (e.g. saturated fat and added sugars) cannot be excluded, potentially leading to overestimation of the observed associations with fibre(Reference Grajeta36–Reference Storey and Anderson38). In addition, fibre-rich foods such as fruits, vegetables, whole grains and legumes are nutrient dense and contain vitamins, minerals and phytochemicals that may independently contribute to lower CRP concentrations and other inflammatory markers, making it difficult to isolate the specific effects of fibre from those of the broader dietary pattern. Higher fibre intake may also reflect co-occurring behavioural and social factors, including reduced consumption of less healthy foods, greater health awareness and other lifestyle characteristics. Although models were adjusted for multiple confounders (energy intake, age, race, alcohol use, BMI, sedentary behaviour, smoking and lipid-lowering medication use), residual confounding may persist. Finally, the relatively small number of participants at very high fibre intakes may have limited statistical power to detect differences involving this category. However, the consistent direction of associations suggests practical relevance and supports the hypothesis that fibre intake above current guidelines is needed to achieve meaningful cardiometabolic improvements.
In conclusion, our findings support the concept that existing fibre recommendations, while protective, may not be sufficient to fully leverage the anti-inflammatory and lipid-lowering benefits of fibre. Intakes greater than current recommendations appear to confer additional benefits. However, increasing fibre intake at the population level remains a major public health challenge. These findings reinforce the need to revisit dietary fibre guidelines and to prioritise public health strategies that both promote higher fibre intake and address structural and behavioural barriers limiting its consumption. Further research exploring the characteristics, motivations and dietary habits of individuals with consistently high fibre intake may help inform more effective public health interventions.
Supplementary material
For supplementary material/s referred to in this article, please visit https://doi.org/10.1017/S0007114526107843
Acknowledgements
A. C. M. J. acknowledges Fundação Coordenação de Aperfeiçoamento de Pessoal de Nível Superior (CAPES) for providing a PhD scholarship.
J. F. M. has been financially supported by the Conselho Nacional de Desenvolvimento Científico e Tecnológico (CNPq; grant no. 310677/2022-0). No specific funding was received for the preparation of this manuscript.
A. C. d. M. J.: Conceptualisation-Equal, Data curation-Equal, Formal analysis-Equal, Investigation-Equal, Methodology-Equal, Validation-Equal, Visualisation-Equal, Writing – original draft-Equal, Writing – review & editing-Equal; R. M. S.: Conceptualisation-Equal, Data curation-Equal, Formal analysis-Lead, Investigation-Equal, Methodology-Equal, Validation-Equal, Visualisation-Equal, Writing – original draft-Equal, Writing – review & editing-Equal; E. M. S.: Formal analysis-Equal, Investigation-Equal, Methodology-Equal, Validation-Equal, Visualisation-Equal, Writing – review & editing-Equal; C. P.: Investigation-Equal, Methodology-Equal, Validation-Equal, Visualisation-Equal, Writing – review & editing-Equal; J. W.: Investigation-Equal, Methodology-Equal, Validation-Equal, Visualisation-Equal, Writing – review & editing-Equal; J. F. M.: Conceptualisation-Equal, Data curation-Equal, Investigation-Equal, Methodology-Equal, Project administration-Equal, Supervision-Equal, Validation-Equal, Visualisation-Equal, Writing – review & editing-Equal.
The authors declare no conflicts of interest.