INTRODUCTION
The measurement of dry matter intake (DMI) is vital to evaluate the nutritional status and expected performance of animals in all production systems (Ferreira et al. Reference Ferreira, Oliván, Rodrigues, Osoro, Dove and Dias-da-Silva2004). Mayes & Lamb (Reference Mayes and Lamb1984) suggested using n-alkanes as indigestible markers to estimate DMI in preference to long-chain fatty acids in plant cuticular wax (Grace & Body Reference Grace and Body1981), because n-alkanes are more chemically inert and easier to analyse. Other markers such as chromium and titanium oxides require total faecal output to predict digestibility in order to estimate DMI. Additionally, Malossini et al. (Reference Mallossini, Bovolenta, Piasentier, Piras and Martilloti1996) pointed out that chromium oxide is an unpleasant material to handle and the recovery is unknown. Dosed n-alkanes have a greater recovery compared to naturally occurring alkanes (Mayes et al. Reference Mayes, Lamb and Colgrove1986), and n-alkane faecal recovery increases with increasing carbon chain length (Mayes et al. Reference Mayes, Lamb and Colgrove1986; Bovolenta et al. Reference Bovolenta, Piasentier, Malossini, Gordon and Rubino1994). The predominant n-alkanes present in forages are odd-chain, and range from C25 to C35. Dove & Mayes (Reference Dove and Mayes2006), in agreement with Mayes et al. (Reference Mayes, Lamb and Colgrove1986) and Bovolenta et al. (Reference Bovolenta, Piasentier, Malossini, Gordon and Rubino1994), pointed out that octacosane (C28) and dotriacontane (C32) can be used as external markers due to their availability and relatively low cost and their low concentration in the forage. Malossini et al. (Reference Mallossini, Bovolenta, Piasentier, Piras and Martilloti1996) concluded that increasing the number of faecal samples per day decreases the error of the methodology and increases precision of estimating DMI. The objectives of the current study were (1) to determine the variation structure within a day and across days when determining forage DMI using C32 and C33n-alkanes; (2) to determine the optimal time for faecal collection to determine forage DMI; and (3) to compare C31 and C33 as markers in computing forage DMI in Brahman bulls grazing Coastal bermudagrass (Cynodon dactylon (L.) Pers.).
MATERIALS AND METHODS
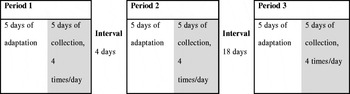
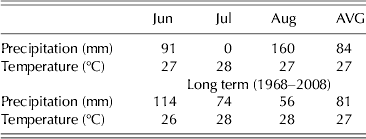
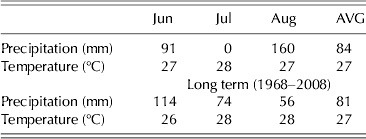
The study was conducted at the Texas AgriLife Research Center in Overton, TX, in humid east Texas (32° 16′N 94° 59′W; 122 m asl), with a monthly average rainfall of 83·6 mm and mean temperature 27·6 °C) during June–August 2008 (Table 1). Sixteen purebred Brahman bulls (average age 18 months) were allocated by weight to four Coastal bermudagrass (C. dactylon (L.) Pers.) pastures at a moderate to low grazing pressure. The bulls had been previously phenotyped for residual feed intake (RFI) and were allotted to the pasture such that half the animals (n = 2) on each pasture were deemed efficient (negative residual) and half (n = 2) were deemed inefficient (positive residual). Animals remained on pasture for 63 days and were weighed at 15-day intervals for average daily gain (ADG) determination. Three intake measurement trials (period 1 (P1); period 2 (P2); and period 3 (P3)) were conducted, with each trial consisting of a 10-day period during which animals received maize gluten (400 g, twice daily) labelled with 200 mg of C32 alkane. P1 and P2 were 4 days apart, and P3 was 18 days after P2 (Fig. 1). The maize gluten was provided individually via Calan gates in the pasture and was fed twice daily at 08.00 and 19.00 h. All animals had been previously trained to use Calan gates and had been habituated to the system for 28 days prior to the start of the first intake measurement period. Forage samples (c. 1 kg) were taken daily during each period, starting 2 days prior to the first faecal collection, by hand-plucking leaves and stem tips at random across each pasture. Forage mass was estimated weekly by cutting four 0·3 × 0·3 m quadrats per pasture. Additional quadrats were cut and separated into live leaf and stem. All forage samples were dried at 60 °C for 72 h; hand-plucked and separated leaf and stem samples were subsequently analysed for alkane concentration.
Design of the experimental periods.

Climatic data at Overton, TX research station for the period of the experiment
Marker preparation
Maize gluten pellets were used as the carrier for the n-alkane. The pellets were initially sieved (2-mm screen) to remove fines and individual doses (400 ± 1 g) were weighed out in sets of 33 and placed in individual containers in an oven at 75 °C for c. 2 h. An alkane solution consisting of 7 g of C32 (Dotriacontane, Aldrich cat # D22, 310-7) in 350 ml heptane was prepared and, using a 30-ml Minipet Pipettor, 10 ml of C32-alkane solution was slowly pipetted over each dose of warm maize gluten. The C32-labelled maize gluten was then set aside in a fume cupboard to allow the heptane to evaporate at room temperature for c. 30 min before the doses were returned to a 75 °C oven for c. 1 h. Individual doses were then placed in paper bags and labelled for each intake period. One dose from each set was taken for alkane analysis.
Feeding and faeces collection procedures
After 1 week of adaptation to maize gluten fed via Calan gate units in each pasture, bulls were individually offered a 400 g dose of C32 labelled maize gluten twice per day (07.00 and 19.00 h) for 10 days in order to reduce diurnal variation, as suggested by Smit et al. (Reference Smit, Taweel, Tas, Tamminga and Elgersma2005). Faecal samples were collected four times daily (07.00, 11.00, 15.00 and 19.00 h) during the last 5 days. Faecal samples were collected immediately upon defecation or via rectal palpation, placed in ziplock bags, and frozen at −20 °C prior to drying at 60 °C for 72 h.
Alkane determination
The n-alkanes in faecal and forage samples were extracted following the protocols described by Dove & Mayes (Reference Dove and Mayes2006). Extracts were analysed by gas chromatography (Agilent 6890N gas chromatograph with auto sampler and flame ionization detector. Agilent, Santa Clara, CA, USA). A 1·0 μl of sample was injected onto a Supelco Special Order SPB-1 fused silica capillary column (30 × 0·75 mm ID × 1·00 μm) in a split ratio of 4·3:1 and washed with heptane, pre- and post-injections. The oven temperature was set at 285 °C and held for 12 min, and the detector heater was set at 320 °C using a gradient run. Initial temperature was set at 210 °C, temperature ramped to 285 °C at 25 °C/min and held for 8 min, then ramped to 310 °C at 25 °C/min and held for 2 min. The injector temperature was set at 300 °C and the detector temperature was set at 320 °C. For each analysis run, five standard samples were included for calibration.
Experimental design
The experiment was designed as double repeated measurements (5 days of faecal collection and four times of faecal collection within a day) in a completely randomized block design with three periods of intake estimation taking place over a 52-day grazing study (Fig. 1). Animals were the experimental units and they were maintained in the same pastures during the different periods to maintain the established hierarchy within a pasture.
Intake calculations
Intake calculations were based on a 24 h passage rate of forage and n-alkanes dosed on maize gluten. According to Dove & Mays (Reference Dove and Mayes1996), the intake of the small amount of supplement feed that carries the alkane can be disregarded in the intake calculation. Generally, forages contain low and variable concentrations of C32, and it was considered of interest to determine the effect of calculating forage DMI with or without an adjustment for forage C32. Therefore, intake calculations were performed as follows:
 $${\rm DMI}= (({\rm Faecal}\;{\rm C}_{31} /({\rm Faecal}\;{\rm C}_{32} -{\rm Forage}\;{\rm C}_{32} ) \times {\rm Dose}\;{\rm value)}/{\rm Forage}\;{\rm C}_{31} )/1000 $$
 $${\rm DMI} = (({\rm Faecal} \;{\rm C}_{33} /({\rm Faecal}\;{\rm C}_{32} -{\rm Forage}\;{\rm C}_{32} ) \times {\rm Dose}\;{\rm value)}/{\rm Forage}\;{\rm C}_{33} )/1000 $$
 $${\rm DMI} = ((({\rm Faecal C}_{{\rm 31}} /{\rm Faecal C}_{{\rm 32}} ) \times {\rm Dose}\;{\rm value)/Forage}\;{\rm C}_{{\rm 31}} )/{\rm 1}000$$
 $${\rm DMI} = ((({\rm Faecal C}_{{\rm 33}} /{\rm Faecal C}_{{\rm 32}} ) \times {\rm Dose}\;{\rm value)/Forage}\;{\rm C}_{{\rm 33}} )/{\rm 1}000$$
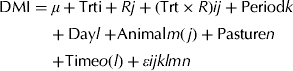
Equations (1) and (2) account for the C32 in the forage, while Eqns (3) and (4) assumed that C32 was negligible and is, therefore, not accounted for in the forage intake equation. Comparisons of the four intake equations were made as follows: C31 with adjustment for C32 (TrtA), C33 with adjustment for C32 (TrtB), C31 without adjustment for C32 (TrtC), C33 without adjustment for C32 (TrtD), the average between TrtA and TrtB (TrtE), and the average between TrtC and TrtD (TrtF). Then, 0·8 kg/day of maize gluten DMI was added to the forage DMI estimates of these treatments and the newly estimated DMI (forage + maize gluten) compared with the DMI predicted by the NRC (1984) equation. The following statistical model was used:
 $${\rm DMI} =\mu + {\rm Trti} + Rj + ({\rm Trt} \times R)ij + {\rm Period}k + {\rm Day}l +\!{\rm Animal}m(\,j) + {\rm Pasture}n +\! {\rm Time}o(l) + \varepsilon ijklmn$$
where μ is the overall mean, Trt is the fixed effect of the intake equation, R is the fixed effect of the RFI group, Period is the random effect of the period, Day is the fixed effect of the day of collection, Animal is the random animal effect associated with RFI, Pasture is the random effect of pasture, Time is the fixed effect of faecal collection within a day and ε is the identical, independent and normally distributed random error with N ∼ (0, σ 2).
Evaluation of times and combinations of faecal collections
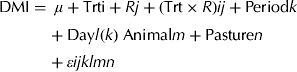
Times of faecal collections and some combinations were coded as treatments within periods, animal and pasture. Days of collections were assumed to be replicates. The following treatments were evaluated: 07.00 h (Trt1), 11.00 h (Trt2), 15.00 h (Trt3), 19.00 h (Trt4), average Trt1 and Trt2 (Trt5), average Trt1 and Trt3 (Trt6), average Trt1 and Trt4 (Trt7), average Trt2 and Trt3 (Trt8), average Trt2 and Trt4 (Trt9), average Trt3 and Trt4 (Trt10) and the average of 4 times daily (Trt11). This analysis was performed for C31 and C33 with and without adjustment for C32 concentration in the forage. The following statistical model was used:
 $${\rm DMI} = \; \mu + {\rm Trti} + Rj + ({\rm Trt} \times R)ij + {\rm Period}k \enspace +{\rm Day}l(k)\;{\rm Animal}m + {\rm Pasture}n + \varepsilon ijklmn $$
where μ is the overall mean, Trt is the fixed effect of the time of faecal collection within a day, R is the fixed effect of the RFI group, Period is the random effect of the period, Day is the fixed effect of the day of collection, Animal is the random animal effect associated with RFI, Pasture is the random effect of pasture and ε is the identical, independent and normally distributed random error with N ∼ (0, σ 2).
Variance–(co)variance analyses
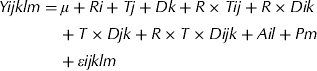
Two statistical analysis procedures were performed to understand the variance and (co)variance (var–(co)var) structure of days and times of collection for both C31 and C33 with and without adjustments for C32 across periods. The first statistical model was performed for each period independently, as follows:
 $$Yijklm = \mu + Ri + Tj + Dk + R \times Tij + R \times Dik + T \times Djk + R \times T \times Dijk + Ail + Pm + \varepsilon ijklm $$
where Y is the observed variable, μ is the overall mean, R is the fixed effect of the RFI group, T is the fixed effect of the time of faecal collection within a day, D is the fixed effect of the day of collection, A is the random animal effect associated with RFI, P is the random effect of pasture and ε is the identical, independent and normally distributed random error with N ∼ (0, σ 2). The second statistical model was performed with all periods together as shown below:
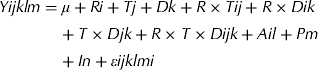 $$Yijklm = \mu + Ri + Tj + Dk + R \times Tij + R \times Dik + T \times Djk + R \times T \times Dijk + Ail + Pm + In + \varepsilon ijklmi $$
where Y is the observed variable, μ is the overall mean, R is the fixed effect of the RFI group, T is the fixed effect of the time of faecal collection within a day, D is the fixed effect of the day of collection, A is the random animal effect associated with RFI, P is the random effect of pasture, I is the random effect of period and ε is the identical, independent and normally distributed random error with N ∼ (0, σ 2).
All statistical analyses were performed using PROC REG for regression or PROC MIXED for variance (SAS 2002) and the goodness-of-fit for estimation of forage DMI was assessed with the −2 × log and the Akaike's Information Criteria (AIC) statistics. Since two levels of repeated measures were evaluated (days and times of collection), the var–(co)var structure for un and un (unstructured and unstructured) and un and ar(1) (unstructured and autoregressive first degree) were used. The calculation of var–(co)var assuming un and ar(1) structure (Gao et al. Reference Gao, Thompson, Xiong and Miller2006) is shown in the following example that shows the scheme of var–(co)var for 2 and 3 levels, respectively, for factors 1 and 2.
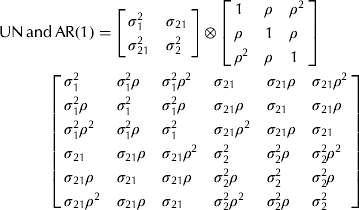 $$\eqalign{\openup6& {\rm UN}\,{\rm and}\,{\rm AR}(1) = \left[ {\matrix{ {\sigma _1^2} \hfill & {\sigma _{21}} \hfill \cr {\sigma _{21}^2} \hfill & {\sigma _2^2} \hfill \cr}} \right] \otimes \left[ {\matrix{ 1 \hfill & \rho \hfill & {\rho ^2} \hfill \cr \rho \hfill & 1 \hfill & \rho \hfill \cr {\rho ^2} \hfill & \rho \hfill & 1 \hfill \cr}} \right] \cr &\hskip32pt \left[ {\matrix{ {\sigma _1^2} \hfill & {\sigma _1^2 \rho} \hfill & {\sigma _1^2 \rho ^2} \hfill & {\sigma _{21}} \hfill & {\sigma _{21} \rho} \hfill & {\sigma _{21} \rho ^2} \hfill \cr {\sigma _1^2 \rho} \hfill & {\sigma _1^2} \hfill & {\sigma _1^2 \rho} \hfill & {\sigma _{21} \rho} \hfill & {\sigma _{21}} \hfill & {\sigma _{21} \rho} \hfill \cr {\sigma _1^2 \rho ^2} \hfill & {\sigma _1^2 \rho} \hfill & {\sigma _1^2} \hfill & {\sigma _{21} \rho ^2} \hfill & {\sigma _{21} \rho} \hfill & {\sigma _{21}} \hfill \cr {\sigma _{21}} \hfill & {\sigma _{21} \rho} \hfill & {\sigma _{21} \rho ^2} \hfill & {\sigma _2^2} \hfill & {\sigma _2^2 \rho} \hfill & {\sigma _2^2 \rho ^2} \hfill \cr {\sigma _{21} \rho} \hfill & {\sigma _{21}} \hfill & {\sigma _{21} \rho} \hfill & {\sigma _2^2 \rho} \hfill & {\sigma _2^2} \hfill & {\sigma _2^2 \rho} \hfill \cr {\sigma _{21} \rho ^2} \hfill & {\sigma _{21} \rho} \hfill & {\sigma _{21}} \hfill & {\sigma _2^2 \rho ^2} \hfill & {\sigma _2^2 \rho} \hfill & {\sigma _2^2} \hfill \cr}} \right]} $$
Therefore, the var–(co)var structure for the ar(1) factor depends on the un var–(co)var values to compute the final variance for each level combination of both repeated measures. When un and un or un and ar(1) structures are used, the individual un and ar(1) matrices will be shown.
RESULTS
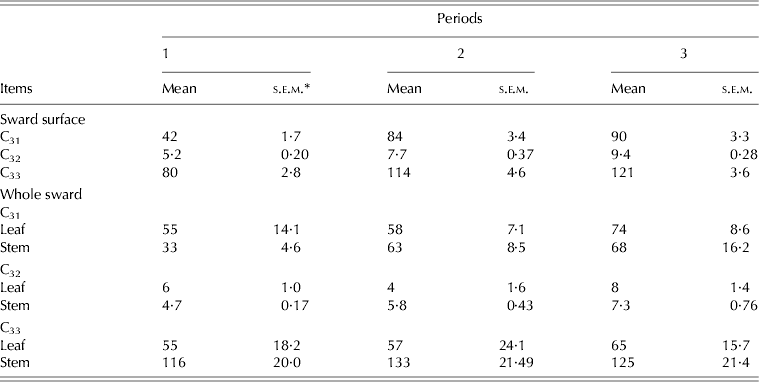
Rainfall and temperature variations during the study are provided in Table 1. Forage mass increased over the course of the study; increasing from 5794 ± 1015 kg DM/ha in early July to 7043 ± 699 kg DM/ha in late July and 7572 ± 973 kg DM/ha in the mid-August. The average concentration of C31, C32 and C33 in the daily hand-plucked forage samples, together with the separated leaf and stem values, are shown in Table 2. There were low concentrations of C32 in the leaf and stem during all periods (Table 2). Leaf concentrations of C31 and C33 were relatively similar, and leaf and stem concentrations of C31 were also similar (Table 2); however, leaf and stem concentrations of C33 differed markedly (P < 0·001).
Concentration (mg/kg DM) of n-alkanes present in hand-plucked samples from the sward surface and in leaf and stem of Coastal bermudagrass cut from the whole sward
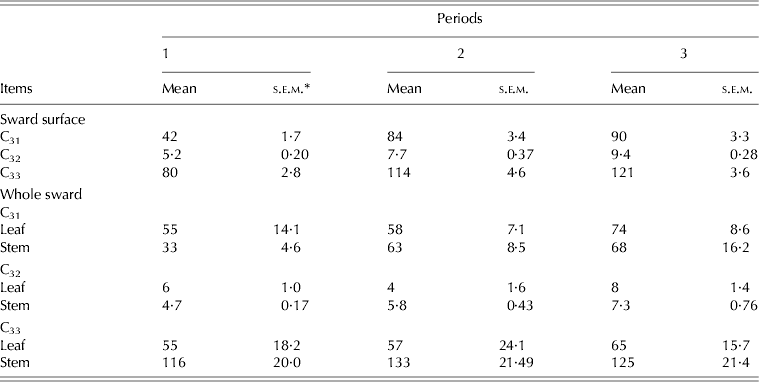
* Period 1, d.f. = 7; Periods 2 and 3, d.f. = 9.
Regression analysis of the ratio of faecal C31 to faecal C32 and faecal C33 to faecal C32 over time (within and across days of the collection periods) indicated no temporal relationships (P = 0·277 and 0·210, respectively). Faecal concentrations of C31, C32 and C33 in P1 did not differ significantly (P > 0·05, 110·2 ± 17·9, 126·7 ± 23·6 and 113·5 ± 24·0 mg/kg DM, respectively). However, the concentration of C32 relative to C31 and C33 was less in P2 (107·4 ± 25·9 v. 189·9 ± 34·1 and 174·9 ± 32·0 mg/kg DM, respectively) and in P3 (75·5 ± 12·5 v. 116·5 ± 26·2 and 123·2 ± 31·5 mg/kg DM, respectively) and for the average for all periods (103·4 ± 30·1 v. 139·1 ± 45·1 and 137·7 ± 39·9 mg/kg DM, respectively). Berry et al. (Reference Berry, Scheeder, Sutter, Krober and Kreuzer2000) reported that faecal concentrations were similar for C33 and C32 but less for C31.
Evaluation of times of faecal collection
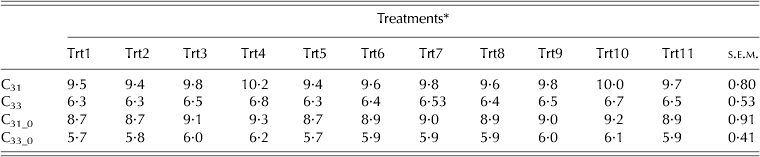
The relationships between forage DMI estimates based on different times of faecal sampling are shown in Table 3. Faecal samples collected in the morning (07.00 and 11.00 h, TRT5) provided lower (P < 0·05) estimates of forage DMI than samples collected in the afternoon (15.00 and 19.00 h, TRT10). There was a difference between Trt5 and Trt10 for forage DMI estimated by Eqn (1) (P=0·001), Eqn (2) (P < 0·001), Eqn (3) (P=0·001) and Eqn (4) (P<0·001) (Table 3). There was no significant difference (P>0·05) of estimated forage DMI for all methods between Trt7 and Trt11.
Predicted DMI (kg DM) with different n-alkane methods and different times of faecal collections
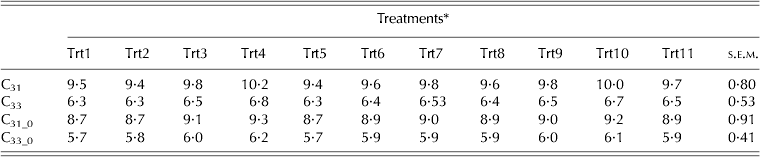
* Using the data from 07.00 h (Trt1), 11.00 h (Trt2), 15.00 h (Trt3) or 19.00 h (Trt4) or averaging Trt1 and Trt2 (Trt5), Trt1 and Trt3 (Trt6), Trt1 and Trt4 (Trt7), Trt2 and Trt3 (Trt8), Trt2 and Trt4 (Trt9), Trt3 and Trt4 (Trt10) or average of 4 times daily (Trt11). d.f. = 2337.
Comparison of n-alkane methods and their combinations to determine forage DMI
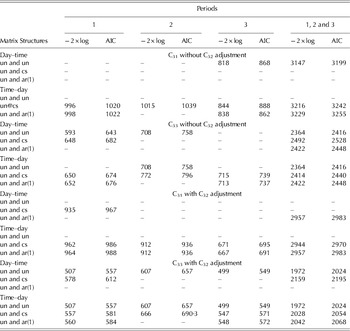
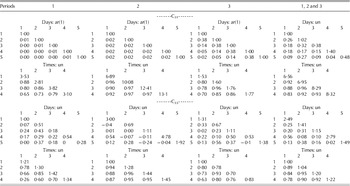
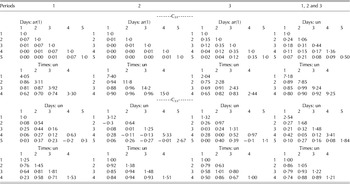
Tables 3 and 4 show the var–(co)var structures and values of forage DMI for individual and combined periods of collections. When forage DMI was estimated (Table 3) using C31 without adjustment for C32 (Eqn (3)) a first-order autoregressive var–(co)var structure was observed for days of collection and an unstructured var–(co)var was observed for times of collection. For C33 unadjusted for C32 (Table 4), the var–(co)var was unstructured for days and times of collection. A similar outcome was observed when forage DMI was estimated (Table 5) either using C31 or C33 with adjustment for C32 (Eqns 1 and 2). A first-order autoregressive var–(co)var indicated a small correlation as the levels were further apart from each other, but with the same variance. In the case of unstructured var–(co)var, variance and correlation among levels of a factor (e.g. days of collection) may change without a defined pattern. Even though the variances in forage DMI using C31 without adjustment for C32 (Table 4) were similar across days, the correlation among different days of collection was either very low or zero, suggesting that days of collection yielded completely different estimates of forage DMI and therefore several days of collection were necessary to accurately estimate forage DMI. A similar outcome was obtained when forage DMI was computed with adjustments for C32 content of the forage. However, estimates of forage DMI across times of collection were moderately to highly correlated for all periods regardless of adjustments for C32 (Tables 4 and 5), and they tended to decrease with time. Without adjustment for C32 content (Table 5), correlation varied from 0·65 to 0·97 for C31 and 0·26 to 0·96 for C33, but a smaller variance was observed for estimates of forage DMI using C33 (0·70 to 1·30) than C31 (1·53 to 12·41; Table 5). Similar results were found when C32 was used to adjust the estimated forage DMI. P3 had the least variance for all times of collection compared to P1 and P2 (Tables 4 and 5). When all periods were analysed together, unstructured var–(co)var was the best fit for both days and times of faecal collection in determining forage DMI (Tables 5 and 6). Similar to the individual periods, estimates of forage DMI either using C31 or C33 had low correlations between days of collection (Table 5) and the variance varied from 0·38 to 1·40 kg2/day2. Adjusting for C32 did not improve the variance–correlation matrix values either (Table 6). The variance of forage DMI estimation tended to be greater with C33 than with C31 regardless of the adjustment with C32 (Tables 4 and 5). These results were in agreement with the individual analysis of periods in which C31 yields small variance than C33, and suggest that at least 5 days were needed to estimate forage DMI accurately due to low correlation between days of collection.
Selection of the best variance–(co)variance matrix structure with two levels of repeated measured variables (time and day) and two sequences (time–day and day–time) for individual or combined periods 1, 2 and 3, using C31 and C33 with and without adjustments for C32

Variance (diagonal) and correlation matrices for selected days (D) and times (T) of faecal collection to estimate DMI using C31 and C33 without adjustments for C32 for individual and combined periods 1, 2 and 3*

* ar(1) and un are first-order autoregressive and unstructured variance and (co)variance structures, respectively. Times 1, 2, 3 and 4 are faecal collections at 07.00, 11.00, 15.00 and 19.00 h, respectively, within a day. These are symmetrical matrices; therefore, the top values are identical to the values shown in the bottom part within a matrix.
Variance (diagonal) and correlation matrices for selected days (D) and times (T) of faecal collection to estimate DMI using C31 and C33 with adjustments for C32 for individual and combined periods 1, 2 and 3*

* ar(1) and un are first-order autoregressive and unstructured variance and (co)variance structures, respectively. Times 1, 2, 3 and 4 are faecal collections at 07.00, 11.00, 15.00 and 19.00 h, respectively, within a day. These are symmetrical matrices; therefore, the top values are identical to the values shown in the bottom part within a matrix.
DISCUSSION
According to Oliveira & Salatino (Reference Oliveira and Salatino2000), n-alkane concentrations in the forage may be influenced by high light, low air humidity and high temperatures. These environmental factors may have impacted the concentrations of C31, C32 and C33 of bermudagrass samples during the summer months of July–August, but it may also reflect the inherent differences between Coastal bermudagrass and other grass species. The concentrations of all three alkanes (C31, C32 and C33) increased over time, and a change in alkane concentrations in several pasture species over time was recently reported by Tanner et al. (Reference Tanner, Blevins, Green, Mayes and Lewis2010). Smit et al. (Reference Smit, Taweel, Tas, Tamminga and Elgersma2005) pointed out that a change in concentration of C32 can increase the estimation of DMI, and that it might be necessary to increase the amount of C32 dosed; however, Smit et al. (Reference Smit, Taweel, Tas, Tamminga and Elgersma2005) were dealing with C32 concentrations markedly greater (700–800 mg/day) than the concentrations of C32 found in the current study (400 mg/day). Concentrations of both C31 and C33 were low relative to concentrations reported by Mayes et al. (Reference Mayes, Lamb and Colgrove1986) and Smit et al. (Reference Smit, Taweel, Tas, Tamminga and Elgersma2005) in fresh perennial ryegrass (Lolium perenne L.), alfalfa (Medicago sativa L.) hay (Oliván et al. Reference Oliván, Ferreira, Celaya and Osoro2007), fresh stargrass (Cynodon nlemfüensis Vanderyst) (Oliveira & Salatino Reference Oliveira and Salatino2000) and several tropical grasses (Laredo et al. Reference Laredo, Simpson, Minson and Orpin1991). Even though Laredo et al. (Reference Laredo, Simpson, Minson and Orpin1991) postulated that some tropical forages containing less than 50 mg/kg may have insufficient C33 alkane to estimate DMI using the double alkane technique, the current results indicated that concentrations of alkanes below 50 mg/kg can be used to estimate forage DMI. Valiente et al. (Reference Valiente, Delgado, De Vega and Guada2003) rejected the idea that a minimum of 50 mg/kg DM was required to have a precise analysis, and found no differences in estimated DMI, diet composition or digestibility when using the mixed concentrate and forage diets with alkane concentrations less than 50 mg/kg DM. This suggestion of a lower limit may have resulted from the fact that Laredo et al. (Reference Laredo, Simpson, Minson and Orpin1991) were using an earlier generation of laboratory procedures and equipment than those used today. Faecal concentrations of C31, C32 and C33 in P1 did not differ significantly (P > 0·05). This is in agreement with Dove et al. (Reference Dove, Mayes, Lamb and Ellis2002), working with controlled-release capsules, who reported no significant differences between C31 and C32 recovery in faecal samples. Other researchers (Hendricksen et al. Reference Hendricksen, Reich, Roberton, Reid, Gazzola, Rideout and Hill2002; Oliván et al. Reference Oliván, Ferreira, Celaya and Osoro2007) have reported greater faecal concentrations for dosed alkanes. The greater faecal concentrations for C32 may be the result of the association of the liquid phase of the digesta with the dosed alkanes, whereas the natural alkane associates with the solid part of the digesta (Mayes et al. Reference Mayes, Lamb and Colgrove1986). However, the concentration of C32 relative to C31 and C33 was less in P2.
Malossini et al. (Reference Malossini, Bovolenta, Piasentier and Valentinotti1994) reported no significant difference between one faecal sample a day, two, three or four or a composite sample (four samples during the day) to estimate DMI in dairy cows grazing cool season forages (red fescue (Fesca rubra L.) and orchard grass (Dactylis glomerata L.), predominantly), and concluded that, in order to decrease labour and time, one or two samples a day was adequate to obtain reliable values of estimated DMI. Mann & Stewart (Reference Mann and Stewart2003) reported a significant difference (P<0·05) in estimated DMI between morning and afternoon (8 h interval), in which the morning estimated DMI was underestimated and the afternoon estimated DMI was overestimated compared to actual DMI in yearling bulls fed with kikuyu grass (Pennisetum clandestinum Hochst.) in Calan gates and dosed daily with C32. Mann & Stewart (Reference Mann and Stewart2003) reported that this difference could be eliminated if they had dosed animals twice daily. In the current study, marked maize gluten was fed twice daily. One important factor is the time of collection, due to differences in the forage consumed in the morning and in the afternoon. Several authors have reported that animals tend to eat more during the afternoon due to increase in non-structural carbohydrate (Fisher et al. Reference Fisher, Mayland and Burns1999; MacKay et al. Reference MacKay, Mayland and MacKay2003), and decrease in fibre components (Mayland & Shewmaker Reference Mayland and Shewmaker1999), consequently increasing the nutritive value of the forage. Berry et al. (Reference Berry, Scheeder, Sutter, Krober and Kreuzer2000) collected faecal samples three times a day (06.30, 13.30 and 20.30 h) from Brown Swiss cows, and concluded that the best time was at 06·30 h using C33/C32 pairs of alkanes; however, they found no significant difference between times of collections but the variation for the 06.30 h collection was less compared to other times of collection. Hameleers & Mayes (Reference Hameleers and Mayes1998) found no significant difference in estimated DMI of dairy cows grazing perennial ryegrass (L. perenne L.) and white clover (Trifolium repens L.) when faecal samples were collected twice a day (am and pm). Mayes et al. (Reference Mayes, Lamb and Colgrove1986) found no variation between times of collection or between days, which is in agreement with Oliván et al. (Reference Oliván, Ferreira, Celaya and Osoro2007), who collected faecal samples three times a day (08.30, 16.30 and 00.30 h) and concluded that one sample a day was enough to estimate DMI. In addition, Reeves et al. (Reference Reeves, Fulkerson, Kellaway and Dove1996) reported no difference in DMI between morning and afternoon estimation of DMI for dairy cows grazing kikuyu grass. Keli et al. (Reference Keli, Andueza, de Vega and Guada2008) reported that sampling once a day was enough to estimate DMI in ewes grazing alfalfa (M. sativa L.) and Wimmera ryegrass (Lolium rigidum Gaudin) treated with C32 and C36 in paper pellets. There are different conclusions between different studies, although the main differences are in the form in which the n-alkanes are dosed and the number of times a day they are dosed. In the current study, in conclusion faecal samples have to be collected twice daily for the most accurate estimation of forage DMI. Fewer collections within a day may be adequate to estimate forage DMI, such as at 07.00 and 19.00 h. The estimates of forage DMI using C33 for times of collection within days had less variance than C31, but there was indication that C31 had the least variance across days of collection. Mayes et al. (Reference Mayes, Lamb and Colgrove1986) stated that, if the variation between morning and afternoon DMI estimation were less than 5%, one collection per day was enough to estimate DMI. Otherwise, at least two collections within a day were needed to have a reasonable value for DMI. Ferreira et al. (Reference Ferreira, Oliván, Rodrigues, Osoro, Dove and Dias-da-Silva2004), working with non-lactating cows fed hay twice daily and dosed with controlled-release capsules containing n-alkane releasing 317·2 mg/day of C32, found no difference in intake when faecal sampling occurred at 08.00 and 20.00 h. Oliván et al. (Reference Oliván, Ferreira, Celaya and Osoro2007), working with beef cattle dosed once a day with paper pellets containing C24, C32 and C36, and collecting faecal samples 3 times a day with 8 h intervals, concluded that one sample per day, with a 24 h interval, was sufficient to estimate DMI. These results support the current conclusions of high correlation across times of collection within a day in which one or two collections within a day are needed to estimate forage DMI. The least variable time of collection in the current study was at 07.00 h for both C31 and C33, regardless of the adjustment for C32. This can be explained by the grazing behaviour of the animals, which usually grazed early in the morning (before 07.00 h) and in the evening (after 19.00 h). Mann & Stewart (Reference Mann and Stewart2003), working with yearling bulls (Hereford and Holstein–Friesland), determined DMI using daily cut kikuyu grass (P. clandestinum Hochst.) in Calan gates, and reported a difference of 18% in DMI between morning and afternoon collections. The morning collection underestimated DMI and the afternoon collection overestimated DMI. Mann & Stewart (Reference Mann and Stewart2003)indicated that one reason for this variation was probably because animals were dosed once a day. This variation may have been avoided if animals were dosed twice a day (a 12 h period interval) to maintain a constant flow through the digestive tract (Mann & Stewart Reference Mann and Stewart2003). Originally, Mayes et al. (Reference Mayes, Lamb and Colgrove1986) suggested that dosing animals once a day should be sufficient to estimate DMI.
Ferreira et al. (Reference Ferreira, Oliván, Rodrigues, Osoro, Dove and Dias-da-Silva2004) found no significant difference between DMI estimated with C31/C32 and C33/C32 pairs, and both values overestimated the actual DMI in Holstein–Friesian cows and indigenous Barrosa breed grazing perennial ryegrass, velvetgrass (Holcus lanatus L.) and Bromus sp. dosed with C32 in controlled-release capsules. In contrast, Smit et al. (Reference Smit, Taweel, Tas, Tamminga and Elgersma2005) reported a variation in DMI of dairy cows grazing perennial ryegrass using C31/C32 and C33/C32 pairs: in their study, over two consecutive years, C31/C32 estimated greater DMI than C33/C32, although C33/C32 had the least variation. They also concluded that both pairs of alkane over-estimated DMI compared with the energy requirements of the animals. Lambs dosed with C32 in capsules, consuming L. perenne, Poa and Festuca hay had similar values of estimated DMI with C33/C32 and C31/C32 compared to actual DMI, and no difference was found when the average of both methods was used (Vulich et al. Reference Vulich, Hanrahan and Crowley1995).
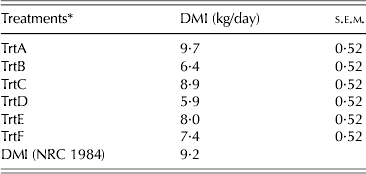
Using the DMI equation of the NRC (1984), the average estimated DMI for bulls grazing bermudagrass was 9·21 kg/day (Table 7). When this number was compared with the average of forage + maize gluten DMI estimated by C31, C33 and C31 and C33 unadjusted for C32, the estimated DMI using C31 with and without adjustment for C32 over-estimated DMI predicted by the NRC (1984) equation. The remaining treatment combinations underestimated DMI compared to the NRC (1984). Herd et al. (Reference Herd, Richardson, Hegarty, Woodgate, Archer and Arthur1998) reported a better estimation of DMI when the average of C31 and C33 faecal values were used to estimate DMI of Angus cows grazing oats (Avena sativa L.). Herd et al. (Reference Herd, Richardson, Hegarty, Woodgate, Archer and Arthur1998) reported a similar value to the DMI predicted by SCA (1990) in this particular situation. This is similar to the current findings in which TrtE (average DMI using C31 and C33 without adjustments for C32) was closer to the DMI predicted by the NRC (1984).
Comparison of predicted DMI using different n-alkane methods and their combinations with the equation proposed by the NRC (1984)
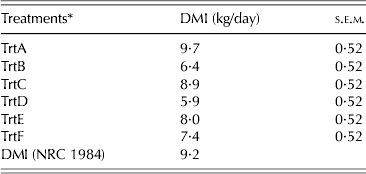
* C31 with adjustment for C32 (TrtA), C33 with adjustment for C32 (TrtB), C31 without adjustment for C32 (TrtC), C33 without adjustment for C32 (TrtD), average between TrtA and TrtB (TrtE) and average between TrtC and TrtD (TrtF). d.f. = 5677.
CONCLUSIONS
The best times to collect faecal samples in order to estimate accurately the DMI of Brahman bulls grazing Coastal bermudagrass were early in the day and late in the evening (e.g. 07.00 and 19.00 h), and multiple days of faecal sampling were necessary to obtain values with the lowest variation. Thus, it is recommended that faecal collections be made over at least five consecutive days. DMI using the C33/C32 pair had the lowest variation compared to the C31/C32 pair but tended to under estimate DMI relative to the NRC predicted intake. Without adjustments for C32 the variation decreases; however, it is important to use C32 values to estimate DMI due to the increasing concentration of C32 in Coastal bermudagrass as the growing season progresses.