Introduction
Catalytic electrodes in fuel cells are typically made from platinum, which is rare in the earth’s crust. The scarcity is the main reason for the high and fluctuating price of platinum and prevents the wide application of fuel cells. The performance of fuel cells is often governed by the oxygen-reduction reaction (ORR) at an air electrode [Reference Stephens, Bondarenko, Grønbjerg, Rossemeisl and Chorkendorff1]. Thus, various studies on the optimization of catalytic platinum electrodes have been conducted [Reference Stephens, Bondarenko, Grønbjerg, Rossemeisl and Chorkendorff1, Reference Wikander, Ekström, Palmqvist and Lindbergh2, Reference Chattot, Bacq, Beermann, Kühl, Herranz, Henning, Kühn, Asset, Guétaz, Renou, Drnec, Bordet, Pasturel, Eychmüller, Schmidt, Strasser, Dubau and Maillard3].
Another effort is the substitution of platinum by other elements. Palladium is one possible element for the substitution because the electronic structure of palladium is similar to that of platinum, which is clearly understood from the periodic table. From the viewpoint of surface area, nanostructuring of palladium is a key strategy for the efficient production of the air electrode. However, it has been found that the catalytic properties of palladium for ORR are much lower than those of platinum [Reference Jung, Beak, Nahm and Kim4]. For this reason, many studies have been carried out to achieve a better catalytic performance of palladium than platinum by efforts such as nanoparticle formation [Reference Liu, Mu, Duan, Chen and Zhang5] and alloying [Reference Neergat, Gunasekar and Rahul6].
Nanoporous metal synthesis, by dealloying or selective dissolution of one element from a binary alloy, has been developed after a report in 2001 [Reference Erlebacher, Aziz, Karma, Dimitrov and Sieradzki7] and is now another technology for nanostructuring. Dealloying can create three-dimensional nanoporous structures in various metals, which generate pores and ligaments in the nanometer-size range [Reference Forty8, Reference Pugh, Dursun and Corcoran9]. It is well-known that nanoporous Raney copper can be synthesized by dealloying Cu–Al alloys in alkaline solutions [Reference Kong, Ma, Zhang, Sun, Chen and Liu10]. Nanoporous copper (NP-Cu) can also be produced by dealloying ductile Cu–Mn alloys [Reference Keir and Pryor11, Reference Min and Li12, Reference Hayes, Hodge, Biener, Hamza and Sieradzki13]. Manganese is easy to dissolve even in neutral solution [Reference Hakamada and Mabuchi14]; thus, the precursor Cu–Mn alloys may be favorable for efficient production of NP-Cu.
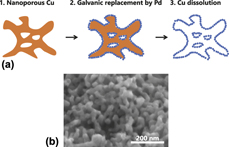
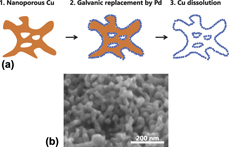
Noble metals, including palladium, can be deposited in the form of a dense film or fine particles on copper by electroless plating or galvanic replacement [Reference Liu, Geng, Xu and Qiu15, Reference Rezaei, Havakeshian and Ensafi16, Reference Raoof, Hosseini, Ojani and Aghajani17]. Thus, nanoporous palladium with a skeletal structure replicated from NP-Cu can be produced by electroless plating of palladium on NP-Cu. The supporting NP-Cu can be removed readily by HNO3 which dissolves copper selectively and leaves bimodal nanoporous platinum with residual copper (BNP-PdCu) (Fig. 1). In addition, the distribution of lattice spacing from surface to core is significantly varied in nanostructured materials including nanoporous metals [Reference Hakamada, Nakano, Furukawa, Takahashi and Mabuchi18, Reference Mahr, Müller-Caspary, Graf, Lackmann, Grieb, Schowalter, Krause, Mehrtens, Wittstock, Weissmüller and Rosenauer19], causing peculiar surface chemistry [Reference Hakamada, Nakano, Furukawa, Takahashi and Mabuchi18, Reference Hakamada, Hirashima and Mabuchi20, Reference Miyazawa, Hakamada and Mabuchi21, Reference Fujita, Guan, McKeena, Lang, Hirata, Zhang, Tokunaga, Arai, Yamamoto, Tanaka, Ishikawa, Asao, Yamamoto, Erlebacher and Chen22]. In this study, BNP-PdCu for ORR catalysts was fabricated by electroless plating of palladium on the sacrificial NP-Cu and subsequent dissolution of NP-Cu. We focus on high ORR activity per surface area of fabricated BNP-PdCu catalysts, using first-principles calculations on the adsorption of oxygen species on palladium surfaces.
(a) Schematic illustration of synthesis of bimodal nanoporous PdCu using nanoporous copper as a sacrificial support. (b) Scanning electron microscopy image of nanoporous copper fabricated by dealloying of Cu–Mn alloy.

Results
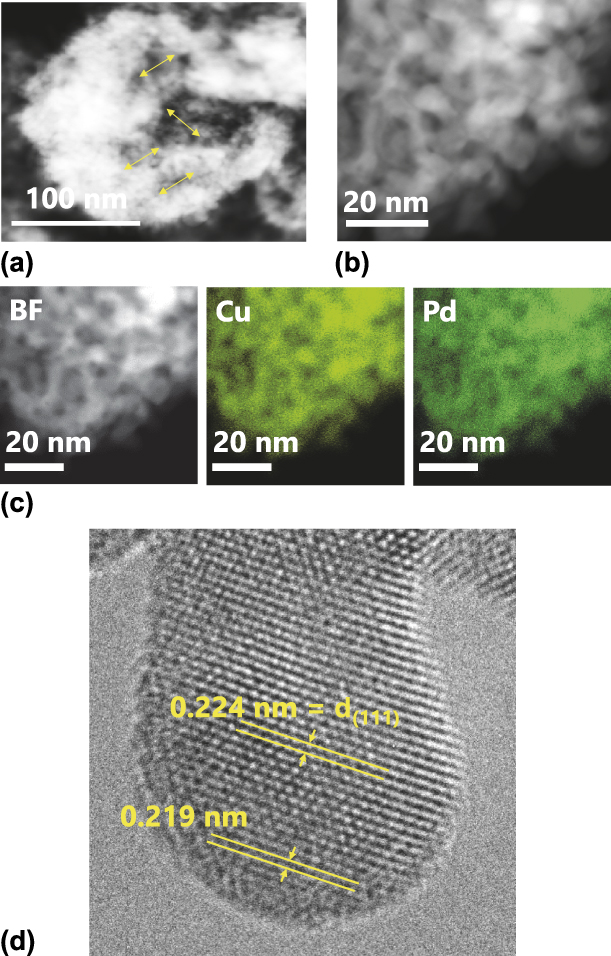
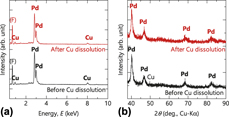
Scanning transmission electron microscopy (STEM) images (Fig. 2) indicated the bimodal structure of the BNP-PdCu after dissolution of copper. The nanoporous hollow structure with an average pore diameter of 23 nm [Fig. 2(a)], which is replicated from NP-Cu [Fig. 1(b)], was composed of finer Pd aggregates with 5–10-nm diameter [Fig. 2(b)], forming the bimodal nanoporous structure. STEM-EDXS revealed that Cu remained even after dissolution by HNO3, although Cu and Pd exhibited a homogenous distribution without surface segregation [Fig. 2(c)]. High-resolution transmission electron microscopy (HR-TEM) observation [Fig. 2(d)] showed significant local lattice contraction at ligament surfaces. The remaining Cu in the sample after dissolution by HNO3 was confirmed by energy-dispersive X-ray spectroscopy (EDXS) [Fig. 3(a)], where the atomic ratio of Cu/Pd was 0.25 before dissolution and 0.15 after dissolution. On the other hand, manganese was not detected by EDXS and inductively coupled plasma atomic emission spectroscopy (ICP-AES) in BNP-PdCu before and after the dissolution of copper. Thus, the contribution of manganese was eliminated in the following discussion on the catalytic properties of the BNP-PdCu samples.
STEM images of bimodal nanoporous PdCu. (a, b) and left panel in (c) are high-angle annular dark-field images, and the center and right panels in (c) show the elemental mapping by energy-dispersive X-ray spectroscopy. Arrows in (a) shows diameters of replicated pores from nanoporous copper. (d) HR-TEM image of bimodal nanoporous PdCu, showing surface lattice contraction.

(a) EDXS results and (b) XRD patterns of bimodal nanoporous PdCu before and after copper dissolution.

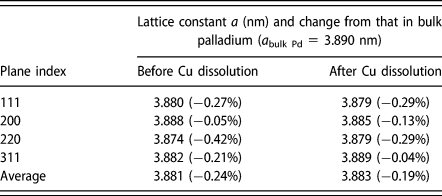
X-ray diffraction (XRD) patterns of BNP-PdCu before and after copper dissolution are shown in Fig. 3(b). Before copper dissolution, the broad peaks for palladium were detected with minor peaks for metallic copper. The absence of copper peaks in the XRD pattern even before dissolution of copper suggested that a considerable amount of copper was removed at the stage of the displacement deposition of palladium. Comparison of the present Cu/Pd composition ratio with the case of Cu/Pt [Reference Hakamada, Sato and Mabuchi23] also suggested the removal of copper during the displacement deposition of palladium. The broad peaks for palladium were detected whereas no copper was detected by XRD after dissolution by HNO3. Pd remained undissolved after immersion in HNO3 for removal of skeletal Cu. An inspection of the XRD patterns showed no significant peak shift of Pd (Table I), compared with the case of Cu/Pt [Reference Hakamada, Sato and Mabuchi23].
Lattice constants of palladium in bimodal nanoporous palladium–copper.

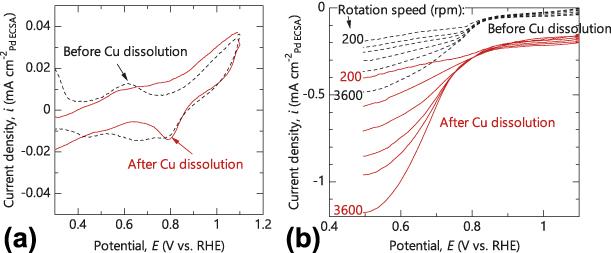
Cyclic voltammetry (CV) curves for BNP-PdCu before and after copper dissolution [Fig. 4(a)] were typical for palladium [Reference Xiao, Cordeiro, Gong, Han, Wang, Bian, Zhu, Xin and Wang24, Reference Rahul, Singh, Bera, Devivaraprasad and Neergat25, Reference Xue, Zhang, Zhou and Chan26] with peaks for oxygen desorption. Copper dissolution by HNO3 caused no significant change in the redox process during CV scanning. On the other hand, no redox peaks from copper were detected. Considering that elemental mapping in TEM for BNP-PdCu showed no clear segregation of palladium and copper [Fig. 2(c)], one can suggest that the change in the chemical state of surface Cu by alloying with Pd and/or that the surface coverage by Cu is not so high.
(a) CV curves for bimodal nanoporous PdCu before and after copper dissolution. The scan rate was 10 mV/s and the electrolyte was 0.1 mol/L H2SO4. (b) Polarization curves for RDEs that load bimodal nanoporous PdCu before and after copper dissolution. The scan rate was 10 mV/s and the electrolyte was 0.1 mol/L H2SO4.
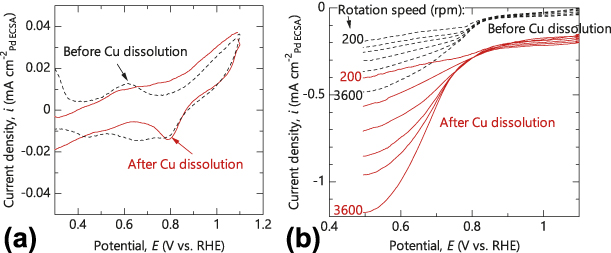
The ORR activity of the BNP-PdCu samples was examined by rotation disk electrode (RDE) [Fig. 4(b)]. In the polarization curves, the current density at a high potential of 1.1 V was almost independent of the electrode rotation rate, which corresponded to the kinetic region of the ORR. As the potential was decreased from 1.1 V, transitional regions from a kinetic- to a diffusion-controlled reaction rate were observed, with a lower current density at a higher electrode rotation rate. Below 0.4 V, the current density was almost constant and a diffusion-controlled reaction occurred.
The specific activities of BNP-PdCu before and after dissolution of copper were 0.32 and 0.61 mA/cm2, respectively, according to the RDE results. These values were significantly higher than those of the conventional Pd/C catalyst and comparable with the values reported recently for other nanostructured Pd-based alloys [Reference Wang, Qin, Jiang, Dong, Shao and Cai27, Reference Park, Ahmed and Jeon28, Reference Salomé, Ferraria, Botelho do Rego, Alcaide, Savadogo and Rego29, Reference Holade, Canaff, Poulin, Napporn, Servat and Kokoh30, Reference Begum, Ahmed, Cho and Jeon31]. On the other hand, the mass activity of BNP-PdCu before and after copper dissolution was 0.023 and 0.034 A/mgPd, respectively. The copper dissolution increased the specific activity of the BNP-PdCu. A higher activity per electrochemical surface area (ECSA) (not per mass or geometric area) for BNP-PdCu after copper dissolution meant that the copper dissolution enhanced the intrinsic ORR catalytic nature of the palladium.
Discussion
In the case of platinum, which has been examined intensively in previous studies, lattice straining affects the overall catalytic performance for ORR in platinum [Reference Strasser, Koh, Anniyev, Greeley, More, Yu, Liu, Kaya, Nordlund, Ogasawara, Toney and Nilsson32, Reference Rhen and McKeown33, Reference Gasteiger, Kocha, Sompalli and Wagner34]; lattice contraction is favorable for efficient ORR catalysis on platinum [Reference Strasser, Koh, Anniyev, Greeley, More, Yu, Liu, Kaya, Nordlund, Ogasawara, Toney and Nilsson32]. However, it has been reported that both lattice contraction [Reference Jiang, Zhu, Zhang, Shen, Wu, Zhang, Lu, Wu and Sun35, Reference Zhang, Hao, Geng and Xu36, Reference Liu, Samjeske, Nagamatsu, Sekizawa, Nagasawa, Takao, Imaizumi, Yamamoto, Uruga and Iwasawa37] and expansion [Reference Wang, Qin, Jiang, Dong, Shao and Cai27] in palladium catalysts enhance the overall catalytic performance for ORR. XRD analyses revealed that the apparent lattice constants of palladium in BNP-PdCu are close to those for bulk palladium (Table I), which is in contrast with the case of BNP-Pt [Reference Hakamada, Sato and Mabuchi23]. However, HR-TEM of BNP-PdCu showed significant local lattice contraction at ligament surfaces, as exemplified in Fig. 2(d). That is, the lattice spacing at the surface of ligaments is smaller than that in the bulk part of ligaments. This lattice disorder at the surface of nanoligaments is often observed in nanoporous metals and is attributed to the complex three-dimensional nanostructure with positive and negative curvatures [Reference Hakamada, Nakano, Furukawa, Takahashi and Mabuchi18, Reference Mahr, Müller-Caspary, Graf, Lackmann, Grieb, Schowalter, Krause, Mehrtens, Wittstock, Weissmüller and Rosenauer19, Reference Fujita, Guan, McKeena, Lang, Hirata, Zhang, Tokunaga, Arai, Yamamoto, Tanaka, Ishikawa, Asao, Yamamoto, Erlebacher and Chen22]. The present BNP-PdCu is replicated from NP-Cu; therefore, the lattice disorder is likely to be prominent, considering the increased complexity in the replicated BNP structure.
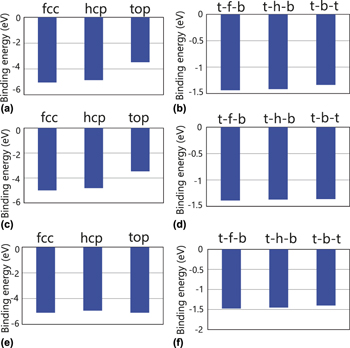
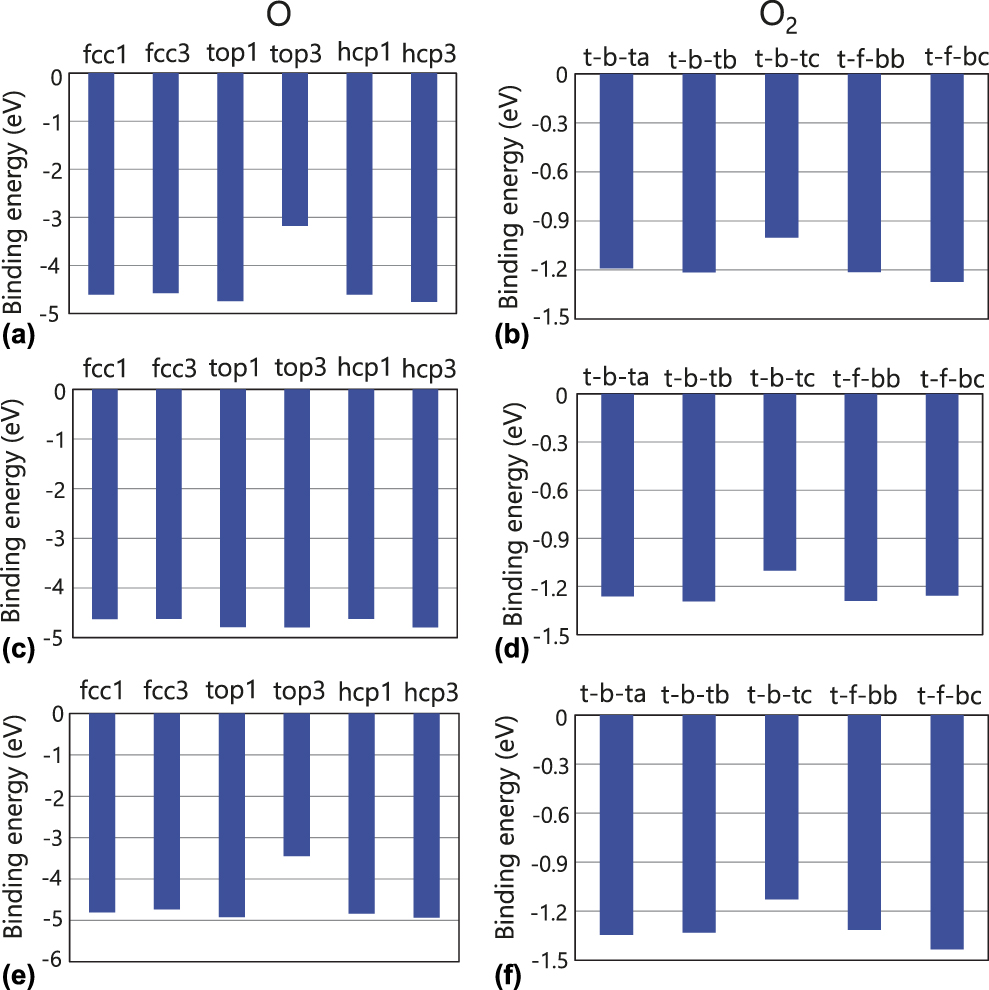
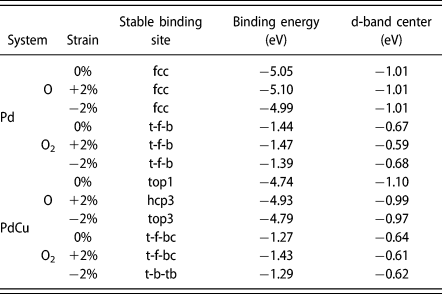
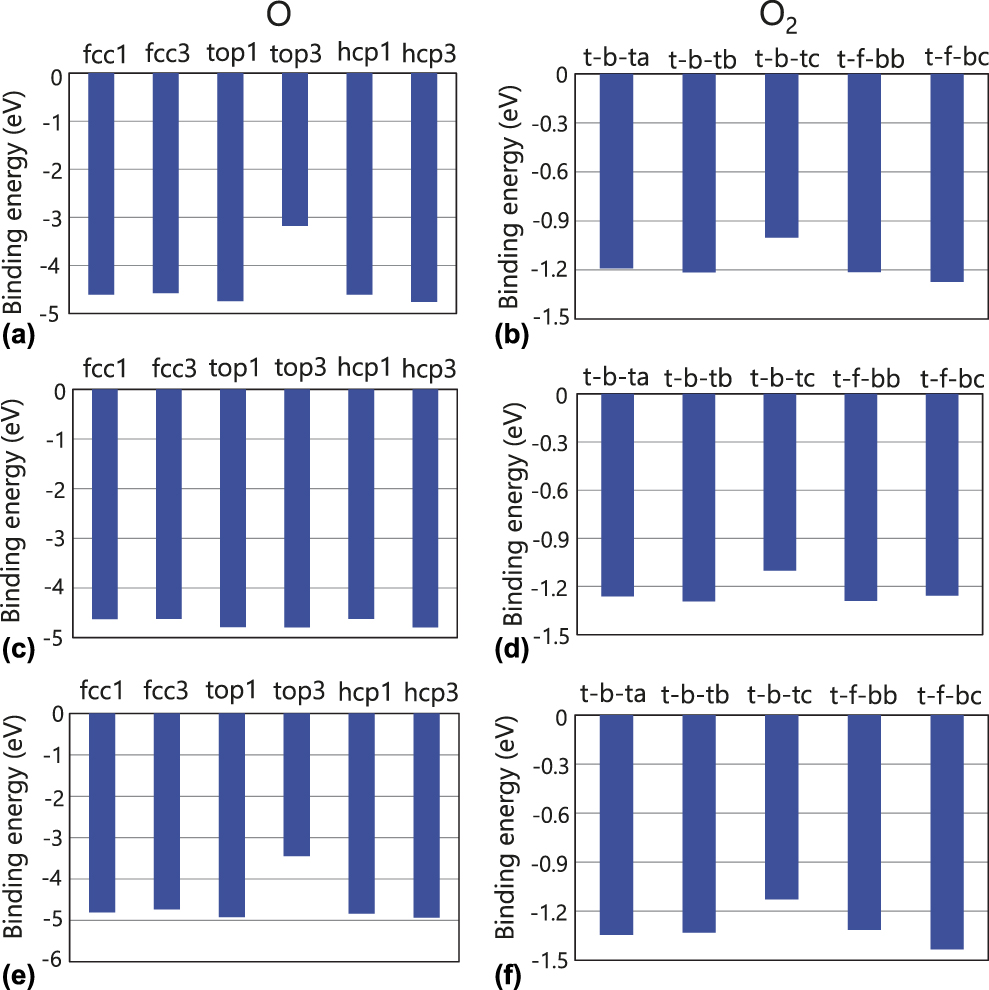
It is known that the binding of oxygen species to Pd surfaces is too strong and it is difficult to cause further reduction of the oxygen species to form water on Pd surfaces [Reference Shao38, Reference Shao, Huang, Liu, Zhang, Sasaki, Vukmirovic and Adzic39]. Therefore, a weak oxygen binding is desirable to balance the rates of electron transfer/O–O bond breaking and removal of O species from Pd surfaces [Reference Wang, Qin, Jiang, Dong, Shao and Cai27]. As shown above, Cu remained on the BNP-PdCu surface even after dissolution by HNO3; in addition, a lattice disorder was generated at its surface. Therefore, it is suggested that the Cu-ligand effect and/or the strain effect led to the high ORR activity of BNP-PdCu. To obtain insights into the origins of the high ORR activity of BNP-PdCu, the binding energies of O and O2 to Pd and PdCu were calculated. The results are shown for Pd in Fig. 5 and for PdCu in Fig. 6. The most stable binding sites for Pd were the fcc for O and the t-f-b for O2, regardless of the strain. However, the most stable binding sites for PdCu were different from those for Pd. The most stable binding sites and binding energies are listed in Table II. Table II shows that the binding energies of the oxygen species are increased (negatively decreased) by the contraction strain for Pd, while the binding energies are decreased (negatively increased) by the expansion strain, which indicates that the contraction strain enhances the desorption of oxygen species on Pd although the expansion strain disturbs the desorption. Thus, the contraction strain leads to the enhanced ORR activity of Pd. In addition, Table II shows that the binding energies are increased by the addition of Cu, regardless of the strain. This suggests that the ORR activity of Pd is enhanced owing to the Cu-ligand effect. The Cu-ligand effect can significantly enhance the ORR activity of Pd because the binding energies are largely increased by the addition of Cu.
Binding energies of O and O2 to Pd surface, (a) O binding energy at 0% strain for fcc, hcp, and top sites, (b) O2 binding energy at 0% strain for t-f-b, t-h-b, and t-b-t sites, (c) O binding energy at 2% contraction strain for fcc, hcp, and top sites, (d) O2 binding energy at 2% contraction strain for t-f-b, t-h-b, and t-b-t sites, (e) O binding energy at 2% expansion strain for fcc, hcp, and top sites, and (f) O2 binding energy at 2% expansion strain for t-f-b, t-h-b, and t-b-t sites.

Binding energies of O and O2 to PdCu surface, (a) O binding energy at 0% strain for fcc, hcp, and top sites, (b) O2 binding energy at 0% strain for t-f-b, t-h-b, and t-b-t sites, (c) O binding energy at 2% contraction strain for fcc, hcp, and top sites, (d) O2 binding energy at 2% contraction strain for t-f-b, t-h-b, and t-b-t sites, (e) O binding energy at 2% expansion strain for fcc, hcp, and top sites, and (f) O2 binding energy at 2% expansion strain for t-f-b, t-h-b, and t-b-t sites.
Most stable binding sites, their binding energies, and d-band centers by first-principles calculations on binding of O and O2 to (111) Pd and PdCu surfaces.
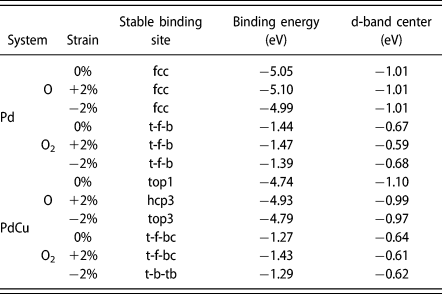
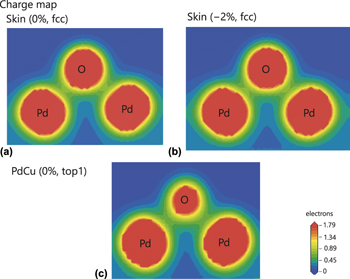
The densities of states (DOS) for a palladium atom of the Pd (PdCu) surface binding to an oxygen atom are shown in Fig. S1 in Supplementary material. The electronic states for Pd were hardly changed by the presence of strains, which corresponds to the result that the strain had little effect on the d-band center for Pd (Table II). However, the electronic states were changed by the presence of Cu [see Figs. S1(a) and S1(d)]. Both the downshift and upshift of the d-band center were caused by the addition of Cu (Table II). Thus, the variation in binding energy by the addition of Cu cannot be explained only from the viewpoint of the d-band center. The charge density distribution between the palladium and oxygen atoms is shown in Fig. 7. The charge density between the palladium and oxygen atoms was lower for PdCu than for Pd. Therefore, it is proposed that the binding energy increased by the addition of Cu is related to the reduced charge density.
Charge density distribution between palladium and oxygen atoms, (a) Pd surface with 0% strain, (b) Pd surface with 2% contraction strain, and (c) PdCu surface with 0% strain.

As shown above, the contraction strain and the addition of Cu enhance the ORR activity of Pd. Hence, the high ORR activity of BNP-PdCu may be related to both the strain effect and the Cu-ligand effect. The present experimental results showed that the ORR activity was enhanced by the dissolution of Cu, although the contraction strain might be reduced and the amount of Cu on Pd was reduced by the dissolution. The Pd surface that is covered by Cu before the dissolution cannot provide the sites for ORR. In such a case, only the strain effect enhances the ORR activity because the Pd surface that is not covered by Cu provides the sites for ORR. After the dissolution, however, not only the strain effect but also the Cu-ligand effect enhances the ORR activity because Cu remains on the Pd surface. It is therefore suggested that the high ORR activity of BNP-Pd mainly arises from the Cu-ligand effect.
Conclusions
Efficient ORR BNP-PdCu catalysts were fabricated by using NP-Cu as a sacrificial metallic support. Cu remained on Pd surfaces even after dissolution of Cu. The high ORR activity of BNP-PdCu was suggested to mainly arise from the Cu-ligand effect.
Experimental methods
Copper-manganese alloy ingots with the composition of Cu0.3Mn0.7 were fabricated by the arc melting of pure copper and manganese (Nilaco, Tokyo, Japan) in an Ar atmosphere. After heating at 1123 K for 24 h in an Ar atmosphere, the button-shaped alloy ingot was water-quenched [Reference Okamoto40], followed by cold-rolling to 0.2-mm thickness.
Dealloying to fabricate NP-Cu was conducted by free corrosion of the rolled Cu0.3Mn0.7 sheet in 1 mol/L HCl for 24 h, where manganese was dissolved selectively and copper formed a nanoporous structure spontaneously [Fig. 1(b)] [Reference Keir and Pryor11, Reference Min and Li12, Reference Hayes, Hodge, Biener, Hamza and Sieradzki13]. After recovery by percolation and washing in pure water, the NP-Cu was pulverized manually in an agate bowl.
NP-Cu (0.05 g) was mixed with 5 wt% Nafion ethanolic solution (1 g) and of water (5 g). After homogenization in an ultrasonic bath, the suspension was fixed on a glassy carbon (GC) RDE with 5-mm diameter. The displacement deposition of palladium on the fixed NP-Cu was conducted by immersing the GC RDE in diluted HCl containing 0.1 mol/L PdCl2 at 273 K for 1 h at 600 rpm [Reference Coleman and Co41]. Thus, the GC electrode included NP-Cu with a fine palladium deposition; the bimodal nanoporous structure of palladium supported on NP-Cu was expected to form already at this step [Fig. 1(a)]. The GC electrode that included BNP-PdCu was immersed in 0.1 mol/L HNO3 for 18 h to dissolve the supporting copper.
We conducted CV at room temperature by using the GC electrode loaded with BNP-PdCu as a working electrode. To evaluate the ECSA of the BNP-PdCu samples, CV was conducted in degassed 0.1 mol/L H2SO4 with a scan rate of 10 mV/s. A reversible hydrogen electrode (RHE) and Pt wire were used as a reference and counter electrode, respectively. For electrochemical cleaning, CV was repeated until a steady current–potential cyclic curve was attained. The charge (Q O) associated with the reduction of oxidized monolayer was calculated by using the cathodic peak between 0.6 and 0.8 V (versus RHE), which was then converted to the ECSA (A) of the sample [Reference Trasatti and Petrii42],
 $${{{A_{{\rm{sample}}}}} / {{A_{{\rm{bulk}}}}}} = {{{Q_{{\rm{O,sample}}}}} / {{Q_{{\rm{O,bulk}}}}}}\quad ,$$
where the subscripts “sample” and “bulk” represent the BNP-PdCu and bulk palladium, respectively.
The working GC-RDE-loaded BNP-PdCu was rotated for ORR activity measurements during CV in an electrolyte of O2-saturated 0.1 mol/L H2SO4 with a scan rate of 10 mV/s. The kinetically controlled current i K, which is an index of the ORR activity of the BNP-PdCu, was calculated according to the following:
 $${1 / i} = {1 / {{i_{\rm{K}}}}} + {1 / {B{\omega ^{1{\rm{/}}2}}\quad ,}}$$
where i is the measured current; B is a constant, and ω is the RDE rotation speed. i K was derived from the intersection at ω−1/2 = 0 by the Koutechy–Levich plot of i −1 (at 0.70 V versus RHE) against ω−1/2 [Reference He, Song, Wang, Zheng, Mei and Feng43].
Substances on the GC RDE were collected for SEM, STEM, and HR-TEM. EDXS was used for elemental analyses in the microscopic observations. XRD patterns of the samples were collected under a parallel-beam configuration. The concentrations of palladium and other elements in the samples were determined by ICP-AES after dissolving the samples in 20 mL of nitrohydrochloric acid.
Calculation methods
First-principles calculations on the adsorption of O and O2 on (111) Pd and PdCu surfaces were carried out to understand the origins for the catalytic activity of BNP-PdCu. The first-principles calculations were performed within the framework of density functional theory [Reference Hohenberg and Kohn44, Reference Kohn and Sham45] as implemented in the CASTEP code [Reference Payne, Teter, Allan, Arias and Joannopoulos46]. The plane-wave basis set was used to calculate the electronic properties, and the generalized gradient approximation of the Perdew–Burke–Ernzerhof [Reference Perdew, Burke and Ernzerhof47] functional was used for the exchange-correlation potential for the structure optimizations. Ultrasoft pseudopotentials [Reference Vanderbilt48] were used for all the elements in the calculations. We applied a cutoff energy of 400 eV. The Brillouin zone was sampled using 5 × 5 × 1 Monkhorst–Pack k-point meshes [Reference Monkhorst and Pack49]. Periodic boundary conditions were applied in the x, y, and z directions.
Atomic models are shown in Fig. S2 in Supplementary material. The rectangular cell consisted of 4 layers of the (111) plane of Pd with a vacuum gap of 15 Å between repeated slabs [Fig. S2(a)]. The PdCu model was constructed by substituting one Pd atom at each layer except the top lay with one Cu atom to avoid direct reaction of a Cu atom with an oxygen atom [Fig. S2(b)]. A 2% tensile and compressive strain was applied parallel to the exposed surface to identify the strain effects. All cells were constructed from 2 × 2 surface unit cells. The top three layers were relaxed while the bottom layer was frozen during geometry optimization calculations. The binding energy of an oxygen species to a substrate (E b) can be given by the following:
 $${E_{\rm{b}}} = {E_{{\rm{substrate}} + {\rm{oxygen}}}} - {E_{{\rm{substrate}}}} - {E_{{\rm{oxygen}}}}\quad ,$$
where E substrate+oxygen is the internal energy of an oxygen species-binding substrate, E substrate is the internal energy of a substrate, and E oxygen is the internal energy of an oxygen species. The most stable binding site of an oxygen species was defined as the site where the binding energy was the lowest among the various binding sites shown in Fig. S2, based on a previous study [Reference Xu, Ruban and Mavrikakis50].
Supplementary material
To view supplementary material for this article, please visit https://doi.org/10.1557/jmr.2019.154.
Acknowledgments
TEM and STEM observations were conducted at the Kyoto University Nano Technology Hub in the “Nanotechnology Platform Project” sponsored by the Ministry of Education, Culture, Sports, Science and Technology (MEXT), Japan. Computation time for first-principles calculations was provided by the SuperComputer System, Institute for Chemical Research, Kyoto University. M.H. acknowledges financial support by JGC-S Scholarship Foundation.