


Introduction
Climate-change effects on the cryosphere are of major importance to humanity (e.g. Reference Bamber and PayneBamber and Payne, 2004). Within the cryosphere, glaciers constitute an important water resource that is decreasing in volume on a worldwide scale in response to climate change (e.g. Reference Hock, Jansson, Braun, Huber, Bugmann and ReasonerHock and others, 2005). Analyses of a variety of climate proxy records can emphasize distinctions between natural long-term modes and anthropogenically induced climate variability. A large number of hemispheric and global climate reconstructions are available (e.g. Reference MannMann, 2002). However, these do not provide information about regional-scale variations, where regions with key climatic features may be masked in hemispheric or global reconstructions (Reference Luterbacher, Dietrich, Xoplaki, Grosjean and WannerLuterbacher and others, 2004). Consequently, studies of regional climate variability are important when climate impacts are evaluated (Reference Shindell, Schmidt, Miller and MannShindell and others, 2003).
Climate variability in Scandinavia is likely to have been more complex than hemispheric or global mean climate changes indicate, with the role of atmospheric and ocean circulation changes, for example, playing a prominent role (personal communication from M.E. Mann, 2004). Thus, there is still much to be learned through continued detailed reconstructions of climate change in this particular region. Climate-related studies in Scandinavia have often been based on single-type climate proxy records. However, no single proxy is adequate for reconstructing past climate (Reference MannMann, 2002). Consequently, depending on the climate variable studied, climate proxies should be combined. Glacier mass balances and dendroclimatological data are two suitable proxies for studies of high-latitude climate variability; they may provide information on temperature, precipitation and the atmospheric circulation.
The role of atmospheric circulation in determining local to regional climate variability has been a focus of climate research in the past few decades. In the extratropical Northern Hemisphere, two major modes have been related to temperature and precipitation variations: the North Atlantic Oscillation (NAO) and the Arctic Oscillation (AO). The NAO is usually defined by the difference in sea-level pressure between Iceland and the Azores, can be regarded as a measure of the strength of the westerly winds across the North Atlantic Ocean in the 40–60˚ N latitude belt (e.g. Reference GreatbatchGreatbatch, 2000) and affects climate in the North Atlantic region (Reference HurrellHurrell, 1995; Reference Osborn, Briffa, Tett, Jones and TrigoOsborn and others, 1999; Reference Slonosky and YiouSlonosky and Yiou, 2000). When the NAO is in a positive phase, the wintertime meridional pressure gradient over the North Atlantic is large, since the pressure gradients are strongest during the cool season (Reference Hurrell, Kushnir and VisbeckHurrell and others, 2001), and this is associated with wetter and milder conditions than normal over Scandinavia (Reference HurrellHurrell, 1995). Reference Thompson and WallaceThompson and Wallace (1998) introduced the term Arctic Oscillation, defined as a nearly axisymmetric spatial pattern of interannual variability of Northern Hemisphere winter sea-level pressure centered over the Arctic, which is more strongly coupled to Eurasian winter surface air temperatures than the NAO index. The AO is believed to be one of the leading modes of high-latitude variability (Reference Fyfe, Boer and FlatoFyfe and others, 1999) and may be a better indicator of the atmospheric mode of variability usually associated with the NAO (Reference GreatbatchGreatbatch, 2000).
Year-to-year variations in glacier mass balance may be attributed to hemispheric-scale circulation. Reference Walters, Meier and PatersonWalters and Meier (1989) showed how mass balances in Alaska, USA, and the Cascades of British Columbia, Canada/Washington State, USA, exhibit a seesaw pattern depending on the strength of the Aleutian low. When the low was strongly developed, storms swung on a northerly path, yielding high winter balances in Alaska and leaving the southern areas starved of accumulation, and the opposite for a weakly developed low. Reference Pohjola and RogersPohjola and Rogers (1997) studied similar relationships for the Scandinavian glaciers and found weak correlations between both the NAO and their own developed Norwegian Sea Index (NSI) and the mass balance of Storglaciären. Although the coupling is far from established, it is evident that larger-scale circulation affects regional signals in mass balance.
In the past, studies combining tree-ring and glacier fluctuation data have mainly focused on attempts to reconstruct climate fluctuations on decadal-to-century timescales (e.g. Reference MatthewsMatthews, 1977; Reference Karlén, Mörner and KarlénKarlén, 1984; Reference LuckmanLuckman, 1993), or to infer past changes in glacier volume (Reference Raper, Briffa and WigleyRaper and others, 1996). However, both proxies have been analyzed for dependence on hemispheric circulation pattern, and relationships between different atmospheric circulation modes and mass-balance/tree-growth variability have been found (Reference d’Arrigo, Cook, Jacoby and Briffad’Arrigo and others, 1993, Reference d’Arrigo, Cook, Mann and Jacoby2003; Reference Pohjola and RogersPohjola and Rogers, 1997; Reference McCabe, Fountain and DyurgerovMcCabe and others, 2000; Reference Nesje, Lie and DahlNesje and others, 2000; Reference Six, Reynaud and LetréguillySix and others, 2001; Reference Cook, d’Arrigo and MannCook and others, 2002).
In this paper, we explore the possibilities and benefits of combining annually resolved glacier mass-balance and tree-ring data to further our understanding of how regional climate variability on intra-annual timescales in Scandinavia is connected to the atmospheric circulation.
Data
Mass-balance data
Continuous records of annual glacier mass-balance records in Scandinavia now span >50years (e.g. Reference AndreassenAndreassen, 1999; Reference Holmlund and JanssonHolmlund and Jansson, 1999; Reference Holmlund, Jansson and PetterssonHolmlund and others, 2005, fig. 1) shows locations) and provide information on both summer and winter conditions. Winter balance is a more-or-less complex function of precipitation and wind drifting (storminess) since snow precipitation is significantly redistributed in conjunction with or after reaching the ground. Summer balance is primarily a function of summer temperature, as is evident from reasonably good functional relationships between local ablation and elevation (e.g. Reference JanssonJansson, 1999) and between ablation and summer average temperature (e.g. Reference Holmlund, Jansson and PetterssonHolmlund and others, 2005). However, secondary effects from radiation are also present (Reference HockHock, 1998). Hence, mass balance yields an integrated signal for both winter and summer seasons. It is important to recognize that the signal involves year-to-year differences in length of the seasons: a short, warm summer may yield the same result as a longer, cooler summer. Similarly, single intense precipitation events may produce significant portions of the winter budget. A single 6 day snowstorm in May 1986 yielded 10% of the winter balance for the 1984/85 mass-balance year (H. Grudd and P. Jansson, unpublished information).
Map of Scandinavia showing location of glaciers (filled circles), dendroclimatological chronologies (filled squares) and meteorological stations (filled triangles) used in this study. Abbreviations in the map: Northern Scandinavia: AB: Abisko (climate); EB: Engabreen; MG: Mårmaglaciären; NI: Nikkaluokta (chronology); RJ: Riukojietna; RG: Rabots glaciär; SG Storglaciären. Central Scandinavia: JL: Jämtland (chronology); SL: Storlien (climate). Southern Scandinavia: ÅB: Ålfotbreen; GB: Gråsubreen; HB: Hellstugubreen; VI: Vetti (precipitation); LD: Lærdal (temperature); NB: Nigardsbreen; RK: Rembesdalsskåka; SB: Storbreen; VL: Veolia (chronology).
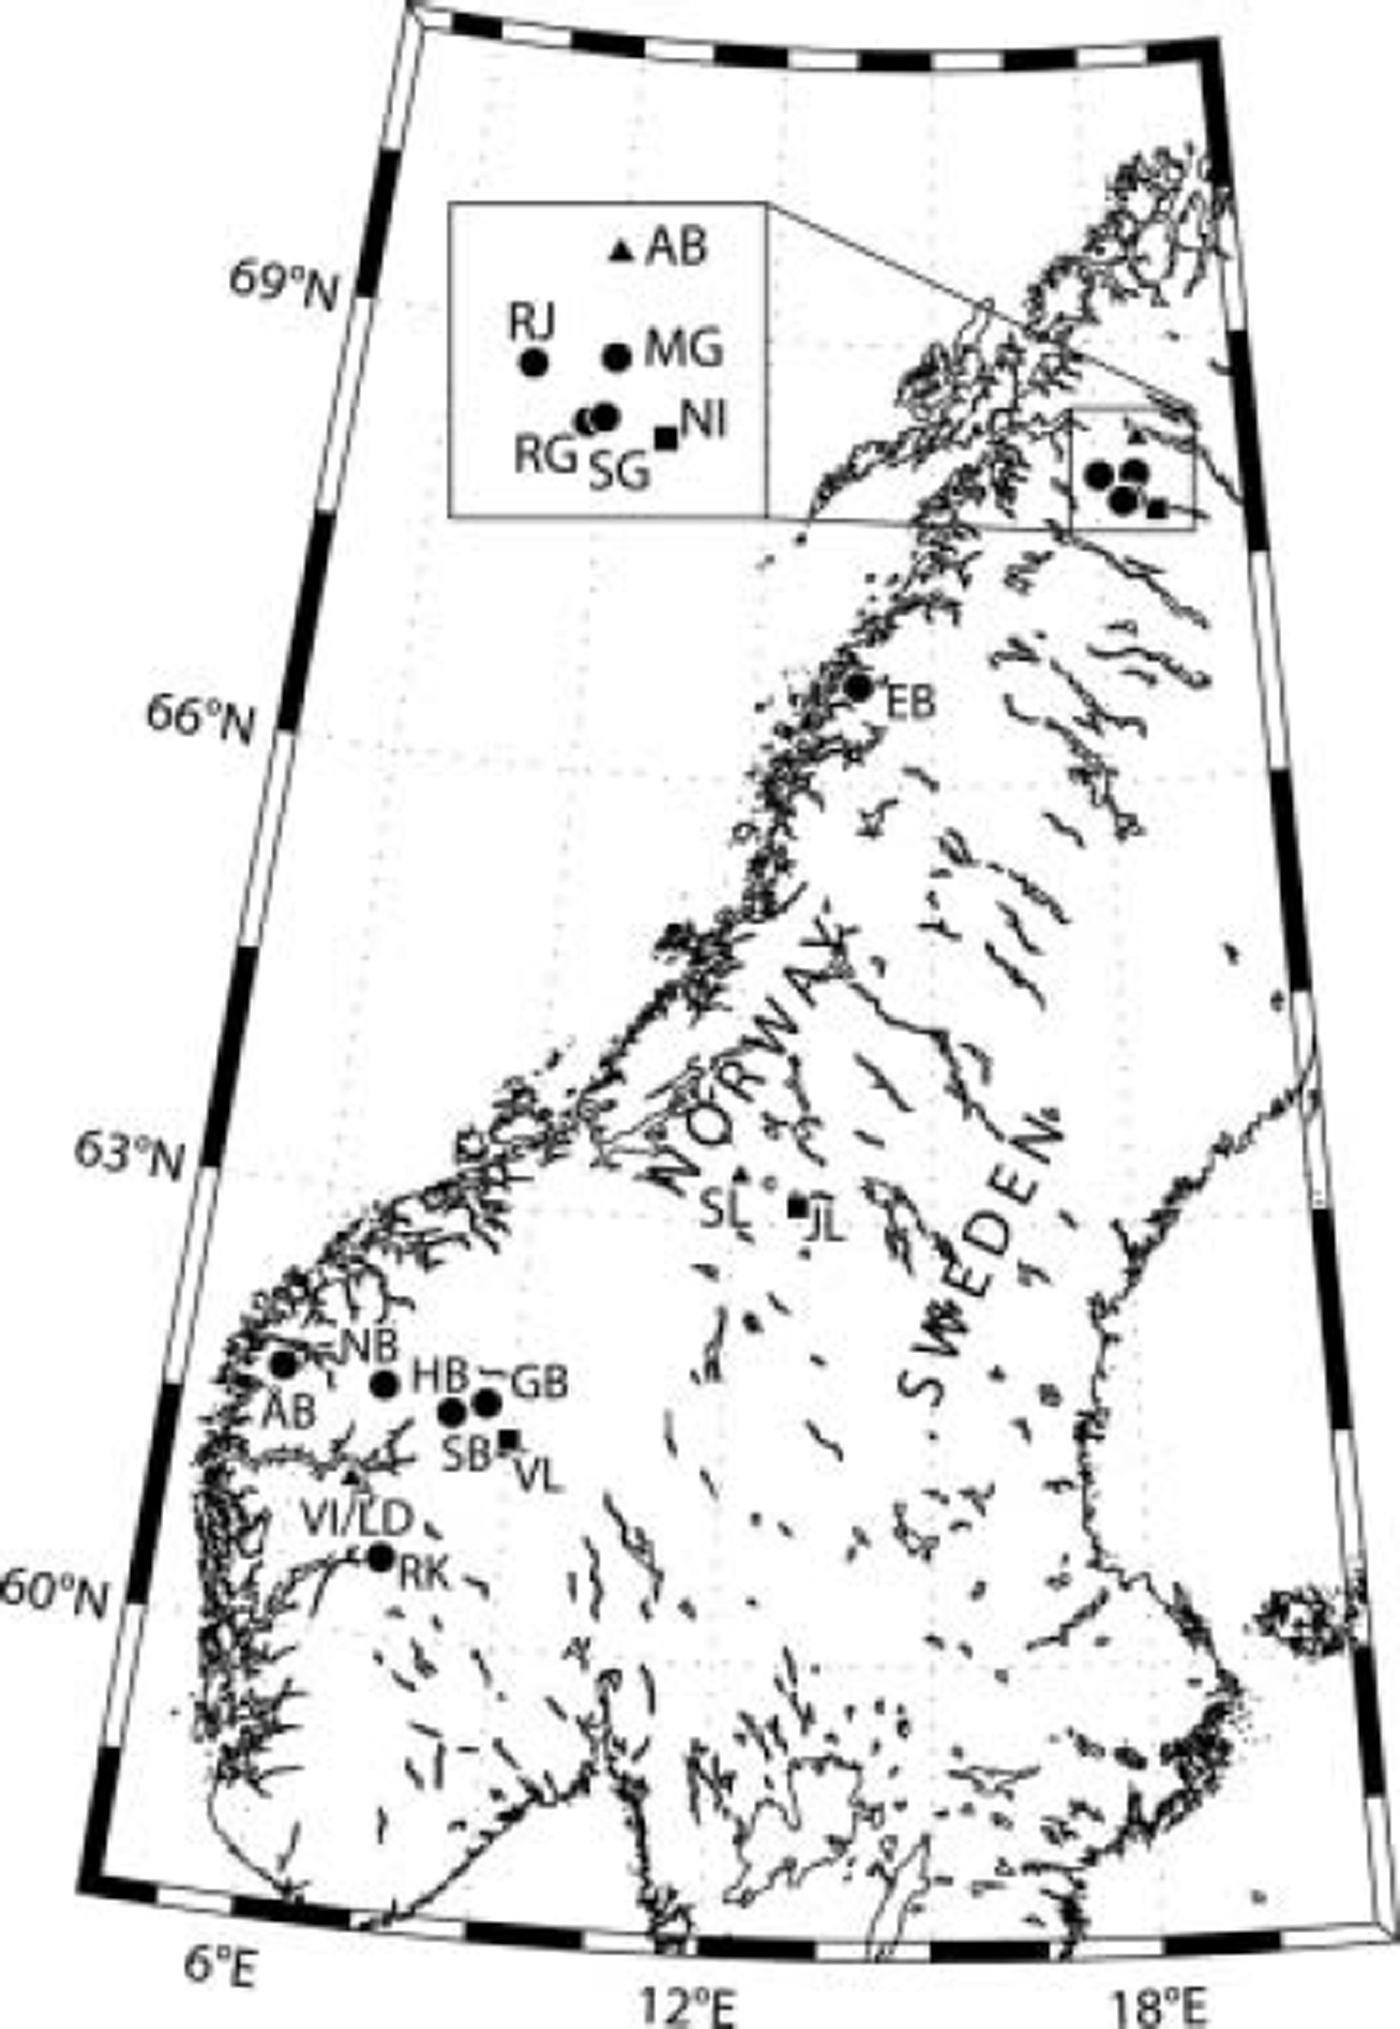
Mass-balance data for all Scandinavian glaciers can be found in the World Glacier Monitoring Service Bulletins (e.g. Reference Haeberli, Frauenfelder, Hoelzle and ZempHaeberli and others, 2003) as well as reports from the Norwegian Water Resources and Energy Directorate (NVE) (e.g. Reference Kjøllmoen, Andreassen, Engeset, Elvehøy and JacksonKjøllmoen and others, 2003) and the Tarfala Research Station Annual Reports (e.g. Reference Jansson and KlingbjerJansson, 2000). The Tarfala mass-balance program (Reference Holmlund and JanssonHolmlund and Jansson, 1999) runs four long-term studies: Storglaciären (initiated in 1945), Rabots glaciär (1982), Marmaglaciären (1987) and Riukojietna (1985). NVE (e.g. Reference Kjøllmoen, Andreassen, Engeset, Elvehøy and JacksonKjøllmoen and others, 2003) monitors a large number of glaciers in Norway; we use the following: Storbreen (1949), Nigaardsbreen (1962), Alfotbreen (1963), Engabreen (1970), Gråsubreen (1962), Rembesdalsskåka (1963) and Hellstugubreen (1962). The locations are shown in Figure 1.
Dendroclimatological data
Close to their limit of distribution in high altitudes or latitudes, the annual growth of trees will reflect local or regional summer temperatures (e.g. Reference FrittsFritts, 1976). Scots pine (Pinus sylvestris L.) tree-ring data are suitable for century-to millennia-scale reconstructions/interpretations of high-and low-frequency summer temperature variability along the Scandinavian Mountains (Reference BriffaBriffa and others, 1992; Reference Kalela-BrundinKalela-Brundin, 1999; Reference KirchheferKirchhefer, 2001; Reference Gunnarson and LinderholmGunnarson and Linderholm, 2002). The Torneträsk chronology in northernmost Sweden reaches back to 5500 BP with annual resolution (Reference Grudd, Briffa, Karlén, Bartholin, Jones and KromerGrudd and others, 2002), while the Jamtland chronology in the central Scandinavian Mountains presently spans 1600 BC to AD2000 (Reference Linderholm and GunnarsonLinderholm and Gunnarson, 2005), with older trees dating back to ∼6600 BP (Reference Gunnarson and LinderholmGunnarson and Linderholm, 2002). These two multi-millennial chronologies, although separated by ∼600km, correlate well, indicating a regional climate signal in tree-ring data along the Scandinavian Mountains. Although tree growth is primarily governed by air temperatures during the vegetation period, high precipitation (either as snow in the previous winter or as rain during summer) in the maritime central parts of Scandinavia may have negative effects on tree growth, especially during cold years. Consequently, the climate signal recorded in tree rings is not necessarily only a simple function of summer temperatures, but a combination of weather conditions prior to and during the actual vegetation period. In addition to temperature, tree-ring data from central Scandinavia have yielded information on humidity (Reference GunnarsonGunnarson, 2001) and winter precipitation variability (Reference Linderholm and GunnarsonLinderholm and Gunnarson, 2005). Furthermore, changes in the atmospheric circulation are related to changes in pine growth rates and the growth/climate relationship in western Scandinavia, where negative growth trends in past decades are associated with the strong and positive phase of the NAO (Reference LinderholmLinderholm, 2002; Reference Solberg, Hofgaard and HyttebornSolberg and others, 2002; Reference Linderholm, Solberg and LindholmLinderholm and others, 2003).
To date, there are more than 60 tree-ring chronologies from Scandinavia, mainly located close to the tree limit along the Scandinavian Mountains. For this study, we selected Scots pine tree-ring width chronologies (TRW) from three sites: south-central Norway and northernmost Sweden, the areas where most glaciers are found, and central Scandinavia, an area almost devoid of glaciers (Fig. 1). At all sites, pines grow at the local tree limit, and annual radial growth is mainly limited by summer temperature. Nikkaluokta TRW (470 m a.s.l.) is close to the glaciers in the Kebnekaise massif in northern Sweden; Jämtland TRW (700 m a.s.l.) is situated in the central Scandinavian Mountains, near the Sweden–Norway border; and Veolia TRW (880 m a.s.l.; data obtained from the International Tree Ring Data Bank, http://www.ngdc.noaa.gov/-paleo/treering.html, collected and processed by F.H. Schweingruber) lies in the central highlands in south-central Norway, where numerous glaciers are found. Unfortunately, Veolia TRW ends in 1978 due to a lack of updating tree-ring data in southern Norway.
Analysis
In this paper, we use published climate data on the AO (Reference Thompson and WallaceThompson and Wallace, 1998) and NAO (Reference Jones, Jónsson and WheelerJones and others, 1997) to compare with mass-balance and dendroclimatological data.
Mass-balance data
To analyze the mass-balance records of Scandinavia, we performed simple correlation analyses of winter (b W), summer, (b S, a negative quantity), and net (b N) balance as well as equilibrium-line altitudes (ELAs) of the glaciers with the longest mass-balance records.
The results for winter balance correlations (Fig. 2) indicate that the southern Norwegian glaciers all correlate well, with Gråsubreen as the only deviation. Within the northern region, glaciers also correlate relatively well. However, it is important to remember that the records for Mårmaglaciären, Riukojietna and Rabots glaciär in the north are relatively short. It is obvious that correlations between northern and southern glaciers are generally poorer than among glaciers in the northern and southern regions, respectively. Storglaciären seems to correlate better with glaciers in the south than other northern glaciers. This may be due to the shorter records for all other northern glaciers.
Matrices of correlation coefficients for winter balance (a), summer balance (b), net balance (c) and ELA (d) for all glaciers shown in Figure 1. In general, correlation coefficients over 0.5 are significant at the 0.05 level.
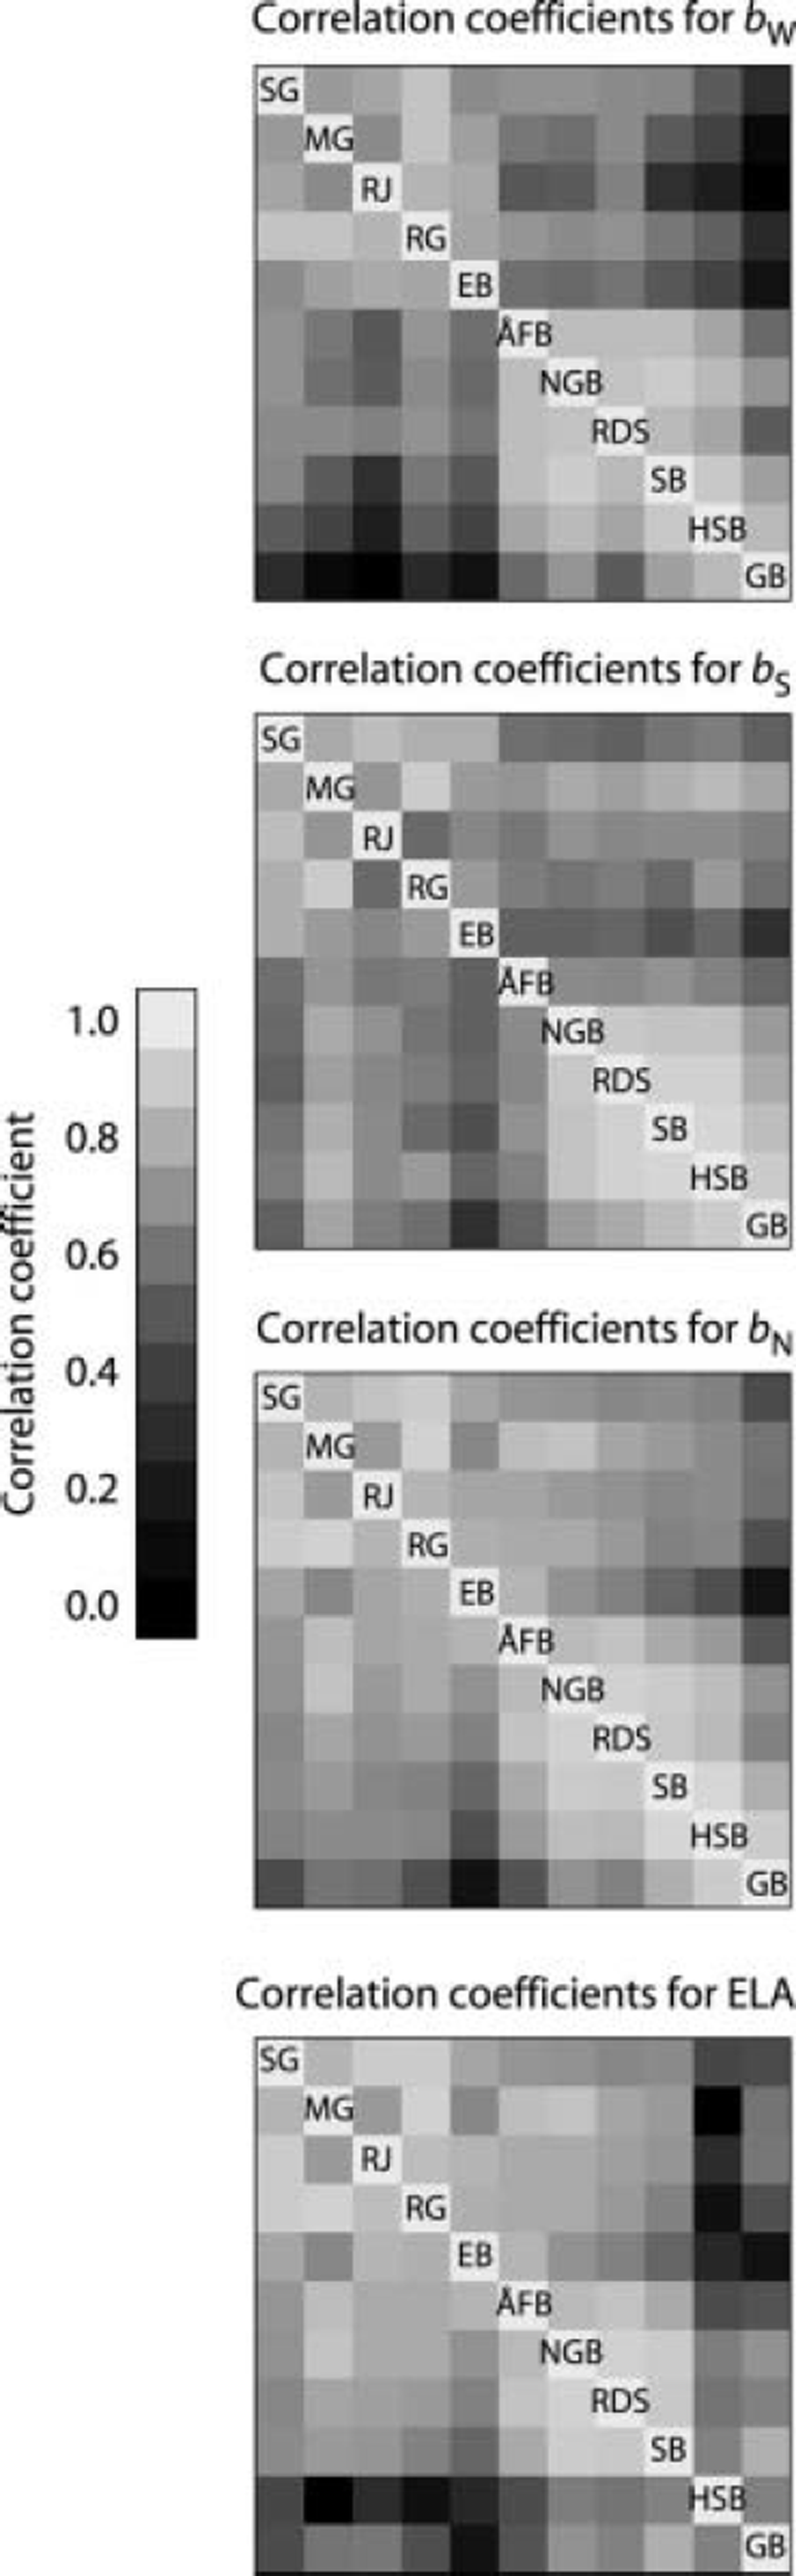
Summer balances show a different pattern (Fig. 2). All glaciers in southern Norway, except the very maritime Ålfotbreen, correlate well. The Ålfotbreen summer balance has been shown not to correlate with temperature but with wind and cloudiness (Reference ØstremØstrem, 1973), implying that much melt occurs by heat released from condensation. G. Østrem (personal communication, 2004) also observed how runoff from the glacier was significantly decreased during an unusual 2 week fair-weather period, which also corroborates the dependence of melting on condensation in the area. The glacier thus experiences much less interannual variability than the more continental glaciers further inland. In the north, Storglaciären and Engabreen correlate well because the distance between the glaciers does not permit larger differences in synoptic conditions during summer. Correlations among the other glaciers are relatively high, but weaker than the Storglaciären–Engabreen correlation, probably due to the lower number of data points in the analysis. A north–south difference in summer balance is not as obvious as for the winter balance, but it is present.
The net balance correlations are generally better than those for winter and summer balances (Fig. 2). This is surprising since the winter balance correlations are regionally good but show interregional differences, and summer balance correlations have a similar pattern but with relatively higher correlation coefficients. Since net balance is the sum of winter and summer balances, b N = b W +b S, our result indicates that summer and winter balances must be offsetting, producing a less marked north–south difference and generally higher correlations between glacier balances.
ELAs are a function of the net balances on the glaciers. Correlation coefficients (Fig. 2) are generally lower than for the net balances.
Dendroclimatological data
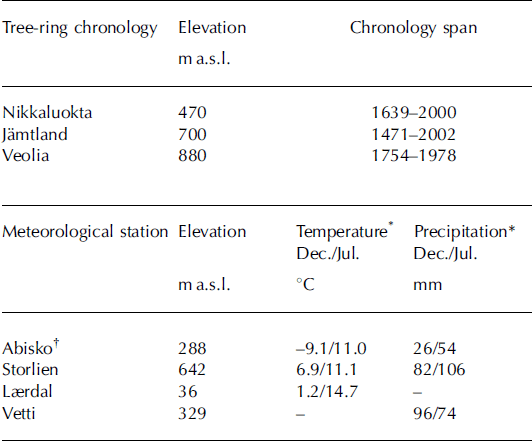
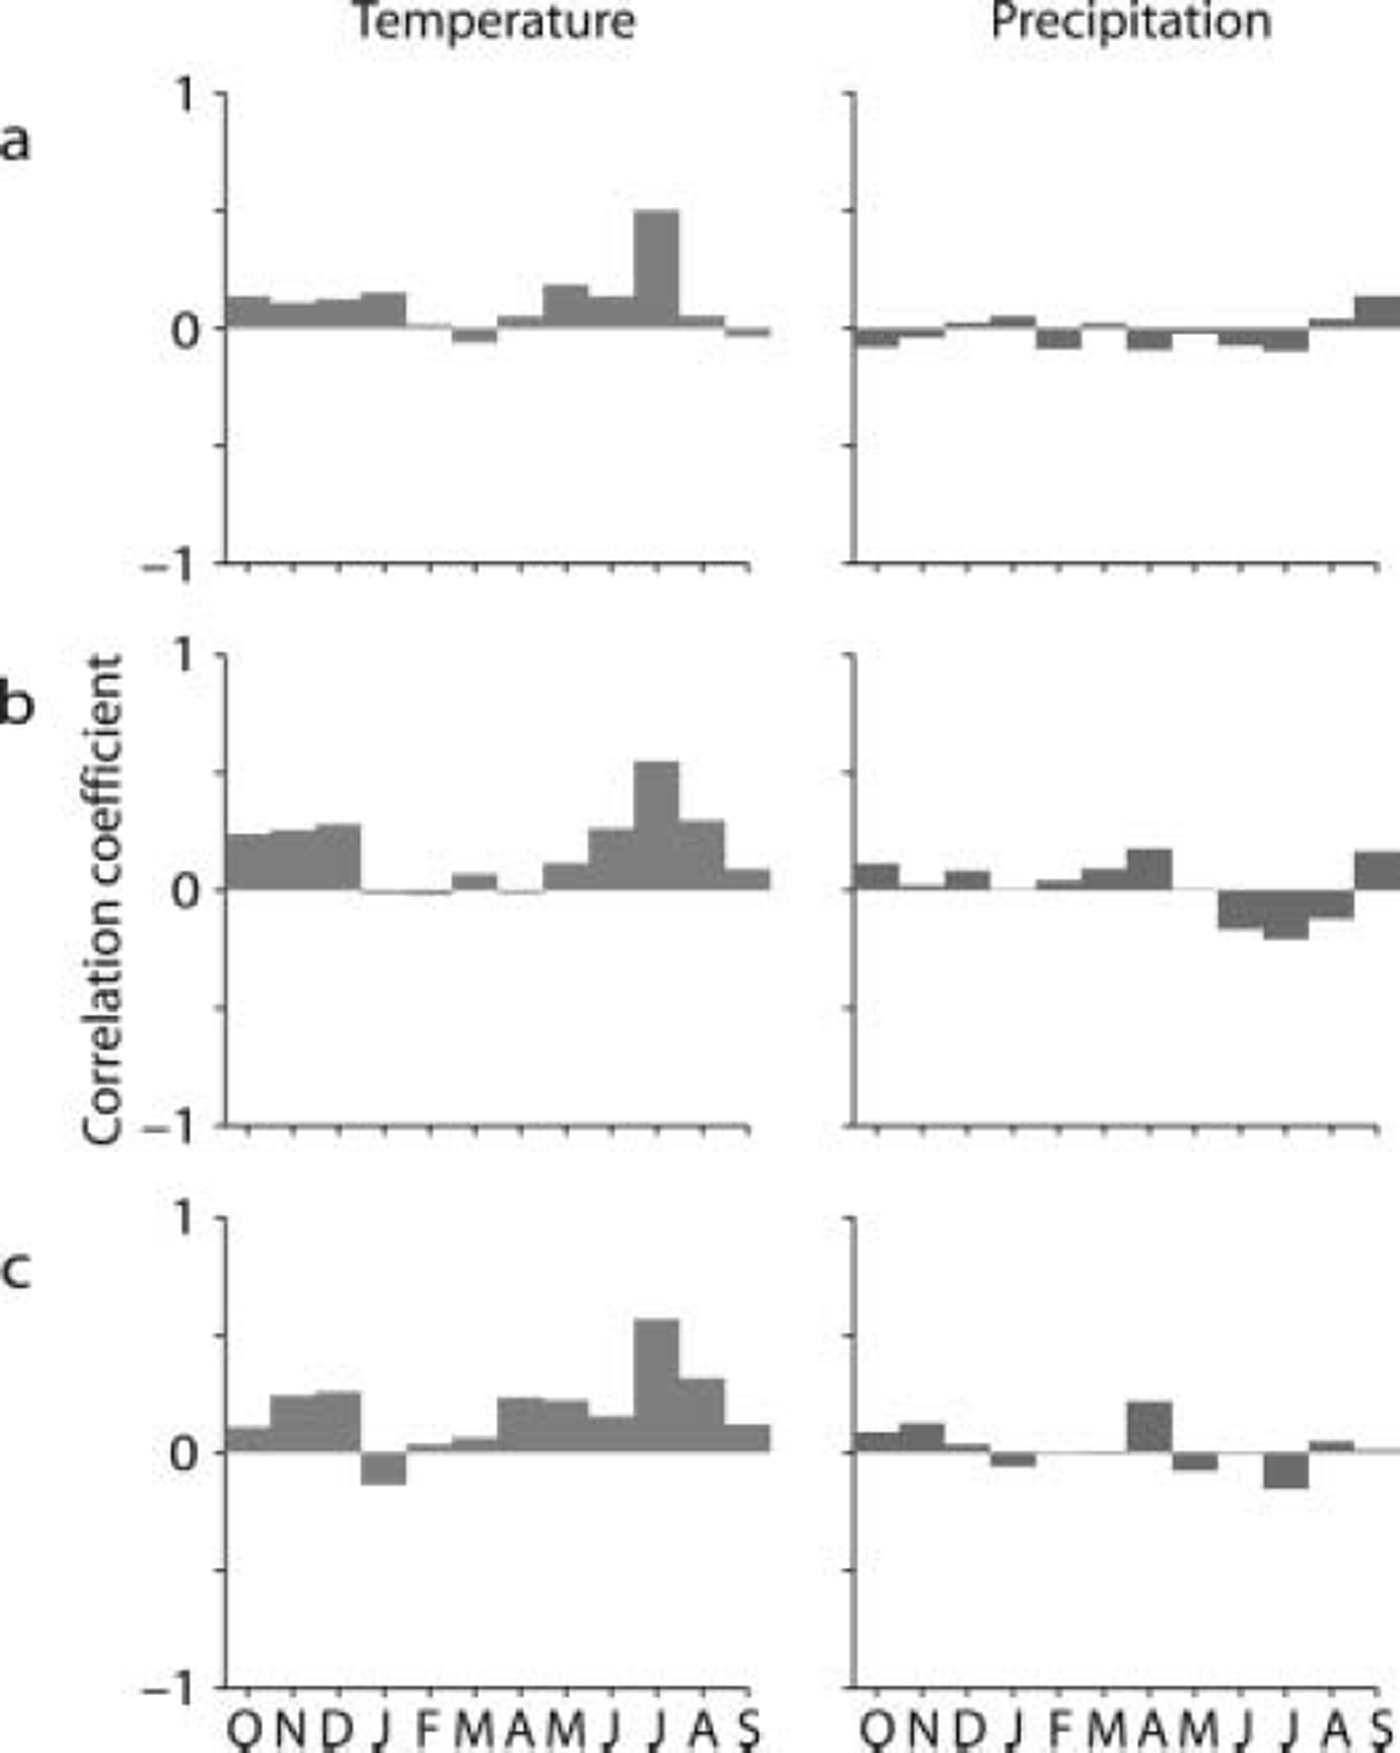
For the pine-growth/climate analyses, tree-ring series were standardized by the removal of age-associated trends to maximize high-frequency variations (Reference FrittsFritts, 1976), and since we wanted to maximize high-frequency variability in the datasets, we used the residual chronologies, computed by removing autocorrelation from the individual series. The relationship between pine growth and climate was established by correlation analysis, using annual tree-ring residuals, mean monthly temperature and total monthly precipitation (Table 1). To incorporate the effect on tree growth of previous fall and winter climate, as well as conditions during the growth season, the period of analysis covered September of the preceding year to August of the growth year. Temperature and precipitation data were obtained from the closest meteorological stations with long coverage. Strong correlation between pine growth and July temperatures is found at all sites (Fig. 3), but in Jämtland tree growth seems to be more influenced by temperatures throughout summer than at the other sites. Furthermore, it is clear that precipitation has a limited effect on pine growth at the studied sites, although summer precipitation tends to have a negative effect on pine growth in Jämtland.
Description of chronologies and meteorological stations
Coefficients for correlation between monthly climate and Scots pine tree-ring residuals. Each bar represents the correlation coefficient between tree growth and mean temperature (black bars) and total precipitation (white bars) for a given month from previous October to current September. (a) Nikkaluokta; (b) Jämtland; and (c) Veolia.
Discussion
Mass balance
In general, summer balances correlate better over Scandinavia than winter balances, which have a pronounced north–south difference. This indicates that summer conditions, primarily average summer temperature, affect most Scandinavian glaciers in a similar way. This is most likely due to the regional homogeneity of summer temperatures in Scandinavia, whereas the winter conditions differ between the northern and southern regions. The explanation for this may be the position of the Arctic Front (AF) during winter. It is more likely that the AF passes the northern than the southern region. This means that storm tracks may be diverted in an apparent seesaw pattern relative to the two regions, depending on whether the AF is in a northerly or southerly position. It is important to realize that the seesaw may be a consequence of the separation distance between the two glacierized areas of northern and southern Scandinavia.
ELAs are a function of the net balances on the glaciers. Correlation coefficients (Fig. 2) are generally lower than for the net balances. This indicates that ELA may not be such a good approximation for net balance as has been suggested by Reference DyurgerovDyurgerov (1996). This may be due to the presence of very thick snowpatches around the glacier edges and in front of glacier termini on some continental glaciers, which distorts the net balance gradient.
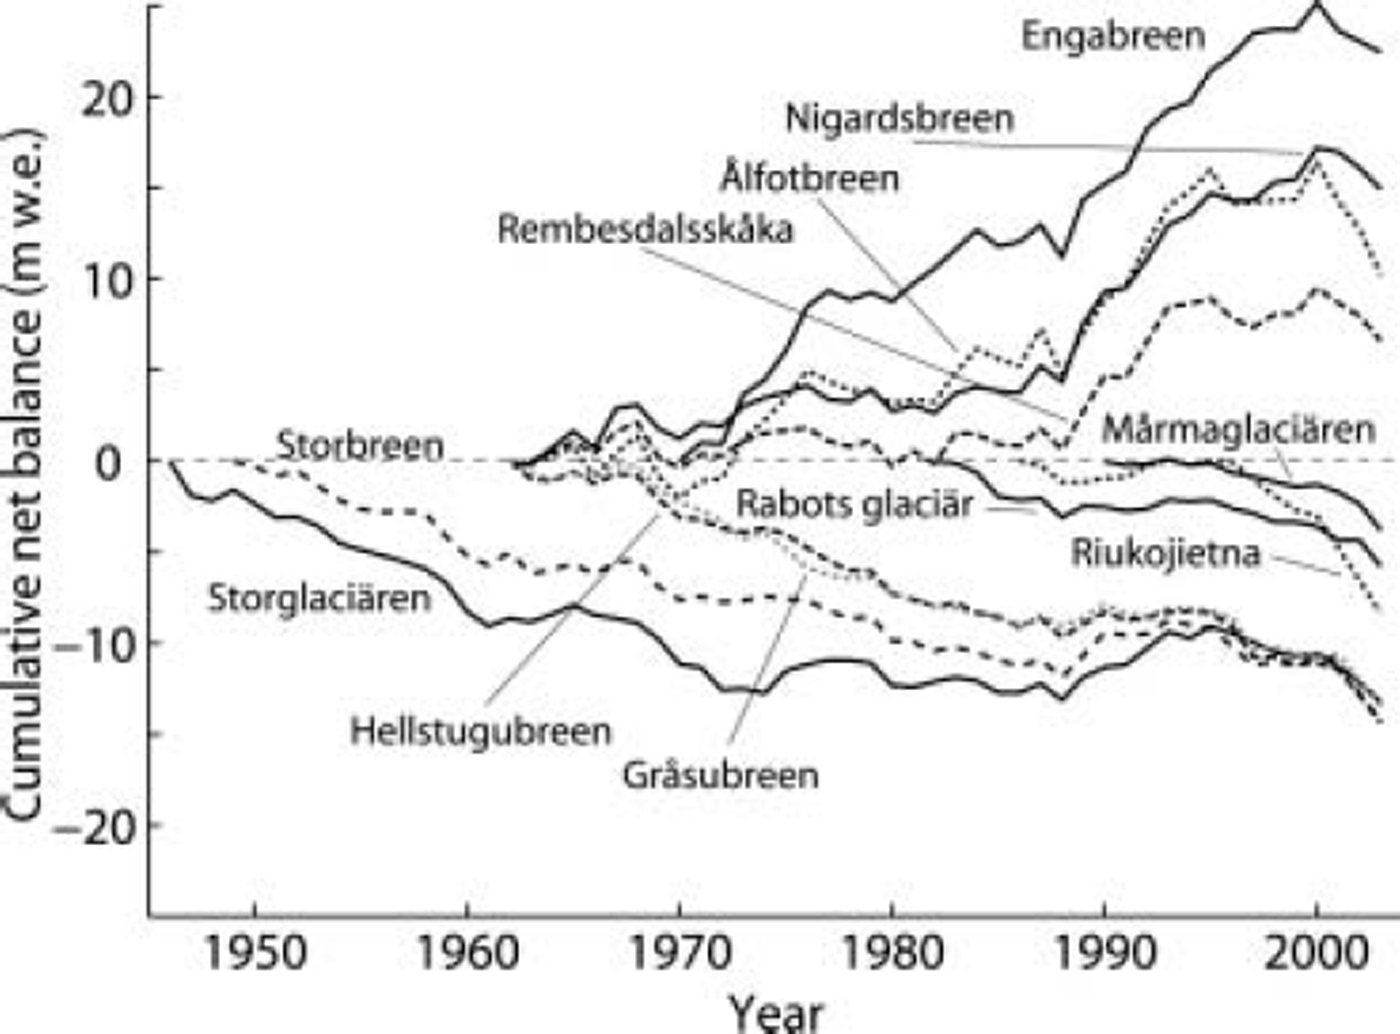
Strong correlations between net balances indicate that the year-to-year variability in net balance is similar between glaciers. This does not provide indications for the state of glacier volume change. The cumulative net balance curves for all glaciers in this study are shown in Figure 4. The curves indicate that the cumulative net balance, equivalent to a volume change of the glacier, varies between glaciers and may also have different signs indicating that glaciers may be both increasing and decreasing despite being correlated in terms of year-to-year variability. It is important to remember that what is actually measured in mass-balance measurements is the change in mass per year, or rate of mass change. The cumulative curve is thus the integration of the annual rates. High correlation coefficients between mass-balance records imply that rate changes are correlated but say nothing about the magnitude. Similar rate changes may thus result in either positive or negative volume change.
Cumulative net balances for all glaciers in the study. All balances start at an arbitrary zero balance.
Dendroclimatological data
Despite good agreement among the tree-ring data, due to the common growth responses to summer temperatures, there are clear distinctions between Nikkaluokta/Veolia and Jämtland. Pine growth at Nikkaluokta/Veolia is first and foremost determined by July temperatures, as expected close to the latitudinal (Nikkaluokta) or altitudinal (Veolia) tree line. Furthermore, both chronologies come from sites located at some distance from the Norwegian Sea, compared to Jämtland. In Jämtland, pines grow on the border between continental climate (east of the Scandinavian Mountains) and maritime climate (west of the mountains), and in this semi-maritime climate there is an additional effect of precipitation to that of temperature. The influence of winter precipitation on pine growth in Jämtland and its linkage to large-scale atmospheric variability has been described previously (Reference LinderholmLinderholm, 2002; Reference Linderholm and GunnarsonLinderholm and Gunnarson, 2005). In short, high amounts of winter precipitation, yielding a sustained snow cover that could last into late spring, may cause later initiation of cambial activity and contribute to over-saturation of soils well into summer, especially on mountain slopes that are less exposed to the sun, which in a maritime climate could result in periodically anoxic conditions and consequently poorer growth conditions. It should be noted that this effect is not necessarily instantaneous: the effect of high winter precipitation may not show up in the subsequent summer’s pine growth, but in one or more years after (Reference Linderholm and GunnarsonLinderholm and Gunnarson, 2005).
Synthesis
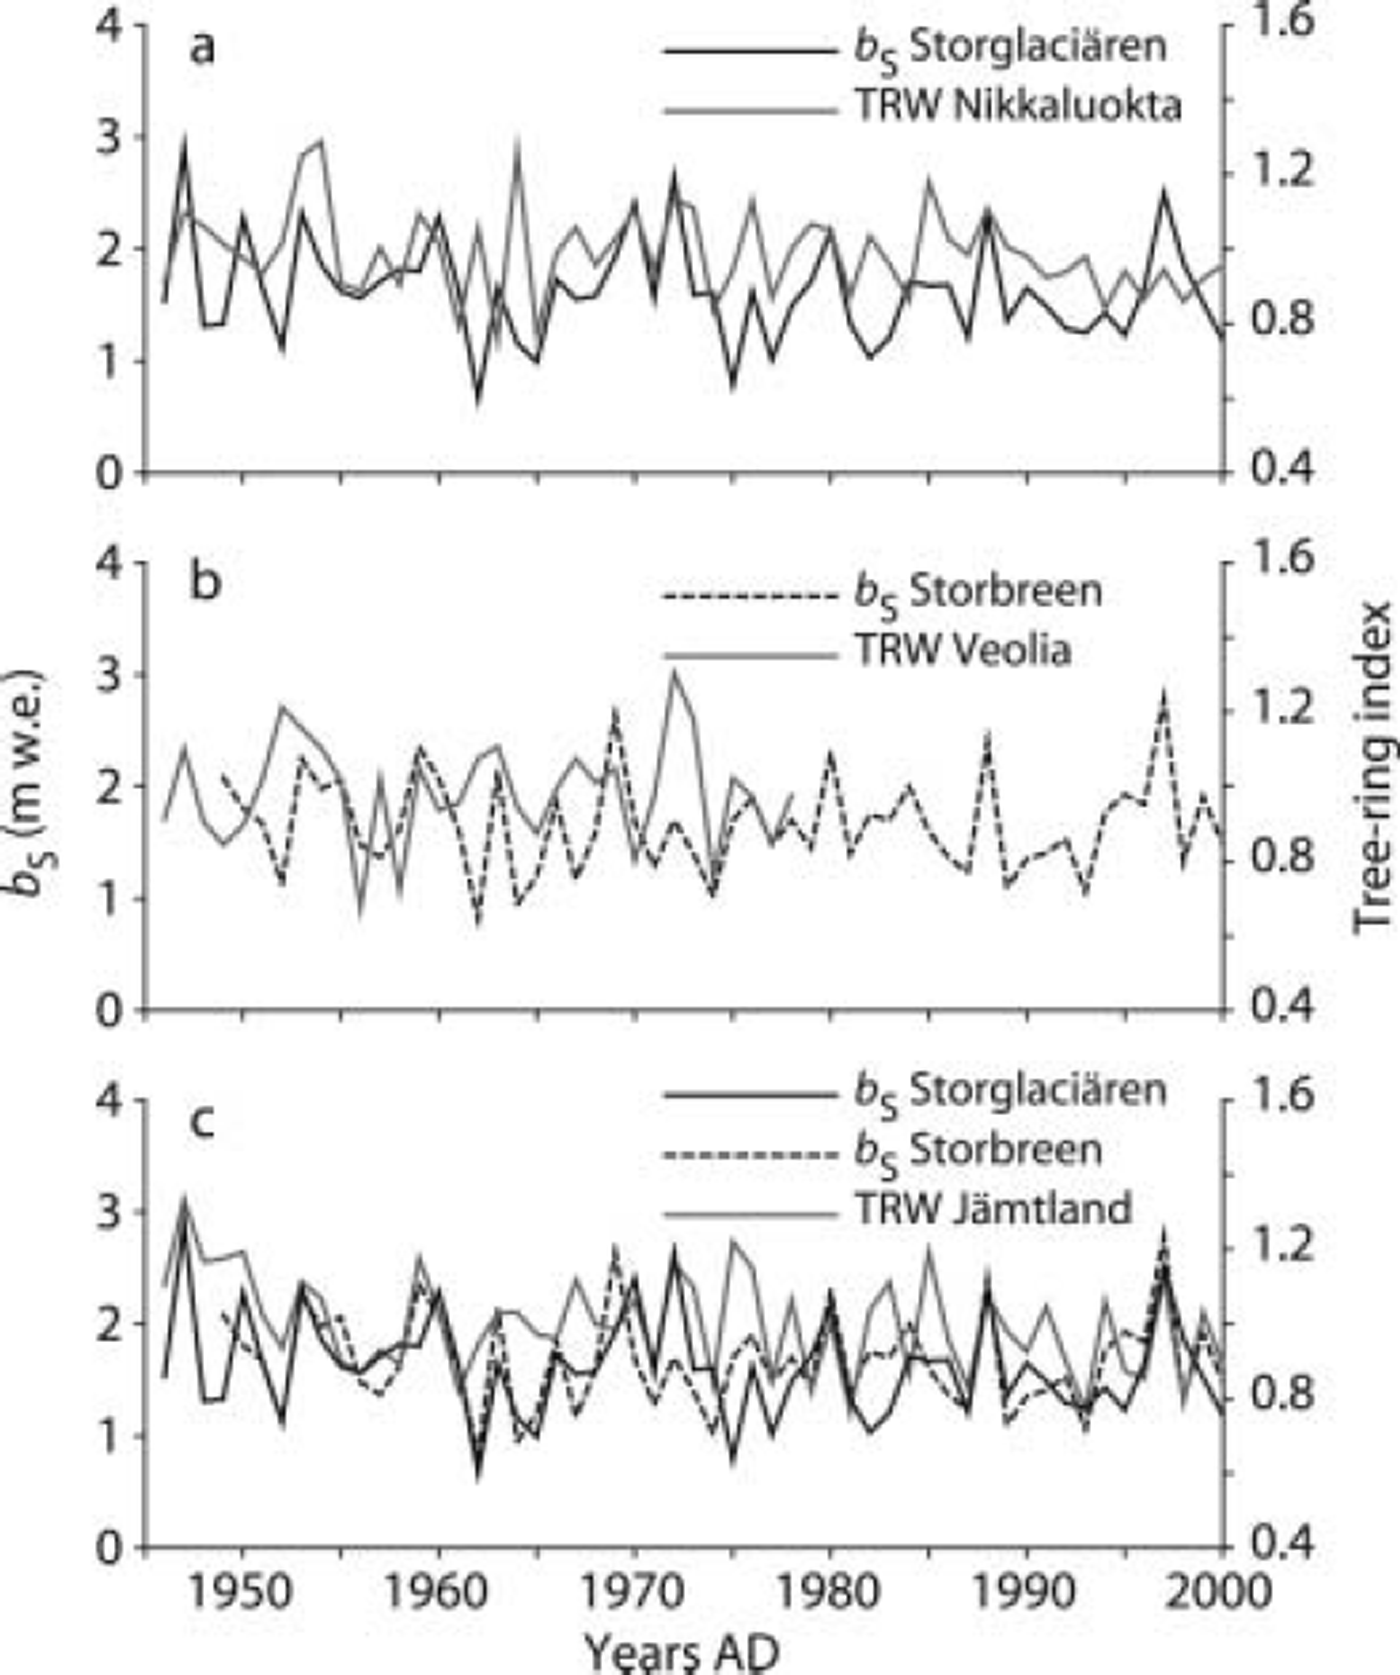
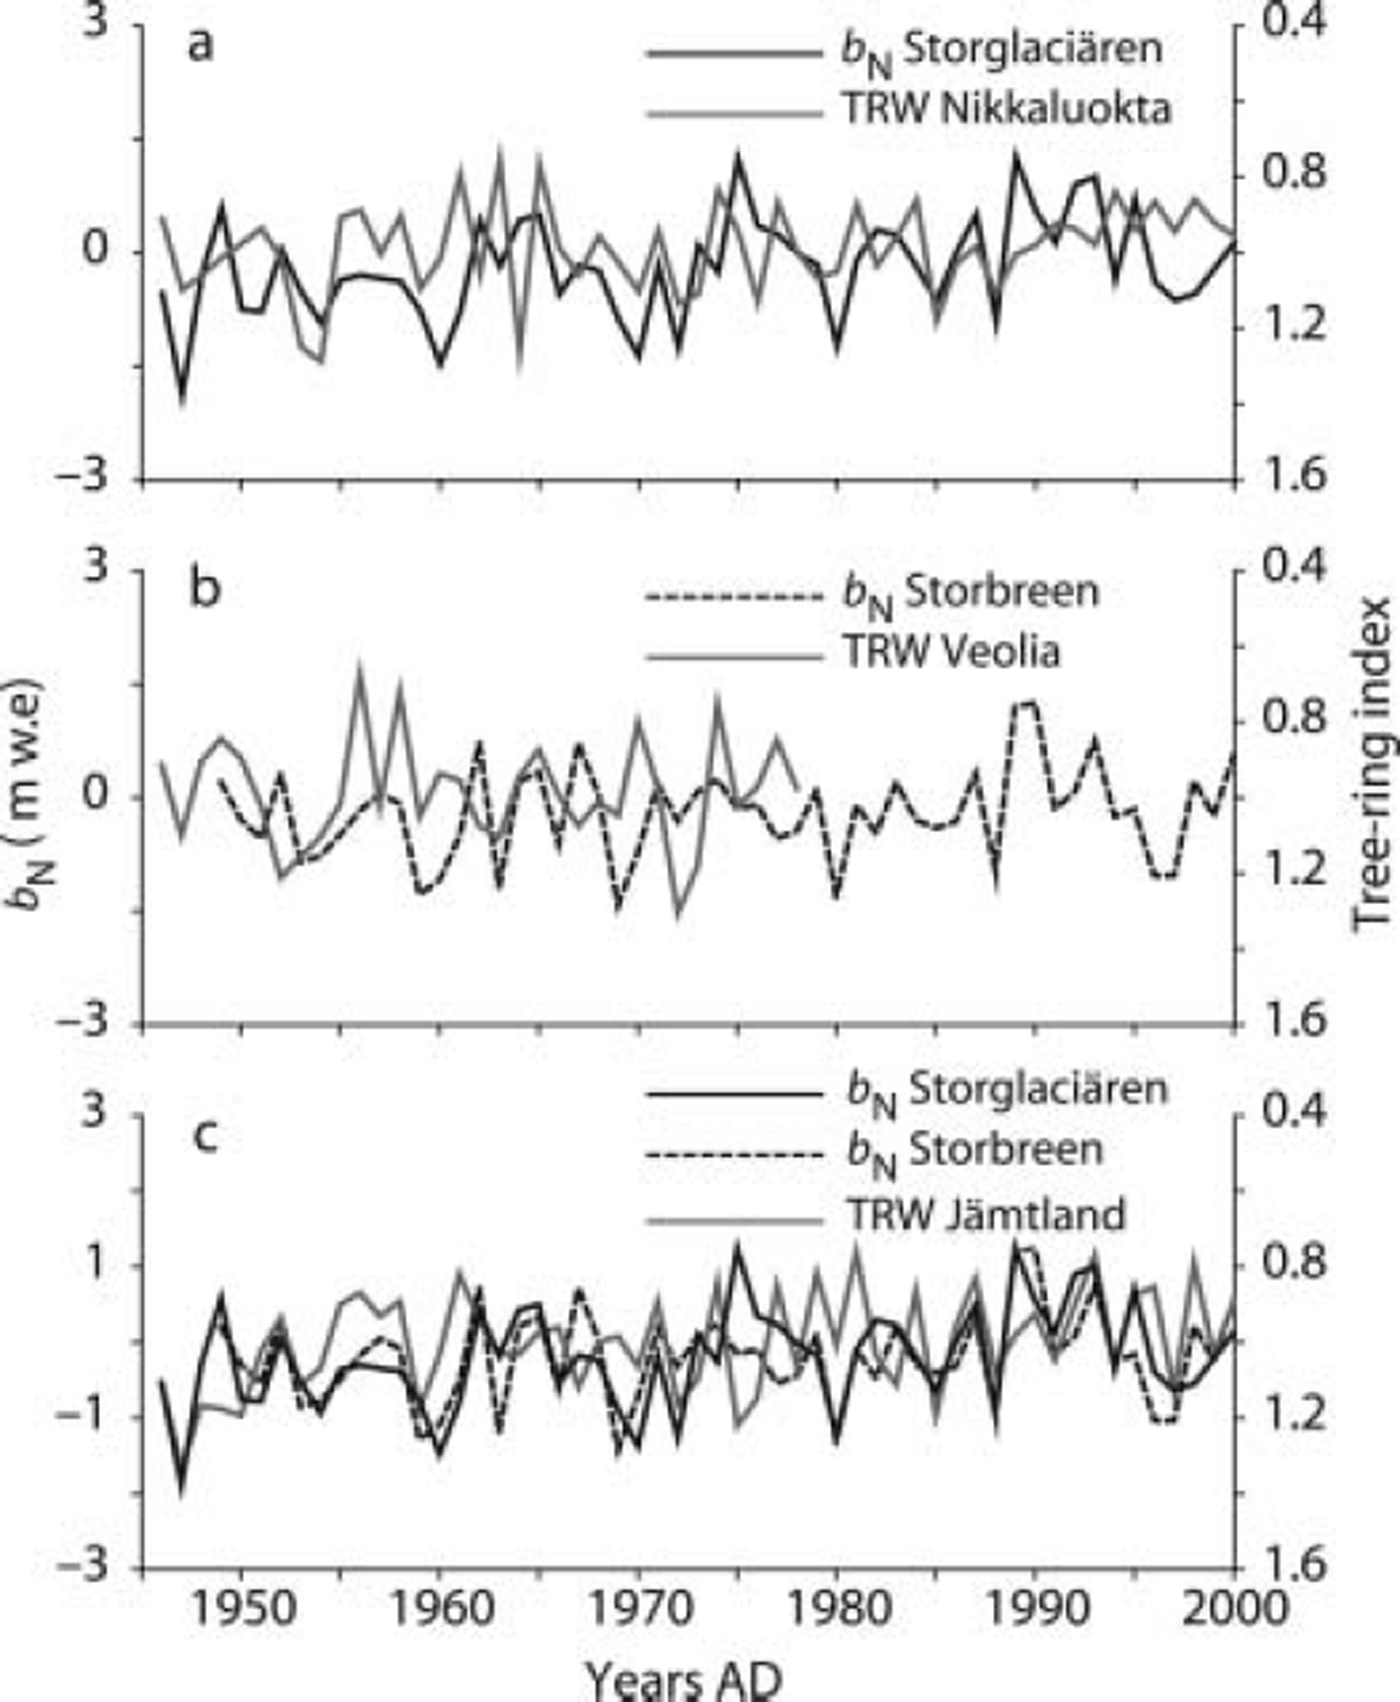
To decide to what extent the two studied climate proxy records were related and, hence, can be combined to yield further climate information, the mass-balance records with the longest measurement series were compared to the tree-ring data from the two main regions. Consequently, the maritime climate regime of south-central Norway was represented by mass-balance data from Storbreen and tree-ring data from Veolia, while the more continental climate of northernmost Sweden was represented by mass-balance data from Storglaciären and tree-ring data from Nikkaluokta. Tree-ring data alone from Jämtland (due to lack of mass-balance data from the region) represented a transition zone between the two climate regimes. From Figure 5 and Table 2 it is clear that the correspondence between b S and tree growth is low in both regions; in fact, tree growth in Jämtland was better correlated to the b S records than local tree growth. This lack of correspondence between glacier b S and tree growth is a consequence of the complexity of tree growth responses to climate, where trees will react not only to one parameter but to a combination of parameters (Reference FrittsFritts, 1976; see above). The only exception was found in Jämtland, where there was a correlation of almost 0.3 between Scots pine growth residuals and b N of both Storbreen and Storglaciären (Fig. 6). Thus, tree-ring data in Jämtland seem to have the quality of being comparable to annual glacier mass-balance data, since they contain information about winter as well as summer climate.
Residual tree-ring width chronologies (TRW) plotted against glacier summer balance records (bs). (a) Nikkaluokta vs Storglaciären; (b) Veolia vs Storbreen; and (c) Jämtland vs Storglaciären and Storbreen.
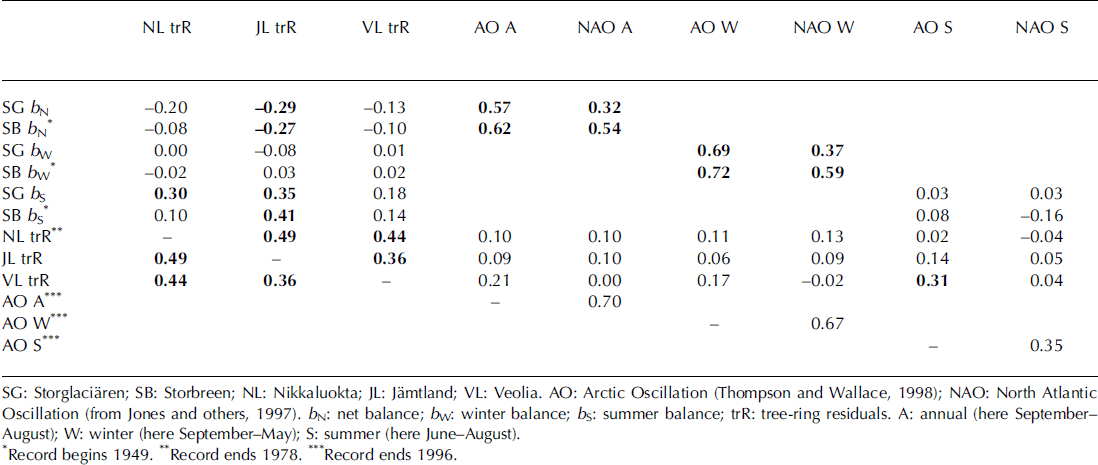
Correlation matrix of mass balance, tree-ring residuals and atmospheric circulation indices, 1946–2000. Bold numbers denote significance at the 0.05 level
Residual tree-ring chronologies plotted against glacier net balance records (bN). (a) Nikkaluokta vs Storglaciären; (b) Veolia vs Storbreen; and (c) Jämtland vs Storglaciären and Storbreen. Note the inverted scale on the righthand axes.
Similar to previous studies (Reference Nesje, Lie and DahlNesje and others, 2000; Reference Nesje and DahlNesje and Dahl, 2003), we found that b N and b W in south-central Norway are better correlated to the NAO than in northernmost Sweden. This is due to the progressively decreasing influence on climate of the NAO over 60˚ N (e.g. Reference GreatbatchGreatbatch, 2000). It is possible that the differences in the mass-balance records of the two regions can be explained by regional differences in the atmospheric circulation.
In addition, we found an even stronger correspondence between b N and b W with the AO, especially at Storglaciären. Therefore, the AO may be a better index to use when investigating the link between glacier mass balance and the atmospheric circulation in high northern latitudes. Scots pine growth in the Scandinavian Mountains does not seem to respond to atmospheric circulation variability on intraannual timescales, most likely due to the slight influence on vegetation period temperatures from the AO/NAO.
Conclusions
There are substantial differences between the climate information in glacier mass-balance data and that in tree-ring data. While there is a strong relationship between summer temperatures and glacier b S, the climate signal in b w is less readily interpreted. Similarly, tree rings are also good proxies for summer temperatures, but due to the complexity of tree growth factors other than climate, climate outside the vegetation period may also affect growth. Thus, combining glacier b S and tree-ring records will likely not yield additional information about summer temperatures. Furthermore, there are strong relationships between the atmospheric circulation, b w and b S in Scandinavia, correlations being highest during the winter season. The mass-balance/ atmospheric circulation relationship is stronger using the AO than the NAO, especially in northernmost Sweden. Periods of diverging mass-balance records from the two areas are possibly due to regional differences in the atmospheric circulation. There was no correspondence between tree growth and AO/NAO. The agreement between b N records from both maritime south-central Norway and continental northernmost Sweden and tree-ring data from Jämtland, in a transition zone between maritime and continental, suggests that mass-balance and tree-ring records from these areas may be combined to give information about climate, as a function of temperature and atmospheric circulation, over the entire year on intra-annual timescales.
Acknowledgements
Sincere thanks to everyone involved in collecting mass-balance and dendroclimatological data over the years. Critical comments from A. Nesje and Ø. Lie helped to improve the paper. N. Haakensen of the NVE provided an in-depth explanation of local Norwegian naming conventions. G. Østrem provided useful information on melt conditions at Norwegian glaciers.



