Introduction
The fall webworm, Hyphantria cunea (Drury) (Lepidoptera: Arctiidae), is an important quarantine pest in many countries. It was inadvertently introduced into Europe in 1946 and Asia in 1945 from its native North American range and, currently, is found in at least 20 countries in Europe, two in Eurasia, and ten in Asia (Sullivan & Ozman-Sullivan, Reference Sullivan and Ozman-Sullivan2012). In China, this pest was first reported in Liaoning Province in 1979 and has since spread rapidly to Beijing, Tianjin, Hebei, Henan, Shandong and Jiangsu, where it has caused enormous damage to forestry and horticulture plants (Ji et al., Reference Ji, Zhang, Hewitt, Kang and Li2003). At this time, studies on this pest have focused mainly on biology, ecology, and control management. However, genetic studies on H. cunea are limited due to the lack of effective molecular markers. Gomi et al. (Reference Gomi, Muraji and Takeda2004) studied the introduced fall webworm in Japan and Korea using three regions of mitochondrial DNA (mtDNA) sequences, and found that all these populations share identical haplotype. However, mtDNA is uniparental inheritance and provides a single perspective. Thus, more effective molecular markers should be used to examine genetic diversity, explore the origin of invasive populations and migratory patterns, and for developing effective strategies to control this invasive pest.
Microsatellites or simple sequence repeats (SSR) are tandem repeats of one to six nucleotides widely distributed in the nuclear genomes of most taxa. Many desirable traits of microsatellites, such as easy sample preparation and high information content (Selkoe & Toonen, Reference Selkoe and Toonen2006), make it widely used for population genetic studies, especially in invasive species, to examine the genetic structure of newly established populations, their origin and routes of invasion. Ascunce et al. (Reference Ascunce, Yang, Oakey, Calcaterra, Wu, Shih, Goudet, Ross and Shoemaker2011) investigated the global invasion history of the fire ant Solenopsis invicta based on 66 microsatellite markers. Combined with genetic, demographic, and historical information, 27 microsatellite loci were used to investigate the evolutionary history of invasive black rat populations in Senegal (Konecny et al., Reference Konecny, Estoup, Duplantier, Bryja, Ba, Galan, Tatard and Cosson2013). However, it is difficult to develop microsatellites for Lepidoptera since they are always associated with repetitive sequences, microsatellite families, and mobile elements in the flanking regions (Meglécz et al., Reference Meglécz, Petenian, Danchin, D'Acier, Rasplus and Faure2004, 2007; Zhang, Reference Zhang2004; Tay et al., Reference Tay, Behere, Batterham and Heckel2010). A further problem when examining Lepidoptera is the high frequencies of null alleles because of their high mutation frequencies in the flanking region, which may result from their association with transposable elements (Meglécz et al., Reference Meglécz, Anderson, Bourguet, Butcher, Caldas, Cassel-Lundhagen, d'Acier, Dawson, Faure and Fauvelot2007; Tay et al., Reference Tay, Behere, Batterham and Heckel2010). To obtain a sufficient number of microsatellite markers for population analysis, researchers obtained more microsatellite sequences by screening multiple SSR-enriched libraries or using high-throughput sequencing technology (Arias et al., Reference Arias, Blanco, Portilla, Snodgrass and Scheffler2011; Malausa et al., Reference Malausa, Gilles, Meglécz, Blanquart, Duthoy, Costedoat, Dubut, Pech, CASTAGNONE-SERENO and Delye2011; Sinama et al., Reference Sinama, Dubut, Costedoat, Gilles, Junker, Malausa, Martin, Neve, Pech, Schmitt, Zimmermann and Meglécz2011). However, these approaches are still time-consuming and labor-intensive to screen the microsatellite markers from a huge number of sequences. Therefore, further studies are required for stringent selection of microsatellite-containing sequences for primer design by eliminating redundant sequences or examining cryptic repeated elements on unique sequences.
The mutational mechanism of microsatellites is complex and controversial but is generally believed to arise from slippage and proofreading errors during DNA replication (Eisen, Reference Eisen, Goldstein and Schlötterer1999). There are also many other patterns accounting for the generation of new alleles, such as indels in the flanking sequences (Matsuoka et al., Reference Matsuoka, Mitchell, Kresovich, Goodman and Doebley2002). Two mutation models are generally used to identify microsatellites, namely, the stepwise mutation model (SMM) and the infinite allele model (IAM) (Bhargava & Fuentes, Reference Bhargava and Fuentes2010). Information regarding the mutation patterns of the specific SSR loci can be used to select appropriate mutation models and combinations of markers in different studies (Yang et al., Reference Yang, Sun, Xue, Zhu and Hong2012). Some studies suggested that IAM is more appropriate for SSR loci with complex mutation patterns (Anderson et al., Reference Anderson, Su, Roddam and Day2000; Matsuoka et al., Reference Matsuoka, Mitchell, Kresovich, Goodman and Doebley2002; Yang et al., Reference Yang, Sun, Xue, Zhu and Hong2012).
In the present study, we constructed microsatellite-enriched libraries and isolated microsatellite primers for H. cunea. We aimed to (i) optimize the microsatellite development method; (ii) investigate possible correlations between the sequence characteristics and the performance of corresponding primers; and (iii) obtain mutation information on H. cunea microsatellite loci and examine their effects on the estimation of population differentiation. These are the first set of microsatellites for H. cunea and can be used to examine genetic structure, genetic diversity, and dispersal patterns of H. cunea.
Materials and methods
Sample collection and DNA extraction
A total of 72 webs of H. cunea larvae were collected from three geographic sites in China from August to September in 2012 (table 1). The individuals were stored in 98% alcohol and frozen at −80°C. Total genomic DNA was extracted from the abdominal segments of individual larva using the EZgeneÔ Insect gDNA Miniprep Kits (BIOMIGA, San Diego, CA, USA). A single individual larva per web was sampled for microsatellite genetic analyses. Genomic DNA from four individuals was used for isolation of microsatellites.
Sample information.

Isolation of microsatellites
We developed microsatellites by screening enrichment libraries following the methods adapted from Kijas et al. (Reference Kijas, Fowler, Garbett and Thomas1994) and Techen et al. (Reference Techen, Arias, Glynn, Pan, Khan and Scheffler2010). DNA from four individuals was digested with the restriction enzymes Alu I, Hae III, and Rsa I, respectively, and with combinations of Alu I+Hae III, Alu I+Rsa I, and Hae III+Rsa I. DNA fragments approximately 300–800 bp in size were isolated using the TIANgel Midi Purification Kit (Tiangen, China) and ligated to the assembly linkers (5′-GTTTAGCCTTGTAGCAGAAGC-3′ and 5′ -PhosGCTTCTGCTACAAGGCTAAACAAAA-3′). The ligation products were purified and amplified using one linker as a primer on the Applied Biosystems Veriti Thermal Cycler (Applied Biosystems, Foster City, CA, USA) in a final volume of 30 μl with GoTaq Colorless master Mix (Promega, Madison, WI, USA) for 20 cycles (30 s at 95°C, 90 s at 60°C, and 90 s at 72°C). Five different types of 5′-biotinylated oligo repeats, such as (AC)15, (AG)15, (AAT)8, (GAA)8, and (GATA)6, were hybridized to the polymerase chain reaction (PCR) products under different conditions described by Techen et al. (Reference Techen, Arias, Glynn, Pan, Khan and Scheffler2010). The reaction mixtures were incubated with streptavidin MagneSphere paramagnetic particles (Promega) to capture DNA fragments containing microsatellite motifs. After washing away the non-binding fragments and eluting the single-stranded DNA from biotinylated oligos, the captured DNA fragments were amplified using the same PCR reactions used in the ligation step. The PCR products were ligated into pGEM-T Easy Vector (Promega) and transferred into TOP10 cells (Tiangen, China). Positive clones selected from the Luria-Bertani (LB) agar plates, which were designed for blue-white spot screening (Sambrook et al., Reference Sambrook, Russell and Russell2001), were incubated at 37°C for 1 h in 96-well plates with 30 μl LB medium containing ampicillin (100 μg ml−1). Cells were stored at 4°C temporarily or used for colony PCR immediately. The PCR protocol of Wang et al. (Reference Wang, Trigiano, Windham, Devries, Scheffler, Rinehart and Spiers2007) was used to confirm the microsatellite motif in selected positive clones. All positive clones containing microsatellite motifs were transferred into 2-ml tubes with LB medium and incubated at 37°C for 16 h. The plasmids were purified and sequenced with primer M13F from one strand using the ABI PRISM 3730XL DNA Analyzer (Applied Biosystems).
Sequence analysis
Original sequences were aligned using CLUSTALW (Thompson et al., Reference Thompson, Higgins and Gibson1994) embedded in MEGA version 5.1 (Tamura et al., Reference Tamura, Peterson, Peterson, Stecher, Nei and Kumar2011) with default parameters to distinguish and delete vector and linker sequences manually. All sequences compiled in fasta format were analyzed using the Microfamily program (Meglécz, Reference Meglécz2007) with default parameters to identify flanking sequence similarities among different microsatellite loci. CENSOR software tool online (Kohany et al., Reference Kohany, Gentles, Hankus and Jurka2006) was used to detect the presence of transposable elements by blasting against all repetitive or mobile elements in the database.
Primer design
We selected sequences and designed primers using the QDD program (Meglécz et al., Reference Meglécz, Costedoat, Dubut, Gilles, Malausa, Pech and Martin2010) with the following stringent criteria: (i) sequences were not sorted by tag and the adapter did not have to be removed; (ii) consensus sequences were made as the default coefficient; (iii) there were at least five motif repeats for target microsatellites; (iv) PCR product lengths ranged between 90 and 400 bp; and (v) the annealing temperature of primers ranged from 52 to 68°C, and the difference in annealing temperature in one pairwise primer was <4°C.
Primer testing and polymorphism detection
We used a three-step procedure to screen the primers: two steps for the initial test and one for the polymorphism test. The three procedures are described below.
First, eight larvae from three geographic populations (three from the DL population, three from HD, and two from CD) were used initially to test primer effectiveness. Amplification was performed in a 15-μl reaction mixture using GoTaq Green Master Mix (Promega). The PCR program consisted of a touchdown regime, as follows: 5 min at 95°C, followed by ten cycles of 95°C for 30 s, 62°C (or 56°C, according to the lower annealing temperature for primer pairs) for 45 s (annealing temperature was reduced by 0.5°C per cycle), and 72°C for 45 s, followed by 25 cycles of 95°C for 30 s, 55°C (or 50°C) for 45 s, and 72°C for 45 s, and a final extension at 72°C for 15 min. PCR products were analyzed on 8% non-denaturing polyacrylamide gels and then stained with ethidium bromide. The primers generating polymorphic bands were retained as candidate primers.
In the second step, a M13 tail was added to the 5′ end of the candidate forward primers following the methods of Schuelke (Reference Schuelke2000). The PCR mixture contained three primers (0.04 μM forward primer, 0.16 μM reverse primer, and 0.32 μM unlabeled M13 primer) in a final volume of 10 μl. The cycling condition was as follows: 5 min at 95°C; followed by 30 cycles of 95°C for 30 s, 56°C (or 50°C) for 45 s, and 72°C for 45 s, followed by eight cycles of 95°C for 30 s, 53°C for 45 s, and 72°C for 45 s, and a final extension at 72°C for 20 min. The amplifications were visualized as discussed above. The annealing temperature of the primer pairs was above 56°C initially, and if no or weak amplification was observed, the PCR was repeated at an annealing temperature of 50°C. The primer pairs that amplified PCR products in less than four individuals, produced multiple bands, or produced smears were discarded.
Finally, 72 H. cunea larvae from three populations were used to analyze the genetic characteristics of each primer. The PCR reaction mixture and cycling conditions were confirmed in the second step. Fluorescently labeled (FAM, HEX, and ROX) M13 ‘universal’ primers were designed to replace the former unlabeled M13 primer. The amplified PCR fragments were analyzed on the ABI 3730xl DNA Analyzer (Applied Biosystems) using the GeneScan 500 LIZ size standard (Applied Biosystems). Microsatellite genotypes were obtained using the software GENEMAPPER4.0 (Applied Biosystems).
BLAST screening and allele sequencing
Corresponding sequences of polymorphic loci were screened using BLASTx and BLASTn in NCBI databases. Different alleles of each locus were amplified in a 15-μl reaction mixture using unlabeled primers. The products were then sequenced after cloning and transformed as discussed in the microsatellite isolation section. Sequences were aligned and edited using MEGA5.1.
Genetic statistical analysis
The genotyping data determined from GENEMAPPER were detected for stuttering and large allele dropouts using MICRO-CHECKER 2.2.3 (van Oosterhout et al., Reference van Oosterhout, Hutchinson, Wills and Shipley2004). FREENA (Chapuis & Estoup, Reference Chapuis and Estoup2007) was used to estimate null allele frequencies. Diversity statistics such as allele frequencies, observed heterozygosity (H O ), expected heterozygosity (H E ), and polymorphic information content (PIC) were calculated using the macros Microsatellite Tools (Park, Reference Park2001). Genepop 4.0.11 was used to estimate (i) linkage disequilibrium among loci within each population and (ii) deviation from Hardy–Weinberg equilibrium at each locus/population pair. MSA 4.05 (Dieringer & Schlotterer, Reference Dieringer and Schlotterer2003) and RSTCALC 2.2 (Goodman, Reference Goodman1997) were used, respectively, to compute estimates of F ST and R ST , and their significance was analyzed using 10,000 permutations. SPAGeDi 1.4 (Hardy & Vekemans, Reference Hardy and Vekemans2002) was used to detect the contribution of allele size to population differentiation. The program LOSITAN (Antao et al., Reference Antao, Lopes, Lopes, Beja-Pereira and Luikart2008) was used to detect putative loci under selection with two options: ‘neutral mean F ST ’ and ‘force mean F ST ’.
Results
Microsatellite cloning efficiency
By screening 24 enrichment libraries, we obtained 573 positive colonies from 2902 putative microsatellite colonies. The microsatellite cloning efficiency averaged 19.75%, and was highest in (AC)15 libraries (32.92%), followed by (GATA)6 (16.3%) and (AG)15 (15.8%). In our study, we did not observe any positive clones (in 384 clones) for (AAT)8 probes. After discarding poor sequences, short sequences and false positives (repeat number <4), 531 sequences containing microsatellites were retained for sequence analysis and subsequent microsatellite primer design.
Sequence characteristics
According to the results of Microfamily software, sequences isolated from enrichment libraries were sorted into four categories: Unique, UnBLASTable, Grouped, and Redundant. After eliminating redundant sequences, we redefined the four categories as follows: Unique (257 sequences), UnBLASTable (32 sequences), Unique-from-Redundant (35 sequences), and Grouped (67 sequences). Unique-from-Redundant included sequences classified as Unique after identification of redundant sequences. The Grouped sequences were based on similarities between the flanking regions of microsatellite loci. Two groups from Grouped were represented as a schematic alignment in fig. 1 to provide an example of the similarity patterns.
Schematic representations of two grouped (Gr14 and Gr58) sequences. Characteristics and numbers on the left represent the sequence ID. Numbers on the black solid lines indicate the sequence length (bp). The bars in stripy, white, and black represent similar regions within a given group. The boxes in gray, white, and black represent different repeat motifs. The bars or semi-circles in gray represent putative unique DNA sequences in flanking regions. The dashed line indicates gaps in the sequences.

After eliminating the redundant sequences, 391 sequences were submitted to the Censor software tool online using the default settings to scan the repetitive or mobile elements comprehensively. There were 291 matches with known repetitive or mobile elements, including transposons (45.7%), non-long terminal repeat(non-LTR) retrotransposons (31.3%), LTR retrotransposons (18.2%), and endogenous retroviruses (3.1%). A total of 73 repetitive or mobile elements were annotated in the Insecta taxon, and 29 belonged to Lepidoptera. A total of 51 of 67 Grouped sequences had the most hits (76.1%) against known repetitive or mobile elements, while the proportions of mobile elements in Unique and UnBLASTable were 55.1 and 46.9%, respectively.
Development of microsatellite loci
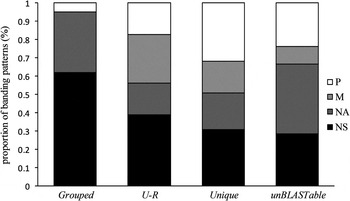
We designed 272 primers from 213 sequences using the QDD program. Banding patterns of PCR amplification using specific primers were annotated as none-amplification, non-specific, monomorphism, and polymorphism. The proportion of each banding pattern in four types of sequences was summarized in fig. 2. Polymorphism bands in Unique showed the highest proportion (31.75%), followed by ‘UnBLASTable’ (23.81%). A total of 73 primers revealed polymorphisms among eight tested individuals on non-denaturing polyacrylamide gels, of which 51 loci showed ideal stability and repetition after adding a M13 tail to the 5′ end of the forward primers.
Summary of sequence characteristics and banding patterns in the 100% stacked bar chart. U–R, unique-from-redundant; NA, none-amplification; NS, non-specific; M, monomorphism; P, polymorphism.

Microsatellite loci characterization
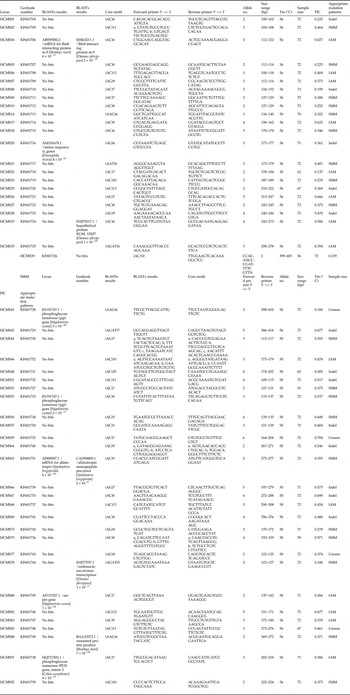
DNA locus sequences were screened using BLASTx and BLASTn with ‘Organism Optional’ for insects or Insecta. The sequences that had expect values of 1 × 10⁻⁴–1 × 10−64 for BLASTn and 1 × 10⁻⁴–1 × 10⁻²⁰ for BLASTx were shown in table 2.
Characteristics of 51 microsatellite loci isolated from Hyphantria cunea.

T m, annealing temperature; Allele no., number of alleles detected; sample size, number of insects successfully genotyped from the 72 insects; PIC, polymorphism information content; appropriate mutation patterns, possible mutation model for locus.
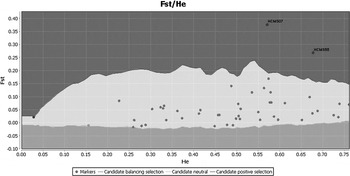
A total of 51 loci were characterized in three populations of H. cunea (table 2). The number of alleles per locus ranged from 2 to 5 with an average of 3. The PIC ranged from 0.027 to 0.704 (average 0.404). The observed heterozygosities (H O ) and expected heterozygosities (H E ) ranged from 0 to 0.958 and 0 to 0.773, respectively (table S1). Loci HCMS04 and HCMS08 had only one allele observed in one or two populations, whereas loci HCMS20, HCMS25, and HCMS53 had only homozygotes observed in one or two populations even though expected frequency of heterozygotes were high. A total of 18 out of 153 locus/population combinations deviated significantly from HWE (after sequential Bonferroni correction, P < 0.05). In addition, significant linkage disequilibrium was detected in one pair of loci (1275 pairs in total) across all populations (after sequential Bonferroni correction, P < 0.05). According to LOSITAN results, two loci (HCMS07 and HCMS55) were grouped into the candidate category for positive selection, and the remainder fell into the neutral category (fig. 3).
LOSITAN results for 48 loci across samples. The results were the same under the IAM of mutation and SMM. Loci located in the dark gray region are candidates for positive selection, light gray for balancing selection, and white for neutral. Loci HCMS41, HCMS59, and HCMS77 were not considered for this or further analysis, since the obtained sequences did not correspond exactly to the accepted sequences.

Microsatellite mutation patterns
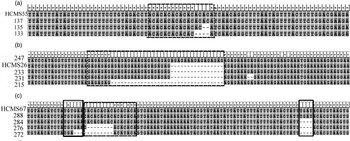
A total of 140 different alleles, accounting for 94.47% of the allele frequency in population genotyping, were sequenced to investigate the mutation mechanisms of H. cunea microsatellites. Sequence analysis of these alleles revealed that three types of mutation events resulted in almost all of the allelic diversity (fig. 4), excluding locus HCMS85. First, for 20 out of 48 loci examined, differences in the number of repeat motifs were responsible for length variation, and the length distribution was strict in single-step mutations (fig. 4a). SMM may be more appropriate for these loci. The second mutation events were similar to the first type, but the length distribution was not strict in single-step mutations of 14 loci (fig. 4b). These mutations may be explained using IAM. Third, in the other 13 loci, multiple sources of length variation, such as the number of repeat motifs and indels in the flanking region, contributed to the changes in length (fig. 4c). These mutations were defined as ‘Indel’. However, locus HCMS85 was not grouped in the above three types because the sequences of its two alleles (sizes of 275 and 276 bp) had eight base substitutions that did not contribute to the variation in length. In addition, base substitutions were common in these microsatellites, with 22 loci in the flanking region, six loci in repeat region, and 16 loci in both regions.
Part of the allele sequence representation of mutation patterns in Hyphantria cunea microsatellites. (a) Mutation possibility in SMM, (b) mutation possibility in IAM, and (c) indels in the flanking region. The dashed boxes indicate the repeat motifs, and the black boxes indicate indels in the flanking region.

Population differentiation estimation
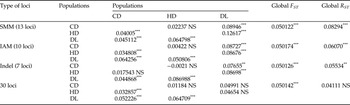
Pairwise and global F ST and R ST were calculated to estimate differentiation among three populations. Global F ST and R ST considering all 48 loci showed low but highly significant genetic differentiation (global F ST = 0.059368, P < 0.001; global R ST = 0.04792, P < 0.001). Excluding loci presenting null alleles, pairwise and global F ST and R ST were tested using 30 loci in three types of mutations, respectively, among three populations to identify the estimator (F ST or R ST ) more suitable for the present data set (table 3). Pairwise F ST and R ST values were not consistent among these three cases, but both estimators showed similar results for the same case. In three cases, all global R ST and the majority of pairwise R ST were slightly higher than their counterparts, F ST . However, allele size permutation tested with SPAGeDi 1.4 did not detect any significant contribution of allele size to population differentiation. After pooling the 30 loci, paired F ST values were still highly significant and global F ST was consistent for three cases, while all pairwise of R ST and global R ST showed no significance; global R ST values were smaller than those in the three cases and the global F ST . A significant correlation was observed between pairwise estimates of F ST and R ST (Spearman r = 0.809; P < 0.001).
Pairwise R ST (right above diagonal) and F ST (left below diagonal) matrix, global F ST , and R ST for three types of microsatellites.

Type of loci, appropriate mutation patterns; CD, HD, and DL are the sample location abbreviations as in table 1; NS, non-significant; * P < 0.05; ** P < 0.01; *** P < 0.001.
Discussion
Development of microsatellites
Although the microsatellite cloning efficiency in Lepidoptera was very low in previous reports (Tsuchida et al., Reference Tsuchida, Saigo, Tsujita, Takeuchi, Ito and Sugiyama2003; Zhang, Reference Zhang2004; Endersby et al., Reference Endersby, McKechnie, Vogel, Gahan, Baxter, Ridland and Weeks2005; Petenian et al., Reference Petenian, Meglécz, Genson, Rasplus and Faure2005; Takahashi et al., Reference Takahashi, Kikuchi, Ohnishi and Tsuji2005; Ishiguro & Tsuchida, Reference Ishiguro and Tsuchida2006; Delamaire et al., Reference Delamaire, Esselink, Samiei, Courtin, Magnoux, Rousselet and Smulders2010), we did not encounter a problem with cloning efficiency. The microsatellite cloning efficiency averaged 19.75% in this study, and was highest in (AC)15 libraries (32.92%). By searching the ‘web of science’, we found 62 studies examining microsatellite development in Lepidoptera species by screening SSR-enriched libraries during the period of 2001–2014; 37 of these studies mentioned or calculated the cloning efficiency. The cloning efficiency in the 37 reports ranged from 0.65 to 83.33%, with 0–10% in seven papers, 10–30% in 14 papers, 30–50% in seven papers, and 50–85% in nine papers, respectively. Based on these results, the abundance of microsatellite sequences varied considerably among different species of Lepidoptera. The previously reported scarcity of microsatellites in Lepidoptera species does not apply to the whole order. However, the development of microsatellite in Lepidoptera remains challenging because of inherent problems in the genome, such as flanking region similarity between loci, microsatellite association with mobile elements (Meglécz et al., Reference Meglécz, Petenian, Danchin, D'Acier, Rasplus and Faure2004, 2007; Zhang, Reference Zhang2004). In the current study, sequences in the Grouped type had the most hits (76.11%) against the database of mobile elements, suggesting that they were associated with mobile elements or cryptic repeated elements.
By examining the sequence characteristics and the performance of corresponding primers, the results showed that Unique sequences were the best candidates for primer design, followed by unBLASTable. Approximately 80% of polymorphism primers in this study were designed based on unique sequences. However, Unique-from-redundant sequences were not the second best option in our study, as recommended by Meglécz (Reference Meglécz2007). A total of 20 out of 21 primers designed for Grouped sequences showed none-amplification or non-specific banding patterns. Meglécz et al. (Reference Meglécz, Anderson, Bourguet, Butcher, Caldas, Cassel-Lundhagen, d'Acier, Dawson, Faure and Fauvelot2007) indicated that Grouped microsatellites are unlikely to be good candidates for single locus genotyping purposes since flanking region similarities can lead to multiple locus amplifications and unclear banding patterns. In addition, sequences in the Grouped type are more likely associated with mobile elements or cryptic repeat elements, as discussed previously. Thus, Grouped sequences should be ignored for SSR primer design, which will save time and increase the efficiency of SSR marker development. Actually, 17.1% of sequences (after eliminating redundant sequences) were sorted into 20 Grouped types in our study.
Microsatellite characteristics
Although 48 microsatellite markers were developed in this study, the number of alleles per locus was limited, and the majority had only two alleles. This may be due to the genetic bottleneck that occurs during the invasive process of this insect. Many loci developed in this study deviated from Hardy–Weinberg equilibrium in different populations, possibly due to heterozygote deficiencies and the presence of null alleles, which were observed in most Lepidoptera microsatellites (Sinama et al., Reference Sinama, Dubut, Costedoat, Gilles, Junker, Malausa, Martin, Neve, Pech, Schmitt, Zimmermann and Meglécz2011). Besides, loci HCMS53 (29%) and HCMS75 (18%) showed high amplification failure rates. This case is common in the Lepidoptera (Perera et al., Reference Perera, Blanco, Ballard, Silva-Brandao, Domingues and Abel2011). According to the neutral test using LOSITAN, several loci were candidates for positive selection. Meanwhile, they deviated from Hardy–Weinberg equilibrium in some populations. This suggested that the deviations were due not only to the presence of null alleles, but also to selection. Furthermore, locus S55 showed homology (E value = 2 × 10⁻¹¹) to the phosphoglucose isomerase gene, which is considered an important locus underpinning evolutionary adaptation (Karl et al., Reference Karl, Hoffmann and Fischer2010). These loci may be important when examining biological patterns, but they should be excluded from analyses based on neutral assumptions (Selkoe & Toonen, Reference Selkoe and Toonen2006). With the development of high-throughput sequencing and biotin-enrichment protocols, a sufficient number of microsatellites can be obtained for population analysis in Lepidoptera.
Mutation patterns
In this study, we divided the mutation patterns of H. cunea microsatellites into three types. Besides the length variation, base substitutions are common in microsatellite loci of Lepidoptera and are a primary cause of the presence of null alleles (Hoffman & Nichols, Reference Hoffman and Nichols2011). This was further supported by loci HCMS75, HCMS44, and HCMS46, which had more than one location appropriate for primer design. In these cases, base substitutions in primer locations showed linkage with mutations in the repeat region, but not all corresponding allele sizes were amplified using the primers design based on these locations. In loci HCMS75, two pairs of primers had the same target repeat region. There were three allele sizes (335, 337, and 339 bp) detected using the first pair of primers but two (362 and 364 bp) using alternative primers. By examining these sequences, we found that alleles 337 and 339 were equivalent to 362 and 364, respectively, and allele 335 contained a T→G mutation at the fourth base from the 3′ end of alternative forward primers, and would not likely be applicable for PCR amplification. Base substitutions caused not only null alleles, but also genotyping confusion. In locus HCMS85, sequences of two alleles, 275 and 276, had eight base substitutions, which did not contribute to the length variation. Too many base substitutions may change the spatial structure of single-stranded DNA or affect denaturation efficiency when examined on a genetic analyzer.
Estimation of population differentiation
The estimation of population differentiation or the knowledge of genetic structure using genetic markers is central to many research fields. For microsatellites, F ST (Weir & Cockerham, Reference Weir and Cockerham1984) and R ST (Slatkin, Reference Slatkin1995) are commonly used to investigate the genetic structure of populations. F ST relies solely on allele identity information and assumes an IAM, while R ST accounts for allele size information and assumes an SMM. Both measures have advantages and disadvantages (Balloux & Lugon-Moulin, Reference Balloux and Lugon-Moulin2002). F ST is a simple function of the number of migrants but is sensitive to mutation rates when migration is low. R ST is independent of the mutation rate but is deflated when the mutation pattern deviates from a strict SMM. Another drawback of R ST is that its high variance allows F ST estimates to outperform R ST even under the strictest SMM (Balloux & Lugon-Moulin, Reference Balloux and Lugon-Moulin2002). Based on our results, F ST performed better than R ST for three reasons: (i) F ST is more precise than R ST according to the significance test, although the values of differentiation computed by two estimators were similar; (ii) based on the recent introduction of this insect to China (approximately 30 years ago), the migration rate may be high and mutation may not have contributed to differentiation among populations; (iii) after pooling the loci (30 loci) together, R ST no longer showed significant population differentiation as it was in the three cases (table 3), which may be associated with mutation patterns differences between three types.
The supplementary material for this article can be found at http://www.journals.cambridge.org/BER
Acknowledgements
This work was supported by the Fundamental Research Funds for the Central Universities (Grant No. YX2013-11, TD2011-06) and the Project of the National Natural Science Foundation of China (Grant No. 30970462). We thank Professor De-Qiang Zhang and Dr Qing-Zhang Du of the College of Biological Sciences and Technology, Beijing Forestry University for their helpful suggestions.