





1. Introduction
Today, we know that the Earth and the other planets orbit the Sun, and Newton’s law of universal gravitation describes many of their properties. Modern observations have shown that there are as many planets as there are stars in the visible universe and that most stars belong to binary systems. These systems are essential for determining fundamental parameters, such as orbital periods and stellar masses. Since they are located at great distances, their study relies on analyzing the light that reaches Earth after traveling through interstellar gas and dust. The most common types include visual, astrometric, spectroscopic, and eclipsing binaries, which can be studied based on their observational characteristics. In particular, eclipsing binaries are often analyzed using spectroscopic or photometric techniques. Howell (Reference Howell2006) In this project, spectroscopy was applied to decompose stellar light and link spectral lines with properties such as temperature, age, and composition.
2. Methodology / Methods
2.1. Binary Star
Binary stars are systems composed of two stars that are gravitationally bound, orbiting around their common center of mass. Kallrath & Milone (Reference Kallrath and Milone2009) It is estimated that between one-third and one-half of the observed stars belong to binary systems. The main types include visual, spectroscopic, and eclipsing binaries. This work focuses on spectroscopic binaries, as they represent the primary objects of study.
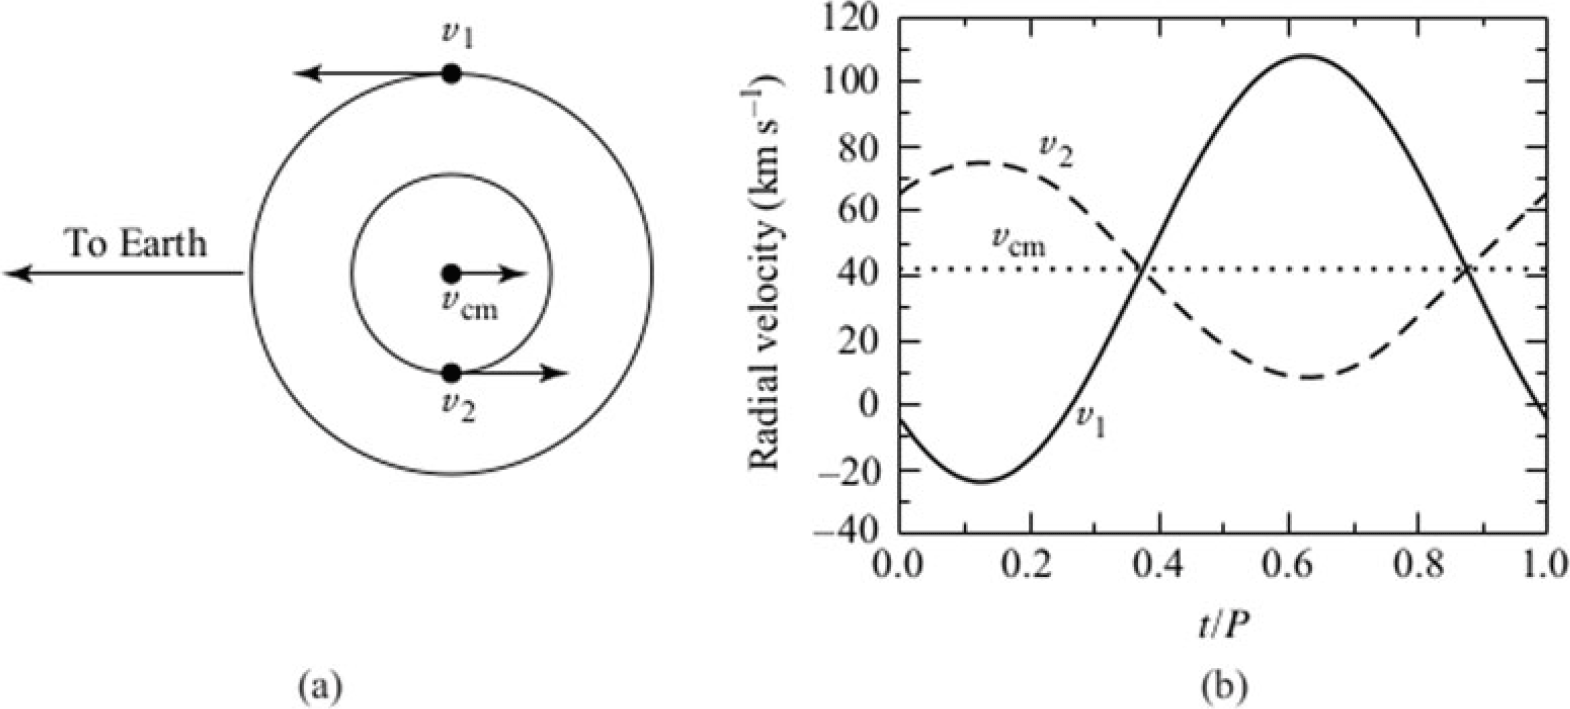
• Spectroscopic Binary: If only the spectrum of one component is detected, the system is classified as a single-lined spectroscopic binary (SB1). Ostlie & Carroll (Reference Ostlie and Carroll2007) Conversely, if the spectra of both components can be observed (see Figure 1), it is referred to as a double-lined spectroscopic binary (SB2). In the latter case, the absorption lines in the composite spectrum periodically shift as each star moves in its orbit toward or away from us. Ostlie & Carroll (Reference Ostlie and Carroll2007) These spectral shifts are best analyzed through radial velocity curves as a function of the orbital period for each component.
(a) Schematic diagram of a double-lined spectroscopic binary. (b) Radial velocity curves of each component at different orbital phases.

Figure 1 Long description
Panel A: A schematic diagram of a double-lined spectroscopic binary system. The diagram shows two circular orbits with a common center of mass. The velocities of the two components are labeled as v1 and v2, and the velocity of the center of mass is labeled as v_cm. The direction to Earth is indicated with an arrow. Panel B: A line graph showing the radial velocity curves of each component at different orbital phases. The x-axis represents the normalized time (t/P) ranging from 0.0 to 1.0. The y-axis represents the radial velocity in kilometers per second, ranging from -40 to 120. Two curves are shown: a solid line for v1 and a dashed line for v2. The velocity of the center of mass (v_cm) is indicated by a horizontal dotted line at approximately 40 km/s.
2.2. BUL-SC16 335
Hot subdwarf B stars are low-mass objects (
 $\sim$
0.5 M
 $_\odot$
) that burn helium in their cores and evolve directly into white dwarfs, although their evolutionary status is not yet fully understood. Polubek et al. (Reference Polubek, Pigulski, Baran and Udalski2007) Determining fundamental parameters such as mass and radius is crucial for modeling their evolution, and eclipsing or spectroscopic binaries provide ideal conditions for this purpose.
Within the OGLE survey, which monitors variable stars toward the Galactic bulge, the eclipsing binary BUL-SC16 335 was identified with a very short orbital period of about 3 hours (0.12505 days). Polubek et al. (Reference Polubek, Pigulski, Baran and Udalski2007) Its light curve reveals a strong reflection effect and a deep primary eclipse, suggesting that it may be a pre-cataclysmic variable composed of an sdB star and a red main-sequence companion [?]. Additional spectroscopic data obtained with the 3.6 m telescope (see Figure 2) at La Silla Observatory (Chile) provided key information for its characterization.
3.6 m optical telescope of the European Southern Observatory (ESO). Credits: La Silla Observatory.

2.3. Spectroscopy of an binary star
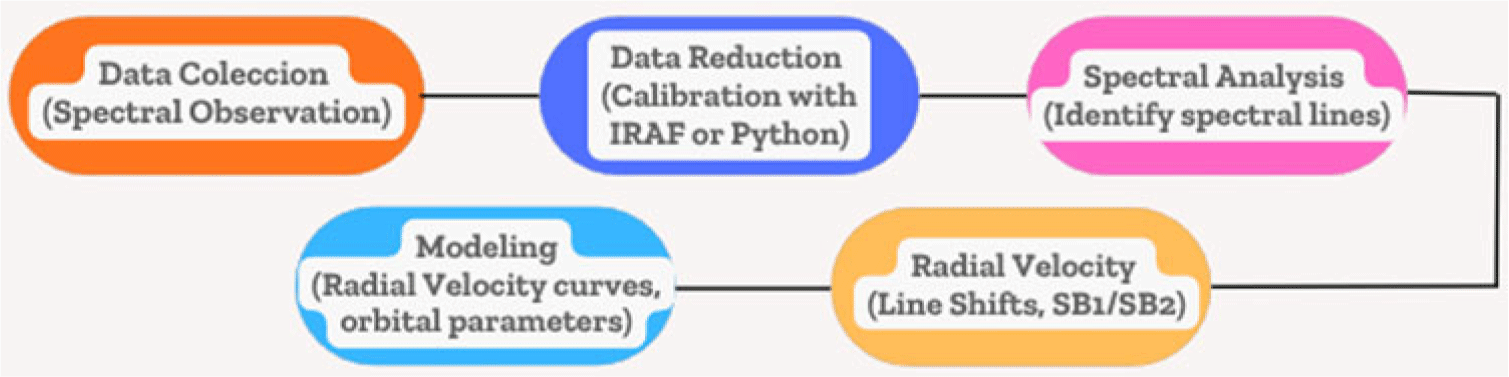
Spectroscopy of a binary star involves several steps once the observational data are available. Massey et al. (Reference Massey, Valdes and Barnes1992) First, the recorded spectra are reduced and calibrated in wavelength to ensure that absorption or emission lines can be accurately measured. Next, the Doppler shifts of these spectral lines are determined for each epoch of observation. These shifts are then converted into radial velocities, which are plotted as a function of orbital phase or time. By fitting the resulting radial velocity curves, the orbital parameters of the system can be derived, such as the orbital period, eccentricity, and semi-amplitudes. Finally, these parameters allow for the estimation of stellar masses and other fundamental properties of the binary system.
3. Results
In this project, observational data from the binary system BUL-SC16 335 were analyzed. The data were collected by the European Southern Observatory (ESO) during October 2008 and subsequently downloaded from its official website. The dataset included bias, flat, and lamp frames, as well as the target object BUL-SC16 335, with the lamp files corresponding to the mercury lamp spectra used for wavelength calibration.
Data processing was carried out using the xgterm console and the ds9 image viewer, which enabled efficient handling and analysis of the spectroscopic data.
Table 1 presents a statistical summary of the number of observations recorded for each day of the observing campaign.
Radial velocity and Julian day data of the binary star.

Table 1 Long description
The table presents a statistical summary of the number of observations recorded for each day of the observing campaign. It has two rows and four columns. The columns are labeled Bias, Flat, Lamp, and Object (BUL-SC16 335). The row labels are October 15 and October 18. Row 1: Bias, 10; Flat, 20; Lamp, blank; Object (BUL-SC16 335), blank. Row 2: Bias, blank; Flat, blank; Lamp, 3; Object (BUL-SC16 335), 6.
Subsequently, several IRAF tasks and packages were employed to perform the data reduction steps illustrated in Figure 3. As a result, the radial velocity curves of the spectroscopic binary system were obtained for the different observing nights.
Schematic diagram of the spectroscopic processing of a binary star.

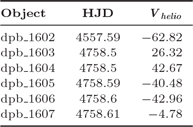
Table 2 lists the heliocentric radial velocities (V helio) and Julian dates (JHD) derived from the spectra, which served as the basis for the subsequent analysis and calculations.
Results of Overloading for 3 Experimental Setups.

Table 2 Long description
A table with four rows and three columns. The columns are labeled Object, HJD, and V helio. The row labels are dpb 1602, dpb 1603, dpb 1604, dpb 1605, and dpb 1607. The values in the table are as follows: Row 1: Object, dpb 1602; HJD, 4557.59; V helio, -62.82. Row 2: Object, dpb 1603; HJD, 4578.5; V helio, 26.32. Row 3: Object, dpb 1604; HJD, 4578.5; V helio, 42.67. Row 4: Object, dpb 1605; HJD, 4578.59; V helio, -40.48. Row 5: Object, dpb 1607; HJD, 4578.61; V helio, -4.78.
Since the main objective of this study was to obtain the radial velocity curve of the binary star as a function of its orbital phase, it was necessary to define a general sinusoidal function and determine its parameters through statistical fitting. The function is expressed as follows:
 \begin{equation} y=A \cdot sen\left(2\pi \dfrac{\Delta t}{P} +B\right) \end{equation}
where:
-
• P is the period of the binary star,
-
• A and B are constant parameters,
-
• t is the Julian Date (HJD) at which the observation was made, and
-
• y is the radial velocity (
 $V_{\text{helio}}$
) of the binary star.

The term
 $\dfrac{\Delta t}{P} = \dfrac{t - t_{0}}{P}$
is commonly referred to as the orbital phase of a star. Its value indicates the fraction of the orbital period that the spectroscopic binary system has completed. This parameter ranges from 0 to 1, where 1 corresponds to one full orbital revolution.
In general, the value of
 $t_{0}$
can be chosen arbitrarily; however, in this study, it was selected so that the initial phase of the system would start close to zero. Specifically, we adopted
 $t_{0} = 4758.49$
. Using this value and an orbital period of
 $P = 0.125050278$
days, the orbital phase of the binary system was computed. The following calculation illustrates the process for the object <monospace>dpb_1602</monospace>:
- For a t=4557.58:
 \begin{equation} phase = \dfrac{4757.58-4758.49}{0.125050278}\end{equation}
 \begin{equation} phase = \dfrac{-0.91}{0.125050278}\end{equation}
 \begin{equation} phase = -7.21\end{equation}
A negative phase value was initially obtained, which physically indicates that the binary system had completed more than seven orbital revolutions, but in the opposite direction of the original motion. To normalize the phase within the standard range of 0 to 1, eight orbital cycles were added. Consequently, the orbital phase for the object <monospace>dpb_1602</monospace> was found to be
 $0.79$
.
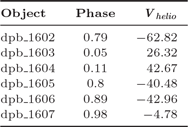
Applying the same procedure to the remaining <monospace>dpb</monospace> objects yielded a set of phase and radial velocity (
 $V_{\mathrm{helio}}$
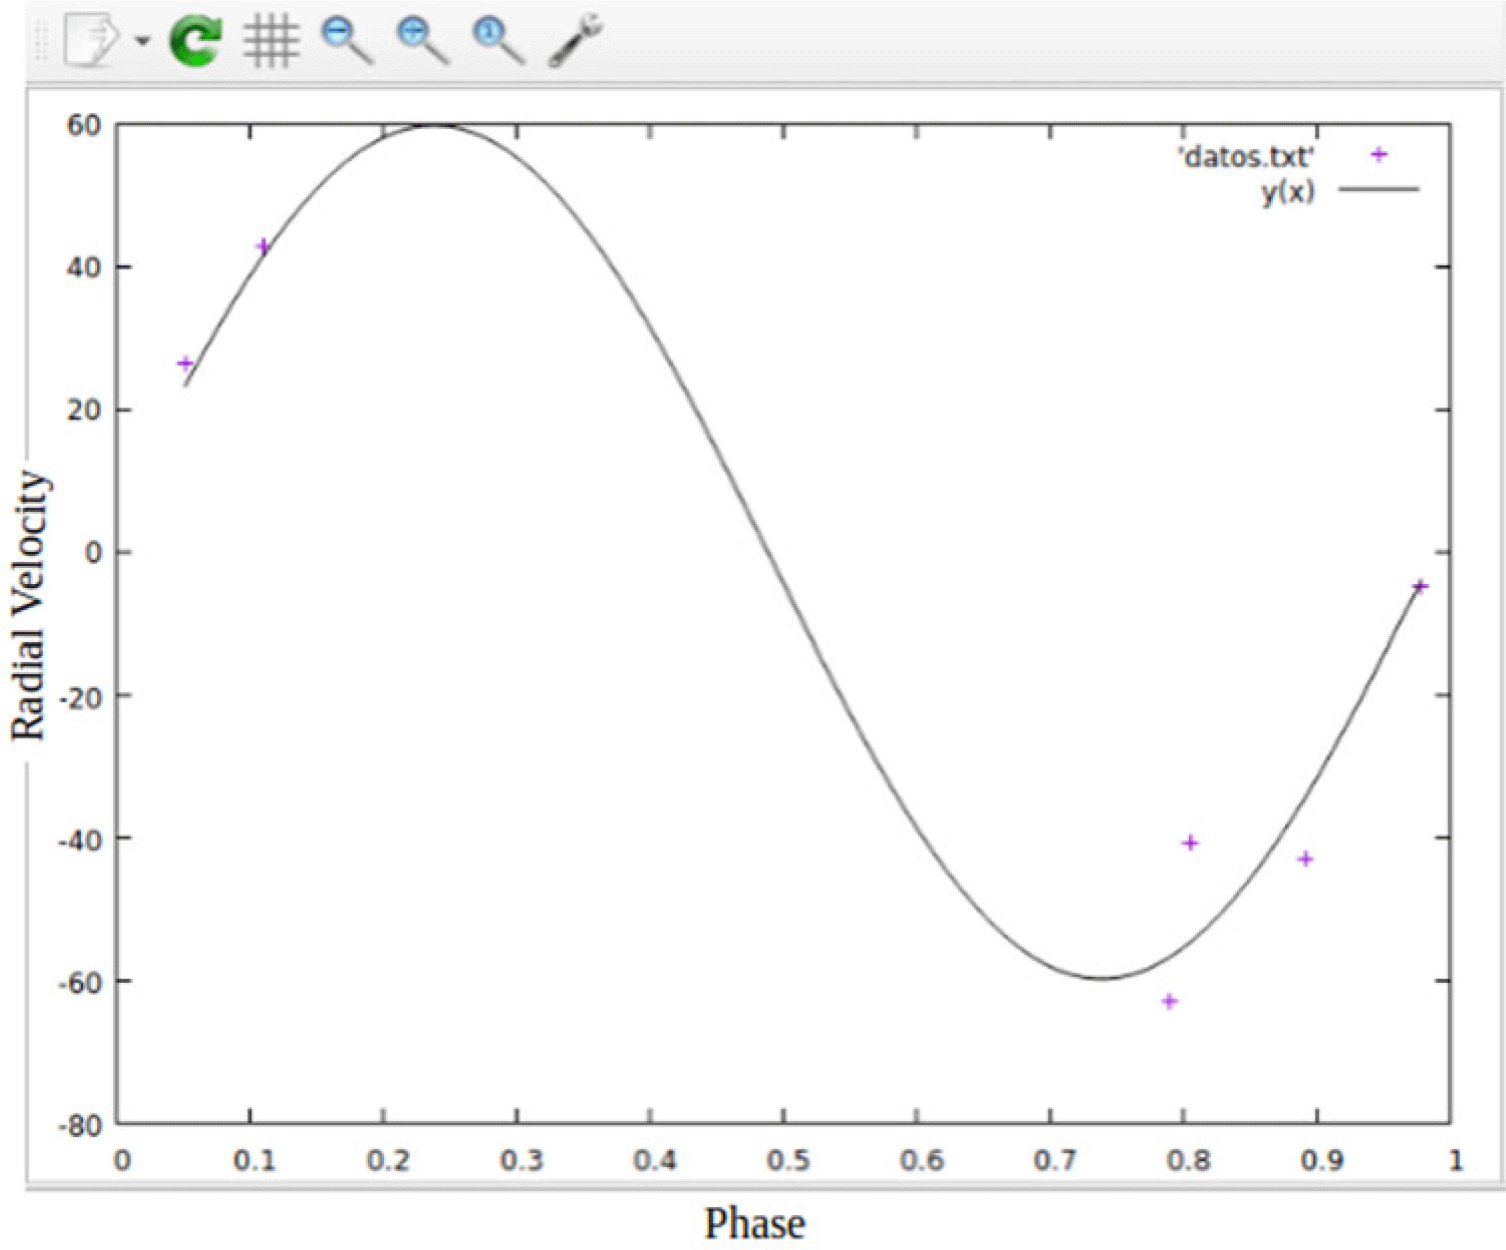
) measurements for the binary system. Table 3 summarizes these results. From the calculated data, the obtained points were plotted and fitted with a sinusoidal function using the capabilities of the gnuplot software. As the final step of the analysis, a general sinusoidal function was defined in the terminal to determine the constant parameters A and B, and subsequently perform the fit to the observational data.
Phase and radial velocity data of the spectroscopic binary star.

Table 3 Long description
A table with six rows and three columns. The columns are labeled Object, Phase, and V helio. The row labels are dpb.1602, dpb.1603, dpb.1604, dpb.1605, dpb.1606, and dpb.1607. The values in the table are as follows: Row 1: dpb.1602, 0.79, -62.82; Row 2: dpb.1603, 0.05, 26.32; Row 3: dpb.1604, 0.11, 42.67; Row 4: dpb.1605, 0.8, -40.48; Row 5: dpb.1606, 0.89, -42.96; Row 6: dpb.1607, 0.98, -4.78.
Figure 4 shows that the phase lies within the range of 0 to 1, while the radial velocity exhibits negative values. Physically, this indicates that the star is moving away from the observer, which corresponds to a redshift in its spectral lines.
Radial velocity curve of the spectroscopic binary system BUL-SC16 335 obtained using <monospace>gnuplot</monospace>.

Having the radial velocity curve expressed by an equation of the form:
 \begin{equation} y(x) = 59.7 \cdot sen\left(6.38 \dfrac{\Delta t}{P} +12.04\right)\end{equation}
4. Discussion
The radial velocity curve obtained corresponds to a single-lined spectroscopic binary, since one of its components is hidden by the other. Thus, the observed curve mainly reflects the motion of the brighter component. Although the fitting performed with gnuplot was limited by the small number of available data points, the process remains rigorous and illustrative. It provides both the author and the reader with a clear sequence of steps to follow when a larger data set of a spectroscopic binary becomes available, allowing for a more complete and accurate representation of its radial velocity behavior.
From Figure 32, it can be observed that the peak of the radial velocity curve occurs at phase 0.28, while the minimum appears at approximately phase 0.74. In spectroscopic terms, this indicates that the star is moving away from the observer at phase 0.28 and approaching at phase 0.74. Furthermore, the sinusoidal shape of the radial velocity curve of the BUL-SC16 335 system suggests that its components follow an almost circular orbit, reinforcing the hypothesis of a stable binary configuration.
5. Conclusions
In this work, various packages and tasks from the IRAF software were implemented and mastered, enabling the effective completion of the full spectroscopic reduction process of a star. The influence of CCD camera performance on the quality and accuracy of astronomical observations was also evaluated. Using gnuplot, the data of the spectroscopic binary BUL-SC16 335 were reduced and analyzed, resulting in its radial velocity curve. The analysis of this curve revealed that the components of the system exhibit an essentially circular orbit, confirming their stable nature within the observational limits. These results contribute to a better understanding of the orbital dynamics of binary systems in the Galactic bulge and highlight the relevance of spectroscopic techniques for the characterization of their physical properties.
6. Acknowledgments
The author expresses her sincere gratitude to her thesis advisor, Julio Tello, for his continuous guidance and support throughout the development of this work. She also wishes to thank the Astronomy Group of the Universidad Nacional de Ingeniera (UNI) for their academic orientation and collaboration. Finally, special thanks are extended to the European Southern Observatory (ESO) for providing the observational data used in this study.



 Open access

