




No CrossRef data available.
Article contents
- Abstract
- INTRODUCTION
- GEOGRAPHICAL INFORMATION SYSTEM
- PRE-GIS ERA: EARLY MAPPING, ANALYSIS AND DISPLAY OF BIOGEOGRAPHICAL AND MEDICAL DATA
- PREDICTIVE MAPPING OF TICKS AND TBD DISTRIBUTION
- MAPPING AND ANALYSING TICK-BORNE DISEASE DISTRIBUTION BASED ON EPIDEMIOLOGICAL DATA
- SATELLITE REMOTE SENSING
- APPLICATIONS OF REMOTE SENSING IN THE STUDY OF TICK OCCURRENCE AND IN TICK-BORNE DISEASE EPIDEMIOLOGY
- ACKNOWLEDGEMENTS
- References
GIS tools for tick and tick-borne disease occurrence
Published online by Cambridge University Press: 19 April 2005
Article contents
- Abstract
- INTRODUCTION
- GEOGRAPHICAL INFORMATION SYSTEM
- PRE-GIS ERA: EARLY MAPPING, ANALYSIS AND DISPLAY OF BIOGEOGRAPHICAL AND MEDICAL DATA
- PREDICTIVE MAPPING OF TICKS AND TBD DISTRIBUTION
- MAPPING AND ANALYSING TICK-BORNE DISEASE DISTRIBUTION BASED ON EPIDEMIOLOGICAL DATA
- SATELLITE REMOTE SENSING
- APPLICATIONS OF REMOTE SENSING IN THE STUDY OF TICK OCCURRENCE AND IN TICK-BORNE DISEASE EPIDEMIOLOGY
- ACKNOWLEDGEMENTS
- References
Abstract
Geographic information systems (GIS), their fundamental components and technologies are described. GIS is a computer-based system enabling the storage, integration, query, display and analysis of data using information on data location. Further, remote sensing (RS) methods and their application in landscape characterization are described. Landscape pattern analysis, combined with statistical analysis, allows the determination of landscape predictors of disease risk. This makes RS/GIS a powerful set of tools for disease surveillance, enabling the prediction of potential disease outbreaks and targeting intervention programs. The ‘pre-GIS era’ is briefly described including the early mapping of tick distribution, analyses and the display of biogeographical and medical data. The theory of natural focality of diseases (NFD) is explained and its significance in tick-borne diseases (TBD) research is discussed. Many problems of tick ecology and TBD epidemiology and epizootology have been addressed by means of GIS and examples of these studies are presented and discussed.
Information
- Type
- Research Article
- Information
- Copyright
- © 2004 Cambridge University Press
INTRODUCTION
For many years, scientific research has considered the relationships between the landscape and human health. Increasing rates of environmental changes are dramatically altering patterns of human health at the community, regional and global scales. The emergence of tick-borne diseases (TBD) illustrates the impact that environmental changes can have on human health. Integration of modern geoinformation technologies into landscape epidemiology can contribute significantly to the development and implementation of new disease-surveillance tools. The theory of landscape epidemiology offers the opportunity to use the landscape as a key to the identification of the spatial and temporal distribution of disease risk. Key environmental elements – including elevation, temperature, rainfall and humidity – influence the presence, development, activity and longevity of pathogens, vectors and zoonotic reservoirs of infection, and their interactions with humans (Meade, Florin & Gesler, 1988). The same environmental variables influence distribution of vegetation type as landscape elements and patterns of disease. Remote sensing (RS) from aircraft and satellites can be used to describe landscape elements that influence the patterns and prevalence of disease. In addition, geographical information systems (GIS) provide tools for modelling spatially their occurrence in space and time.
Ticks are ideally suited to GIS and RS applications owing to their close ties with the ecosystem. This relationship is determined by: (1) the type of host–parasite association (most important vector species are three-host ticks); (2) specific requirements of the microclimate; and (3) dependence on clearly defined types of plant associations which both reflect the microclimatic conditions of a habitat occupied by ticks, and also influence them.
Ticks and TBD are highly amenable to predictive mapping. In order to be infected, hosts must enter a habitat in which infected ticks are present. Such areas can be accurately identified topographically (this contrasts with vectors such as mosquitoes that can travel long distances from their breeding places). These traits enable great precision in spatial analyses of the distribution of ticks and TBDs, and in the construction of prognostic maps.
The use of GIS has many implications for landscape epidemiology because it provides the ability to store, integrate, query, display and analyse data from the molecular level to that of satellite resolution through shared spatial components. Field observations on environmental conditions, including vegetation, water and topography, can be combined in a GIS to direct interpretation of RS data and facilitate characterization of the landscape in terms of vector and pathogen prevalence. The associations between disease risk variables (e.g. vector, pathogen, and host abundance and distribution) and environmental variables can be quantified using the spatial analysis capabilities of the GIS. Landscape pattern analysis, combined with statistical analysis, allows us to define landscape predictors of disease risk that can be applied to larger regions where field data are unavailable. This makes RS/GIS powerful tools for disease surveillance enabling the prediction of potential disease outbreaks and targeting intervention programmes (CDC, 1994, 1998).
GEOGRAPHICAL INFORMATION SYSTEM
GIS is a system of computer software, hardware and data, and personnel to manipulate, analyse and present information that is tied to a spatial location. GIS further enhances the role of a map. A GIS is not just an automated decision-making system but a tool to query, analyse, and map data in support of the decision-making process. Because GIS products can be produced quickly, multiple scenarios can be evaluated efficiently and effectively.
Real world description
Our decisions require adequate knowledge about the world. This knowledge, however, is far from complete. Therefore, we have to use incomplete, selected information. The model formed is a set of relationships, conditions and rules describing our understanding of what creates a specific part of our world and how it is functioning. The real world can only be described in terms of a model. There are countless possible approaches to the description and interpretation; consequently, the design of GIS systems varies according to their purpose. Every model is a simplification of the reality because it only includes selected data relevant to the model.
Spatial data
Data used to describe our world must include answers to the key questions: ‘What?’, ‘Where?’ and ‘When?’. If data are related in such a way that they can answer all three questions, they constitute spatial data.
Depending on the question, two fundamental components characterize spatial data: (1) geometric data or location data, and (2) non-geometric data or descriptive data (attributes). Geographical data are inherently in the form of spatial data. An estimated 80% of all natural sciences data has a spatial component. GIS uses geographical data in a digital format. Location data usually refer to specified spatial coordination systems of two dimensions (e.g. longitude and latitude) or three dimensions (e.g. the Cartesian orthogonal system used in satellite navigation systems). When a common mapping coordinate system is used, spatial data in GIS are termed geocoded or georeferenced data. Simple geometrical shapes are used to describe location data. A point represents the location of phenomena or objects small enough for such presentation. Sets of connected points create lines indicating the position of linear features like boundaries or communication networks. Closed lines constitute boundaries of an area such as that delineating a country, lake or forest.
Time is the third fundamental component of spatial data. It is a contextual reference. Thus, location and descriptive data relate to a given point in time.
Spatial data in maps and in GIS
Printed maps contain spatial data in a compact and easily accessible format. However, in rapidly changing regions, such maps quickly become outdated. Retrieving information from printed maps is relatively simple for small amounts of information. For larger volumes of data, as required for applications such as environmental assessments, modelling land cover changes, or climate studies, it becomes more difficult and costly. It becomes even more time consuming and cumbersome when data integration from different maps is required.
These drawbacks are overcome by the use of computing to process large volumes of data for geographical data analysis. The requirements are: (1) all data in digital format and (2) a set of relatively simple instructions (software) for data processing. Generally, there are two approaches to preparing digital spatial data for GIS.
A vector data model stores a table containing coordinates of points together with instructions on which points are alone and in which points belong to a common set. Digital data are discrete data and, hence, analogue values are eliminated when a digital data model is applied. Graphical presentation of spatial data is also based on points. To demonstrate that some points belong to one object a line connects the points. The simplest line is a vector in which both start- and end-point are defined. In a vector data model, all lines are represented by chains of vectors, and all areas by polygons. For graphical presentations, discrete values can be transformed into continuous data using mathematical functions to compute the missing values. Other types of function can be used instead of straight lines if they better describe changes of spatial data in space and/or time. Attributes are coded in separate tables using alphanumerical characters as a label for a specific class or category of properties. Association between location data tables and attribute tables is achieved by inserting the same identities in both kinds of tables for identical objects.
A raster data model uses a net of adjacent polygons (termed ‘cells’) to provide a virtual cover of a given part of a landscape. In its simplest form, cells are identical squares forming an organised grid. Each cell represents one entity of the landscape's surface. Location data for this entity is coded by the cell position in a matrix defined by row and column number. The cells are often called pixels, a term used in display technology for picture elements. Attribute values of the objects that the cells represent are assigned to corresponding pixels. Only one value can be assigned to a single cell, which requires a different raster layer for each thematic topic or period of time. Thematic layers are also used in vector models, but because of differences in attribute manipulation, raster models have more layers than vector models.
An important attribute of GIS is its data-handling capacity. GIS allows the input of data of different origin, content and format, and digital data can be edited and modified relatively easily. Consequently, GIS enables databases to be updated regularly. The system also offers wide flexibility in manipulating the data and displaying it in different formats. Finally, and importantly, GIS allows quantitative methods to be used in spatial data analysis. Analytical methods based on mapped analogue data are primarily qualitative and depend on visual and intuitive assessment of the data. In contrast, GIS permits qualitative methods to be expressed through mathematical relationships computed by software instructions. The real benefit of GIS is the ability to integrate data in models to give a value-added product, customised to meet user needs.
In the long term, the advantages of digital data reward the initial work and financial investment. Rapidly increasing computing power has resulted in a proliferation of GIS applications in environmental analysis during the last 20 years.
Spatial data collection
Database
Geographical or spatial data are stored together in one set of data called a database. Accessibility of the data is dependent upon the way the data are organised in the database. In GIS, the quantity of data is large enough that the form and performance of the database is critical to the overall usefulness of the GIS. Thus, a database management system is installed to facilitate input, storage and retrieval of data. The system determines the response time, storage capacity, flexibility and other parameters affecting the usefulness of a database. Database structures differ primarily according to the facilities or operations they support. The most frequently used database system in GIS, the relational database management system, provides a simple and flexible structure of tables. More advanced structures are object-oriented database systems in which stored units are homogeneous objects.
Databases organised around GIS cores are essential elements of information systems. No current database system completely fulfils the needs of all database applications. Finally, operations required for any type of data manipulation have to be described in software form as a set of relatively simple instructions to be executed by computer. The emphasis in the future will be on improved organisation of spatial databases for use in GIS.
Data sources
The sources of digital geographical data needed for a comprehensive GIS are of a tremendous variety. The variety of data types that can be used in a GIS database increases its applications. However, integration of diverse data for analysis needs to be done in a controllable way to avoid the results of analysis from being interpreted incorrectly.
Major data types contributing to GIS databases include: (1) conventional documents; (2) survey measurements of both location and attribute values (satellite global positioning systems can be used for precise location data measurements); (3) conventional photographs, maps, drawings, graphs and other analogue images converted into digital format by either manual digitisation of selected geometrical features resulting in a vector data set, or by scanning procedures that produce digital data sets in a raster model; (4) existing digital non-spatial data, e.g. tables or textures; (5) existing spatial databases; (6) remote sensing data acquired by radiometers on satellites or aircraft. Earth observation satellites provide a coherent, objective and regular source of input data for GIS databases. Scanning radiometers or imaging radar can observe large areas of land in a very short time and make digital measurements over the given site repeatedly.
Prime databases have now become accessible through the World Wide Web, creating a demand for compatibility of web databases and for universal access. The development of pan-European data banks, with commonly agreed formats, is essential.
Spatial data quality
The performance of GIS depends not only on the technical characteristics of hardware and functions offered by software, but primarily on the quality of input data. Digital data are frequently considered to be of higher quality than conventional data, but this is not necessarily the case. Data quality depends on the quality of the data sources: quality of the original input data, the method of data acquisition and on the precision of all stages of data processing. Knowing the quality of data is critical to determining the appropriate use of the data. The most important measures of data quality that affects GIS applications are listed below.
Accuracy of location and attribute data
Positional accuracy and accuracy of continuous attribute variables may deviate from ‘true’ ground values. The accuracy of discrete attributes is similar to that of classifications used in remote sensing data that are verified by comparing data with randomly selected field measurements or surveys.
Topology
Topology requires that logical relationships among data are established. The consistency of the logical relationship is difficult to measure. Two data sets may have inconsistencies arising from slight differences in the position of the same boundary in the two sets, even when each data set is correct according to its level of accuracy. This difference creates a fictional polygon in the database when the data sets are overlaid. Data with unverified topology degraded the quality of the results.
Data completeness
Assessment of completeness is usually limited to reporting the proportion of data available for the area of interest (data coverage). However, qualitative factors of completeness are important to determine the suitability of a data set for an application. Completeness of classification refers to the capability of nomenclature to represent the data. Completeness of verification indicates the number and distribution of measurements used to develop the data.
Data resolution
The size of the smallest unit area represented in a data set defines the data resolution. For image or raster data sets, this parameter is termed spatial resolution and corresponds to the size of the picture element (pixel). For maps of vector data sets the resolution is the size of the smallest mapping unit.
Data time
Time is commonly expressed as the date of acquisition of source material. The time component of data quality is critical for dynamic geographical information. It is also important whenever tasks involve data sets collected independently at different times. The relative importance of each quality factor described above depends on the GIS application task. When spatial data analyses are performed manually, assumptions about data quality are made. In the digital environment of GIS, quality standards and the methods to measure them have to be explicitly defined before data entry commences. Unfortunately, the quality of geographical data is often examined only after incorrect conclusions, findings or decisions have been made.
Data analysis
GIS is used as an interactive analysing tool to support understanding of the environment and successive decision making as well as a database for the storage and retrieval of spatial information. Spatial analysis functions are characteristic features distinguishing a GIS from all other information systems. Ideally, a GIS should have all the functions to allow all conceivable operations with the data. In practice, a range of operations is supported by different GIS products (Table 1). These are changing constantly as the development of GIS technology provides growing numbers of increasingly sophisticated functions. The most difficult part of the analysis is defining the task or problem to be addressed and delineating the approaches to solutions. Particular regard must be given to the quality of data and its limitations.
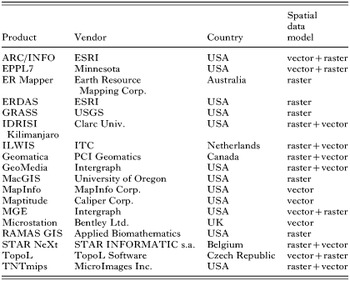
The computing power of modern GIS allows complex analyses to be made, even with large volumes of data. This is particularly important when a model is tested and integration capabilities are needed to obtain quick and reliable analyses of alternative scenarios. Successful spatial analysis using GIS depends on the model selected, type of data relevant to the model and knowledge of how to use GIS technology appropriately. Correct use of GIS certainly requires more than pushing buttons in a GIS-menu! Results must always be evaluated for accuracy and content, and alternative approaches used or new data sought when problems arise. Ideally, analytical results should be presented as easily interpreted maps accompanied by an explanatory report.
PRE-GIS ERA: EARLY MAPPING, ANALYSIS AND DISPLAY OF BIOGEOGRAPHICAL AND MEDICAL DATA
In recent years, several fundamental discoveries relating to pathogen transmission by arthropod vectors have revealed the crucial role of ecological conditions in the epidemiology of TBDs. Appreciation of landscape ecology in medical and veterinary medicine led to the development of descriptive, analytical and experimental epidemiology. Previously, the absence of computerized technologies was compensated by vast quantities of empirical data that enabled statistical procedures and the formulation of testable hypotheses. This situation applies to ticks and TBD in the tropics, sub-tropics and in the temperate zone. The problems of mapping the distribution of ticks are dealt with in the following section. Here we discuss the influence of tick ecology on TBD epidemiology which, in the ‘pre-GIS era,’ resulted in the theory of natural focality of diseases, a concept that still holds true today.
Natural focality of diseases (NFD)
The theory of natural focality of transmissible diseases was formulated by E. N. Pavlovsky. It was based on several years' research in the taiga of the Far East (Khabarovsk region, 1936–38) studying the circulation in nature of the then newly discovered virus of tick-borne encephalitis (TBE), and the transmission pathways to humans. Pavlovsky was also influenced by observations made in expeditions to Central Asia to investigate tick-borne relapsing fever (Borrelia persica) transmitted by the argasid tick, Ornithodoros tholozani. Starting with the assumption that the disease agent and its vector form part of a biocenosis in a given habitat (biotope), Pavlovsky demonstrated that the majority of vector-borne diseases (VBD) are localized in foci located within defined geographical complexes. He called them natural foci of diseases (NFD). The term NFD differs from that of a focus in the general epidemiological sense because it involves a geographical territory that is usually precisely defined and demarcated by certain ecosystems.
Pavlovsky published on this theory of NFD over a 25-year period (Pavlovsky, 1939, 1946–48, 1964) and other researchers have contributed (Rosický, 1967; Korenberg, 1983; Kucheruk & Rosický, 1984). Today, NFD is defined as ‘A natural focus of a disease is a geographically demarcated part of the landscape which has formed during the course of natural evolution and contains an association of organisms in which there circulates a disease agent as its integral component, independently of man and domestic animals.’ Under certain conditions humans and domestic animals can become involved in the circulation of the infection. Natural focality is therefore a general biological phenomenon wherein the infective agent and its vector have, in the course of evolution, become components of a stabilized ecosystem independently of humans.
Fundamental components determining the existence of a NFD
The fundamental components of a NFD are: (1) the disease agent; (2) susceptible animal hosts; (3) vectors (ticks, or other blood-sucking arthropods); (4) a suitable habitat (plant association); (5) a suitable environment facilitating the agent's circulation. The first three components (together with plants forming a suitable vegetation type) represent an association of micro- and macro-organisms forming a given biocenosis. The location (part of the landscape) in which this association exists is called a biotope (habitat). These components interact resulting in an environment that provides abiotic (e.g. climatic, soil types, etc.) and biotic conditions which support circulation of the infective agent.
Most habitats are clearly delimited in the landscape (e.g. forest, pasture land, clearing, etc.). Contact zones between two or more ecosystems are called ecotones. Often they have an enriched herbal and bushy vegetation providing a greater and more stable food supply, and ample shelter for small mammals (tick hosts). These conditions (particularly microclimatic conditions – see Daniel & Dusbábek, 1994) within ecotones favour the development of vectors and thereby increase opportunities for the circulation of disease agents. A number of ecotones have arisen as a consequence of agricultural activities fragmenting formerly extensive habitats.
Animal hosts of infective agents are often called ‘reservoirs’. That term describes hosts in which the agent persists over periods unfavourable for its circulation (winter in temperate zones) and inter-epizootic periods. However, a number of vertebrate hosts do not meet these criteria and may best be classified as major (basic), minor (secondary), and supplementary or chance hosts. For borreliae that cause Lyme disease, Gern et al. (1998) have outlined criteria for the establishment of reservoir status. The discovery of non-viraemic transmission in certain TBDs (Jones et al. 1987) introduced yet another way of classifying hosts and their significance for NFDs.
Detailed research into the circulation of TBD agents has emphasized the importance of vectors as reservoirs (e.g. Ixodes ricinus acting as a reservoir of TBE virus). Factors contributing to the reservoir potential of vectors are their ability to support trans-stadial transmission from one stadium to the next, and trans-ovarial transmission to succeeding filial generations of the vector (Benda, 1958; Danielová et al. 2002).
An active NFD occurs when all the components of an NFD are operating and circulation of the disease agent is ensured. A human entering an active NFD is at risk of infection from an infected tick. Other transmission pathways may be in play, for example, transmission of TBE virus via the alimentary route by drinking untreated goats' milk or consuming infected milk products (Blaškovič, 1967). A potential focus occurs when any of the components of an NFD are absent or not functioning, the most common being the absence of the infective agent. In such cases there is the risk of rapid transition to an active focus, for example, through the introduction of infected ticks by avian hosts that are vagrants after nesting (Balát & Rosický, 1954), or by the introduction of an infected vertebrate host. An active focus may exist for a long period without manifestation of the human disease. Such an NFD is a latent focus in the epidemiological context (as compared with an active NFD which is regularly manifested by cases of disease in humans). Changes in latency/activation of a focus explain accounts in the literature of the ‘extinction’ and ‘flare-up’ of NFDs. For example, human cases of TBE are absent from certain regions of the Czech Republic although the virus has been demonstrated in a small proportion of I. ricinus ticks in these regions. Conversely, there is currently a renewed incidence of cases of human infection in other regions following several years' absence. The main reason for the apparent latency of these NFDs is the low circulation intensity of the virus among vertebrates (Danielová, Holubová & Daniel, 2002). Alternatively, the human exposure rate may be low.
The occurrence of disease in humans is just one of several indicators of an NFD in the landscape. Assessment of any given region (mapping, etc.) solely on the basis of absence of human cases of diseases without knowledge of the NFD potential may lead to erroneous conclusions.
Because ticks have limited mobility, the home ranges of their hosts (particularly those of adults) are an important determinant of the extent of NFDs. Major hosts of adult I. ricinus are game animals (e.g. Capreolus capreolus) (as in TBE foci in the Czech Republic), and pastured domestic animals. Such foci may be vast in area and cover whole regions (e.g. in the Balkan peninsula and Bulgaria). When deer are the principal host of adult I. ricinus, infections of humans are by tick bite whereas, when cattle and goats are prevalent in NFD, the alimentary route of infection is more common. Both routes of infection are common in the Slovak Republic where adult I. ricinus feed on deer and domestic animals. These differences must be taken into account when assessing the hazard posed to humans in a given area.
The structure of natural foci of diseases
The disease agent, vector and susceptible hosts are not evenly distributed within an NFD. Ticks occur in a mosaic-like pattern determined by biotic as well as abiotic factors. Locations that consistently sustain circulation of the disease agent are termed elementary foci (Pavlovsky, 1946–1948). Such places offer optimal conditions for the vector and its hosts. Elementary foci are often sites where game animals gather and conditions are favourable for small mammals, e.g. sites with mixed vegetation, glades with shrubs, as well as islets of trees in fields. Border zones (ecotones) play an important role. An elementary focus is characteristically structured. Its basis is a nucleus (synonymous with a ‘microfocus’ or ‘hot-spot’), and its centre (axis) may often be a brook (often only periodic) or a hollow with increased humidity and richer vegetation. The nucleus is usually surrounded by a transitional belt forming its boundary (Hejný & Rosický, 1965). The structure and biocenotic status of the nucleus of a long-lived focus of TBE in north-eastern Bohemia (Radvan et al. 1960) is depicted in Figs 1 and 2.

Fig. 1. Outline of the structure of a nucleus in a focus of TBE: A – axis of the nucleus; B – spruce mono-culture (without any tick occurrence); C – coat of the nucleus; D – grain field (without ticks); E – transitional phytocenoses; N – nucleus (reproduced with permission, Rosický & Daniel (1989)).

Fig. 2. Example of a nucleus in a natural focus of TBE (delineated by thick line) monitored in north-eastern Bohemia. Length of tract AC – 235 m; tract BD – 289 m; width of the nucleus proper 167 m, length 141 m (according to Radvan et al. (1960) reproduced with permission, Rosický & Daniel (1989)).
Depending on the configuration of the terrain and the local distribution of habitats, an elementary focus usually has several nuclei in which the disease agent survives inter-epizootic periods. Usually the area covered by each nucleus is not great enough to sustain circulation of the agent indefinitely; the activities of alternate nuclei are then crucial. Elementary foci are often the only type of NFD in highly exploited landscapes; identifying them in the terrain is important for epidemiological and epizootological prognoses targeted at timely preventive measures (see Figs 7 and 8). So-called bioindicators can be used to identify the presence and exact topographical localization of elementary foci in the field and in cartographical documentation. Bioindicators may be biotic or abiotic. Examples are plant associations, landscape relief, hydrological conditions, and slope gradient.
Applying the theory of NFD in landscape epidemiology
Detailed analysis of field conditions can inform local health-care practices but can also extend further. Korenberg & Kovalevsky (1981) applied their analysis of conditions to the distribution of TBE virus in the whole Euro-Asian continent. Their study is an example of the generalization of empirical data from detailed research in the field conducted on an intercontinental scale, and was a milestone in the ‘pre-GIS era’. From approximately 4000 publications, many concerning the Siberian region, they selected studies detailing the major evaluation criteria: geographical position of the focus and corresponding living conditions (delineation of the focus, landscape relief, climate, type of landscape, vegetation cover); vector ecology (for I. ricinus and/or I. persulcatus – population density, distribution in the terrain, seasonal periodicity of activity, major hosts, infection of ticks with TBE virus); and demographic data (conditions for human contact with ticks, incidence of TBE in humans and its fluctuations on a long-term basis, occurrence of antibodies in the human population). Besides considering conditions that support circulation of the virus in nature, Korenberg & Kovalevsky (1981) highlighted the socio-economic conditions of human populations at risk from infection.
The comparative studies by Korenberg & Kovalevsky (1981) were based on natural foci of TBE. Characterisitics of different natural foci were compared and five levels defined: (1) single natural focus; (2) groups of natural foci; (3) classes of natural foci; (4) focal region; (5) groups of focal regions. Across Euro-Asia they identified seven focal regions within the borders of which there exist 20000–30000 single NFDs. The greatest proportion is found in Asia (a total of 41 regions in the following five groups: West-Siberian, Kazakh-Central Asian, Central Siberia – Transbaikal, Khingan – Amur, and Pacific). In Europe, two groups were recognized: the East European group stretching from the River Visla to the Ural Mountains (with 18 regions that roughly cover the territory of the European part of the former Soviet Union) and the Central European – Mediterranean group of nine regions covering central, western and southern Europe. Each region is characterized by extensive data on vectors (I. ricinus, I. persulcatus and other tick species supporting TBE virus circulation) derived from 550 bibliographic entries.
Mapping tick distribution
Zoogeography of ticks – small-scale maps
Contour maps of large territorial areas (countries or whole continents) combined with topographical data provide the basis for mapping tick distribution. Sites of recorded tick occurrence are usually marked with point symbols or alternatively with filled squares covering a network of similar zoogeographical data. For example, the collection of maps of tick incidence (Ixodidae and Argasidae) in France showing 10×10 km grids marked with squares indicating where tick species have been found by flagging in the field or through detection on hosts (Gilot, 1985). The British Isles has been assessed similarly (Martyn, 1988). Location sites are documented in 10 km British and Irish national grids, with texts describing the individual species, the material processed, and museum and other collections.
The distribution of ticks (644 species), based on bibliographic records, has been published in four volumes by G. V. Kolonin (1978, 1981, 1983, 1984). In contour maps with a grid of a density of 10° to 20°, borders of the distribution of individual species are depicted. An important 1[ratio ]8000000 scale map gives the distribution of ticks in the temperate zone across the whole Asian continent (Prokhorov et al. 1974). This map uniquely records the results of long-term monitoring of ticks by a team of researchers working in the field. In places not covered in detail, data are interpolated based on knowledge of the biology of each tick species and its relationship with the environment (mainly vegetation type). Ten landscape types are differentiated and mapped along with their corresponding tick associations. Within these landscape types, the distributions of each species are indicated with their approximate densities graded from 1 to 5 on the basis of numbers of host-seeking ticks in the field (determined from flagging by one person over a one kilometre tract). The map is supplied with a text describing methodology and the characteristics of each tick species. A supplement of 1[ratio ]32000000 scale maps describes the distribution areas of eight epidemiologically important tick species including records of their occurrence outside of their presumed home range. Although the authors stressed that their aim was not to define natural foci of diseases (namely of TBE and rickettsioses), their map is used for epidemiological assessments. The approach of Prokhorov's et al. (1974) forms a bridge to the problems of medium and large scaled maps.
Tick distribution – maps of medium and large scale
In the 1970s and 1980s, the problem of drawing maps at medium and large scales for tick distribution studies was taken up by B. Gilot and associates (Gilot, 1985). They extended previously described relationships of ticks with vegetation, and used plant associations as bioindicators. Gilot's conclusions were based on his own vast experience in the field. He set limits for generalizations to ensure that field collected data did not lose its original value. In many ways he anticipated questions that arose decades later in the application of remote sensing (RS), e.g. spatial resolution; supervised/unsupervised classification, and the adequacy of the scale of prognostic maps. Gilot demonstrated empirically the mosaic-like pattern of tick occurrence for I. ricinus that had been previously deduced from observations of environmental conditions.
Gilot (1985) started with a map of 1[ratio ]1500000, breaking down the studied territory according to phyto-sociological categories. Such a map enabled predictions of territories that had a high probability of harbouring a certain tick species. However, the map did not enable the determination of population densities or reliably reveal environmental relationships. Therefore Gilot et al. (1979) and Gilot, Pautou & Lachet (1981) conducted two vast field experiments with two different map scales in two geographically different regions: a 1[ratio ]35000 map covering 190 km2 of the Jura mountain range, and a 1[ratio ]200000 map covering 2320 km2 of the Rhone valley. The methodology for both maps was unified: an elementary unit of the territory (0·36 km2 in the first instance, and 4 km2 in the latter) was flagged by one person along several transects for one hour. Tick-plant associations were determined by a priori analysis (corresponding to supervised classification in satellite data) and a posteriori analysis (analogous to unsupervised classification), followed by a comparison of the results. Gilot (1985) concluded that, in general, a large magnification scale (1[ratio ]50000) was best suited to generating a realistic picture of tick distribution. A medium scale (1[ratio ]200000) is acceptable in regions with a uniform (simple) landscape character; or can be applied for general epidemiological assessment of a larger territory. Medium-scales were not recommended for territories having complicated topographical conditions (e.g. mountains) where the landscape breaks down into a mosaic of various landscape elements, or when ticks are found within limited areas. In such cases Gilot (1985) recommended the use of maps of very large scale (1[ratio ]5000, 1[ratio ]2500 or 1[ratio ]1000) for delimiting NFDs and for the study of their structure. Gilot pointed out that I. ricinus is a suitable species for mapping because of its association with precisely defined environments. For this reason, I. ricinus is often used to illustrate points in this chapter.
Other notable applications of medium and large-scale maps are those of Russian workers who conducted their studies mainly in the temperate zone of Asiatic Russia (namely in the deciduous taiga belt) harbouring NFDs of TBE and rickettsioses. Their work focused on I. persulcatus. Reviews of the methods used have been presented by Korenberg (1973), and Vershinina (1985). Another notable review in this area is that of Kitron & Mannelli (1994).
PREDICTIVE MAPPING OF TICKS AND TBD DISTRIBUTION
Field collected data on tick occurrence is often lacking. In these situations, tick distribution is predicted based on the spatial distribution of covariates. Predictive mapping can be based on either a priori information about eco-physiological characteristics of the species under study, or on a training database reflecting the relationship between occurrence and covariates ad hoc. The former is based on an experimentally-verified dependence of the given tick species or TBD on certain environmental factors, leading to empirical models and expert systems (e.g. CLIMEX). In the latter approach, application of appropriate mathematical models (e.g. regression, discriminant analysis, etc.) permits a statistical estimation of the relationship between the occurrence of ticks and/or TBD and the number of covariates in a data set. A number of alternative models have been described, none of which can be considered universally the best. An accurate prediction always requires optimization of any given model depending on specific ecological conditions and available data (Robinson, 2000).
Methods most commonly applied in predictions
Species occurrence is primarily determined by macro-climatic factors hence macroclimate is commonly exploited in prediction models. Among the most frequently applied ‘expert’ systems is CLIMEX (Sutherst & Maywald, 1985). Such a prediction model is based on the assumption that an area of occurrence is limited by a ‘climatic envelope.’ The envelope is positively delimited by a ‘Growth Index’ which combines favourable temperature and humidity, and negatively delimited by ‘Stress Indices’ represented by extremes in temperature and humidity. In the basic layout, climatic parameters at a given site are determined by interpolation in a grid of measurements by a network of 2400 meteorological stations situated all over the world. The output of the model is an ‘Ecoclimatic Index’ of 0–100 which is interpreted as an overall measure of climatic suitability for population growth and the persistence of a given species. CLIMEX has found many applications in zoogeography including the prediction of tick occurrence (e.g. Norval et al. 1991; Perry et al. 1991; Sutherst, 2001).
Another common ‘expert’ approach is the application of geobotanical data. Certain plant associations and their structures reflect macro- and/or meso-climatic factors, geological and other conditions, but also create microclimatic, nutritional and shelter conditions for the presence of ticks and their hosts. The association of tick population density and a certain type of vegetation is thus a strong predictive criterion of occurrence that can be verified (e.g. Sonenshine, Peters & Stout, 1972; Gilot, Pautou & Moncada, 1975; Estrada-Peña, 2001a). Effective application of this principle in landscape epidemiology has been facilitated by the development of remote sensing (RS) enabling identification of tick habitats from multispectral images (Hugh-Jones, 1989; Daniel & Kolář, 1990; Hugh-Jones et al. 1992). The vegetation categories discerned in satellite-mediated imagery do not follow the classical phyto-ecological categories obtained by researchers on the ground. RS classification of tick habitats is more about the structural characteristics of the vegetation but their predictive potential is not diminished compared with ground-based characterisation (Duffy et al. 1994; Daniel et al. 1998, 1999; Beck, Lobitz & Wood, 2000).
A strategy different from the ‘expert’ approach is the use of covariates expected to be linked with tick occurrence in ad hoc models. Besides climatic and vegetational covariates mentioned above, there are geological, soil type, hydrological and host population covariates as well as anthropogenic and other factors co-determining the site or area of occurrence. To envisage the often subtle relationship between tick occurrence or the risk of TBD with covariates, certain statistical methods are applied (e.g. Robinson, 2000). The most common are modifications of regression analysis. Discriminant analysis, co-kriging and classification tree methods have also been applied on occasion.
Various modifications of the regression model allow investigation of the functional relationship between independent variates (or covariates) and a dependent variate. There are a number of examples of applying correlation analysis (Kitron & Kazmierczak, 1997), multidimensional linear regression (Glass et al. 1994) and logistic regression (Glass et al. 1995; Cumming, 2000a,b; Guerra et al. 2002) for constructing models of tick or TBD occurrence based on numerous covariates amassed in the GIS data base.
Bioclimatic zones and prediction scale
Predictive maps can be produced for small territories (e.g. Daniel & Kolář, 1990; De Garine-Wichatitsky, 2000) as well as at pan-continental scales across many bioclimatic zones (e.g. Estrada-Peña, 1999; Cumming, 2000a). The scale and bioclimatic zone markedly influence the choice of predictors. Variables with small spatial variance, namely macro-climatic indices, have nearly no predictive value in small territories, whereas diversified variables such as vegetation type and vegetation structure have limited value in large-scale studies. Many predictive models have been elaborated for the conditions of the tropical and subtropical climate zones of Africa, Australia and South America using mainly macroclimatic variables or their satellite surrogates and Normalized Difference Vegetation Index (NDVI). While climatic variables (monthly temperature and mean precipitation) are generally good predictors of tick occurrence in such conditions, the efficacy of NDVI and vegetation variables generally differs (Cumming, 2002). However, in the temperate zones of Europe and North America, similar studies have demonstrated the predictive potential of vegetation variables for tick and TBD occurrence (e.g. Sonenshine, Peters & Stout, 1972; Gray et al. 1998). Other effective predictors are the type and moisture of soil (e.g. Carey, McLean & Maupin, 1980; Kitron, Bouseman & Jones, 1991; Glass et al. 1994), waterways network (Kitron et al. 1991; Estrada-Peña, 2001a), terrain configuration (Merler et al. 1996), game density and even various anthropogenic factors.
Species specificity of predictive models
Predictive mapping studies have most commonly involved economically important species in tropical regions (Boophilus microplus, Amblyomma variegatum and Rhipicephalus appendiculatus) and epidemiologically-significant species of the temperate zone (I. ricinus in Europe and I. scapularis in North America). Predicability of distribution of a particular tick species is influenced by the complexity of its developmental cycle and range of hosts environmental requirements of both the tick and hosts and other factors (Randolph, 2000). For related and ecologically-close species, inter-species competition may have a confounding effect (Estrada-Peña, 2001b).
From tick maps to TBD prediction
Prediction of TBD risk is dependent on the prediction of occurrence of competent tick species; however, other factors contributing to the existence of natural foci may have a substantial effect. When the influence of such factors is negligible, the potential distribution of TBDs can be estimated on the basis of a simple combination of maps of major vectors with the tools of GIS. In other cases, GIS models should combine additional data sources. Special modelling techniques are required when variations through time of abiotic and biotic factors have an influential effect. Such dynamic factors include tick phenology, cyclic climatic phenomena and population cycles of the hosts. Interactions of these factors can sometimes be complicated (Jones et al. 1998). An elegant technique is the application of Fourier transformation to represent the periodicity of the temporal series of covariates. This approach reduces the amount of data and renders the model relatively easy to present (e.g. Rogers, 2000). Seasonal dynamics of climatic factors plays a key role in one model of TBE distribution (Randolph et al. 1999). The model assumes that virus persistence in a natural focus depends on ‘co-feeding’ of I. ricinus larvae and nymphs which, owing to the phenology of these stages, occurs only where there is a significant annual temperature gradient. This model uses the Land Surface Temperature (LST) index derived from data of the National Oceans and Atmospheric Administration (NOAA) satellites as a surrogate value for near-ground temperature (Green, Rogers & Randolph, 2000; Randolph & Rogers, 2000).
Validation of predictive models
Rapid developments in computer technologies and the increasing supply of RS data have led to wider applications of predictive mapping. Sophisticated GIS software packages offer the user a number of powerful modelling tools. However, their application has the shortcoming of being a ‘black box’ and can generate maps from input data that do not respect the elementary limitations of the mathematical model applied. Paradoxically, most such outputs look meaningful at first sight. Therefore, it is critical to verify the reliability of such predictions, for which a number of statistical procedures are available (Robinson, 2000).
MAPPING AND ANALYSING TICK-BORNE DISEASE DISTRIBUTION BASED ON EPIDEMIOLOGICAL DATA
Clinical cases are the primary information source of disease occurrence, and cartographical representation of their incidence is often used in exploratory epidemiological studies. Epidemiological observations of morbidity or seroprevalence often consist of Cartesian coordinates of locations of disease cases or counts of cases within arbitrary regions. Procedures for automated plotting of epidemiological data have been widely implemented in standard GIS or specialised software packages such as EPI-MAP and can readily be applied to produce descriptive maps of TBD. These maps vary in form from simple point maps of cases to pictorial representation of counts within tracts (Cliff & Haggett, 1988) and can generally satisfy the demands for decision making in health resource allocation or in focusing field research. However, for more in-depth analyses of disease distribution, statistical methods are needed. The rationale for switching to the more demanding methodology of spatial statistics are varied. One may wish, for example, to analyse the spatial pattern of TBD cases, or to study the relationship between disease incidence and some explanatory variable, or simply to filter out any random noise from the data. Statistical methods particularly suited to epidemiological data have been developed in the last two decades in response to growing concerns about adverse environmental effects on the health status of populations (Lawson et al. 1999; Lawson, 2001). When adopting these methods for analysing TBD distribution, specific features of these diseases should be taken into account. Unlike other infectious diseases: (1) the factor of contagiousness is absent; (2) cases tend to aggregate based on natural foci; (3) data are scarce as cases are relatively rare; and (4) the population denominator is poorly understood.
Population denominator
Any geographical pattern of disease incidence combines two spatial variables: the intensity of disease risk and the density of the population at risk. To rate the risk from incidence data, some information about the spatial distribution of the population at risk is required. There are two main approaches to this task in spatial epidemiology. The first relies on census tract counts, and the second employs some control events assumed to be uniformly distributed in the population, such as incidence of a common disease. With TBD, however, the risk is associated with a visit to rural locations, so the population at risk does not necessarily reflect residential population density and is not distributed uniformly. Instead, the interplay of behaviour or activities that may lead to exposure to ticks (demographic factors, road networks, and landscape features) and can shape the population at risk. Moreover, these factors can markedly vary from place to place (Rand et al. 1996). For example, tourism and outdoor recreational activities, which have been recognised as important risk factors in Lyme borreliosis (LB) (O'Connell et al. 1998), can exaggerate disease incidence in recreationally-exploited areas resulting in overestimation of risk. Assessment of the population at risk depends on the scale. Studies of large areas are less likely to be influenced by variations in population denominator, whereas small-area studies require special modelling techniques (e.g. Thomsen, 1991; Whittie, Drane & Aldrich, 1996). For example, paired data can be used on locations of residence and disease acquisition to model patterns of peridomestic exposure (Fig. 3).

Fig. 3. The frequency distribution of distances between residential addresses and places of infection in a set of patients of Lyme borreliosis fitted with power regression illustrates a peri-residential exposure of the population at risk (reproduced with permission, Zeman (1997)).
Analysis of spatial clustering
One important question in spatial epidemiology is whether an observed pattern of cases indicates clusters or whether it might have arisen by chance alone. As stated previously, TBD cases tend to be aggregated so, rather than presence of clusters, it is important to gain an insight into the ‘character of dispersion’, which may contribute to ecological studies of a particular disease. Several statistical methods for spatial clustering have been adopted to analyse TBD, namely methods for quadrat counts, second-order methods, Moran statistic, and Kulldorff-Nagarwalla statistic.
Quadrat technique
This method combines the spatial approach with classical statistical methods (Rogers, 1974). Regular grids are placed on an incidence map yielding cell counts of cases which can be analysed by standard methods such as the goodness-of-fit test or regression. Although this is not a true spatial method, as it ignores spatial context of the counts, it is recommended for its simplicity in exploratory studies. When applied to LB and TBE incidences in an endemic area this technique showed that, although geographically correlated, quadrat counts of LB cases were nearly random following a Poisson distribution while those of TBE were distinctly aggregated showing a Neyman distribution (Zeman, Vitkova & Markvart, 1990). This technique has also been employed to investigate correlations between LB incidence and some explanatory variables (Nicholson & Mather, 1996).
Second-order methods
These are suited for analysing point-pattern disease maps and are methods based on a mathematical theory of distribution of between-point distances (Diggle, 1983). The crucial statistic is the K function, which characterizes how the number of neighbours varies with distance in an analysed point pattern. A plot of K(r)−πr2 versus r (where r is a radius) illustrates the mean excess of cases over a homogeneous Poisson model of the same point density within r about any case. For a ‘random’ pattern, it coincides with the x axis (no excess) while positive and negative shifts indicates clustering and regularity, respectively (Fig. 4). Another useful statistic is

, sometimes referred to as the L function. Testing significance in these methods relies on Monte Carlo simulations (Fig. 5). An example of applications of these methods in the study of TBD includes cattle anaplasmosis (Hungerford, 1991), I. scapularis infested deer (Kitron et al. 1992), and human LB and TBE (Zeman et al. 1990; Zeman, 1997).

Fig. 4. Principal types of spatial distribution: (a) random, (b) regular, and (c) aggregated, and corresponding shapes of the K(r)−πr2 diagram clearly distinguishing between them (reproduced with permission, Zeman, Vitkova & Markvart (1990)).

Fig. 5. Plot of K(r)−πr2 statistic versus radius in km for tick-borne encephalitis cases (solid) along with confidence envelopes of a Monte Carlo model of complete spatial randomness (dotted) documents that spatial clustering is well pronounced in this disease (reproduced with permission, Zeman (1997)).
Moran's I statistic
This is a measure of spatial autocorrelation between ordinal or interval values relating to regions or points (Moran, 1950). It is used to test whether values of a variable observed at adjacent geographical locations, such as incidence data in administrative regions of a country, resemble each other more than expected under a randomness model. Classic Moran's I does not allow for heterogeneity in the population denominator, which increases the type I error, so several improvements have been proposed. A variant of the population density adjusted estimator was applied to LB incidence data in Georgia, USA showing spatial autocorrelation between county rates (Oden, 1995). Application of Moran's I to LB morbidity, I. scapularis distribution and vegetation cover in Wisconsin showed autocorrelation as well as cross-correlation between these variables (Kitron & Kazimierczak, 1997).
Kulldorff-Nagarwalla's method
This method is a spatial version of the scan statistic with a circular window of variable size systematically sampling the population in an area of study. The existence of ‘clustered circles’ is tested such that, for all individuals within the circle, the probability of being a case is significantly higher than for individuals outside the circle. The test statistic is based on the likelihood ratio and achieved via Monte Carlo simulation (Kulldorff & Nagarwalla, 1995). Although general application is possible, this method is particularly suitable for aggregated data such as incidences per census units. A clustering of cases of human granulocytic ehrlichiosis in Connecticut was investigated by this method (Chaput, Meet & Heimer, 2002).
Computing risk maps
Once it is established that disease clustering occurs, it is worth proceeding with a statistical mapping procedure in order to highlight any underlying risk pattern. Most methods are based on a model of continuous space change that can be approximated by a smooth, mathematically-defined surface. These techniques have been reviewed elsewhere (e.g. Lam, 1983; Van Beurden & Hilferink, 1993; Lawson, 2001). The literature includes several examples of maps of TBD risk assessed by means of kernel estimator, kriging and splines. Sometimes it is also desirable to compare two spatial patterns of disease cases. By means of the Kelsall-Diggle estimator it is feasible to compute a relative-risk map.
Kernel interpolation at an inserted point is achieved by averaging surrounding values weighted with a distance-decaying function, e.g. Gaussian. This method is applicable for both continuous measures and point pattern data (Bithell, 1990; Lawson & Williams, 1993). It requires judgement concerning a parameter that controls the smoothness of the estimated surface (so called ‘window width’). Even if ‘objective’ methods for its selection are available (e.g. cross-validation), an empirical ‘trial-and-error’ approach sometimes leads to maps that are more acceptable from a practical point of view. Kernel smoothing of points of infection was applied to compute the risk maps of LB and TBE (Zeman, 1997).
Kriging is an interpolation method based on a generalised linear least-squares algorithm, using variograms as weighting functions. Variograms depict the average squared difference between data values as a function of distance and orientation between data locations (Isaaks & Srivastava, 1989). Kriging is a popular and widely implemented method of surface mapping in GIS packages; however, it lacks a unique solution and needs a large amount of interactive input and subjective assessment during the processing. This method was used to create a model that predicts LB transmission risk in Rhode Island, USA based on a survey of nymphal I. scapularis population density (Nicholson & Mather, 1996).
Splines are techniques of piecewise polynomial interpolation (Journel & Huibregts, 1978). An interpolated surface is composed of a number of elementary ‘tiles’ characterized by polynomials of a low degree fitting the enclosed data-points and extended to adjacent polynomials so that the whole surface is continuous and smooth. Splines usually tend to intersect the observed values, and require rather subjective tuning up of the control lattice (an analogy with the ‘window width’ parameter of the kernel estimator). A modification of this method was tested with epidemiological data for TBE (Krejcir, 2000).
Kelsall-Diggle relative-risk estimation method is a double kernel smoothing procedure for two point patterns (Kelsall & Diggle, 1995). It is suitable for analysing spatial variation of two types of health events if the question of interest is whether they are distributed equally. If not, an identification of areas of unusually high or low incidence of one of the two types is possible. In a surveillance of LB, for example, patients were invited to specify likely infection origin as either tick-bite, or insect-bite or unknown. Spatial pattern of their residential addresses was then analysed by the Kelsall-Diggle method assuming that all cases originated from tick-bite transmissions even if they were unrecognised (Fig. 6). The analysis, however, showed significant differences between the distribution of ‘tick’ cases and that of ‘insect’ and ‘unknown’ cases (Zeman, 1998, 1999).

Fig. 6. Log relative risk of acquiring Lyme borreliosis through the ‘tick’ or ‘insect’ bite according to self-reported data in cases from Central Bohemia computed by the Kelsall-Diggle's method; test of non-constant ratio gave p-value of 0·023, and solid and dashed lines indicate where the 95% tolerance limits were surpassed for the ‘insect’ and ‘tick’ reports, respectively (reproduced with permission, Zeman (1997)).
This is not an exhaustive review of all work in the field of spatial analysis of TBD data. Some other approaches such as Bayesian and Markoff Chain Monte Carlo (MCMC) methods have been used. The purpose here is to provide an overview of the main analytical approaches currently available which can be employed in TBD research. Despite wide interest in the methodology of GIS and spatial epidemiology, users of the methodologies usually have some statistical knowledge.
SATELLITE REMOTE SENSING
Description of remote sensing data
Remote sensing is an information technology providing information on landscape (i.e. biophysical properties of the real world) through measured values of electromagnetic radiation from the landscape surface.
Electromagnetic radiation is characterized by two parameters: intensity of electromagnetic energy carried by the radiation and wavelength of the radiation. The energy interacts with an object and is reflected or emitted from the object. The energy is modified in a unique way by a given object that distinguishes it from the radiation energy measured on a particular wavelength. It is this energy that is measured and converted into data for subsequent processing. Information about the surface of the earth can be derived from spatial and spectral distributions of energy emanating from the surface, and also from temporal variations in the distributions.
The optical region of the spectra (0·3 μm–1000 μm) is commonly used for remote sensing. For practical reasons the optical region is divided into several shorter wavelength intervals of the visible (0·3–0·7 μm), near-infrared (0·7–1·1 μm), middle-infrared (1·1–5 μm), thermal infrared (5–100 μm) and submillimetre infrared (100–1000 μm) region of the spectrum. Due to atmospheric absorption, only wavelengths shorter than about 15 μm are used from the optical spectrum. Other portions of the electromagnetic spectrum are also useful in remote sensing, e.g. waves from the microwave region (0·01 m–1·0 m) penetrate clouds. Remote sensing measurements are particularly discriminating when using several very narrow spectral bands and producing a multispectral data set. In contrast, monospectral data are obtained if only one spectral band is used for measurement (e.g. panchromatic band covering the entire or a substantial part of the visible radiation). The number of channels or bands defines a dimension of the acquired data set. Increased utility of narrow spectral bands has resulted in the progressive narrowing of bands and increased the number of bands used 10- to 100-fold. This hyperspectral remotely sensed data allows more accurate feature identification. Radiation energy is measured using a radiometer. The size of the surface area (pixel) from which a radiometric value is determined defines the spatial resolution, while the number and width of the spectral bands measured define the spectral resolution of the radiometer. Individual pixels captured in continuous lines and columns make up an image. A line of detectors or a mirror enables pixels to be measured in a row, whilst the movement of a platform within the radiometer generates a second dimension of the image. Imaging radiometers are called scanners or multispectral scanners when producing a multispectral data set.
Scanner platforms use various types of carrier, but operational remote sensing systems are based on satellites. At present, Earth-observation satellites circle in specific orgbits. Near-polar, sun-synchronous orbits carry satellites over both poles. As the Earth rotates below the satellite it brings all sites on the globe within the satellite's field of view. The plane of the orbit is fixed with respect to the sun. As a result, measurements are taken by the radiometer at approximately the same solar illumination conditions for each daytime overpass. Orbiting around the Earth brings a satellite repeatedly over the same site on the surface. The time interval between two successive measurements of the same site determines the time resolution of the scanner.
Scanners are passive remote sensing systems measuring reflected or emitted radiation originating from a natural source (e.g. Sun, Earth), whereas an active remote sensing system generates radiation from artificial sources within the system (e.g. radar, lidar).
Characteristic properties of remote sensing data
Both optical and microwave systems have their limitations for Earth surface applications. Two major categories of data distortion can be defined: (1) radiometric distortions caused by, e.g. atmospheric effects and changes in detector sensitivity; and (2) spatial or geometric distortions due to e.g. oblique view, altitude changes along the orbit, instability of the spacecraft and Earth rotation. The consequence is that repeated measurements taken by different or even the same sensor will have a component of variation owing to the pixel size, variable atmospheric path length, variable atmospheric conditions and the time-space variability of the environmental conditions being measured. These distortions can be identified and corrected by using an array of in situ measurement sites to provide ‘ground truth’ data.
Radiometric data corrections
Measured values of all remote sensing systems are modified by interactions of the radiation with atmospheric particles. Atmospheric water molecules in vapour, liquid and/or solid forms are the primary controlling variable. Optical scanner measurements can even be completely obscured by water particles concentrated in clouds. Other atmospheric molecules, such as dust and smoke, offset radiometric measurements of the Earth's surface from true near-surface measured values.
Sensor data output calibration is essential for quantitative use of any radiometric data. The calibration consists of established procedures to relate sensor output data to Earth radiance measurements. Each instrument is tested in the laboratory for stability, linearity and sensitivity to radiance using standard sources of selected electromagnetic waves. Detectors deteriorate in orbit, thus some in-flight calibration may be performed. Calibration data are used to convert the Earth data from digital counts to absolute radiometric values. In-flight calibration is used for infrared measurements because the detectors are sensitive to aging. Measurements of the visible or near-infrared radiation are not so demanding and pre-flight calibration can be employed. To compare data from different satellites, quantitative calibrated values must be used. Additionally, users of long-term data series must take account of calibration drift.
Geometric correction of image data
Raw data obtained by imaging radiometers differ from maps owing to changes in topography and the orientation of the platform with the scanner. These parameters result in picture element (pixel) size variations over the image and displacement of mutual pixel positions. This makes geometric comparisons with other representations of the same area (e.g. another satellite scene or maps) very difficult. Geometrical transformations must be performed to make raw scanner data or unrectified images comparable with another image or map. During the process of geometrical transformation, the location coordinates of image elements are changed. This tags each pixel with its correct latitude and longitude values, removes the geometric distortion, and can even rectify the entire image into a selected map projection. In this geometric form, spatial data from remote sensing are geocoded and ready to be combined with other data in GIS.
Getting information from data
Satellite sensors are designed to have a direct relationship between the radiometric variable being measured (e.g. radiance or emittance) and the digital number (DN) value. Remote sensing data in absolute radiometric values or as relative numeric digits need to be transformed into the kind of information requested by a specific application. The usual approach is to convert a set of image data into a thematic map. This can be reached through two types of data processing: visual interpretation of the image or digital classification performed by a computer.
Visual analysis discerns image features recognised by the human eye (generally tonal, textural and contextual features). Although visual interpretation is still used widely and can be accurate, it is not without problems. Key concerns are subjectivity in the interpretation, difficulty of handling large multispectral data sets acquired by many remote sensors, and the problem of maintaining a standardised classification.
Computer-based classification techniques can make fuller use of the data set and be undertaken in a more objective manner. Generally, spectral values are used for assigning a class to measured values, although textural, contextual or polarisation features also apply. Digital image classification is commonly used to analyse remotely sensed data because it is readily integrated with other digital spatial data sets within a GIS. Two approaches are used: unsupervised and supervised classification.
Unsupervised classification
Unsupervised classifiers are effectively clustering algorithms. The classification algorithm groups together pixels with similar properties and gives them a class label. Since feature values (e.g. spectral responses) are specific for every group of landscape object, clusters may be expected to identify land cover classes. A major problem with unsupervised classification is that there is no guarantee that the clusters will correspond to relevant land cover classes. Therefore, an unsupervised classification is often inappropriate and a supervised classification should be used.
Supervised classification
Supervised classification uses a priori knowledge of the land-cover classes to be identified in the data set. The classification comprises three key stages. Firstly, the training stage in which sites of known land cover class are identified in the image and characterized by given features. The end product of this stage is a set of training statistics that describe the features of the classes to be mapped. Secondly, the training statistics are used in combination with a classification algorithm to allocate each pixel in the image to a land cover class. This typically involves a comparison of the pixel's features with those of the classes derived in the training stage and allocation of the pixel to the class with which it has greatest similarity. In this way, the remotely sensed image is converted into a thematic map depicting the spatial distribution of the land cover classes of interest. The final stage of the classification is the validation stage in which the accuracy of the classification is assessed. This aims to derive a quantitative measure of the accuracy with which land cover has been mapped. The end product of the supervised classification is, therefore, a map of known accuracy that depicts the spatial distribution of land cover classes of interest.
Many factors affect the accuracy of a supervised classification. To date, the majority of digital image classifications have used a conventional statistical classification algorithm. Probabilistic techniques such as the maximum likelihood classifier and discriminant analysis have been particularly popular. These approaches have firm statistical foundations and allocate each case (e.g. pixel) to the class with which it has the highest probability of membership. Although this is an intuitively appealing approach and can be accurate, the correct application of such classifications requires the satisfaction of several assumptions that are not always tenable and it is sometimes difficult to integrate ancillary data into the analysis. Consequently, considerable attention has been directed to developing alternative classification approaches. This has included the use of a range of non-parametric classifiers, with approaches based on evidential reasoning or neural networks. Comparative studies using a suite of classification methods have shown repeatedly that for most imagery and landscapes, neural networks provide the most accurate classification of land cover.
Future developments will further enhance the novel use of remote sensing techniques in obtaining environmental information about the Earth's habitats. Increased applications for remote sensing techniques result not only from the use of new sensors or improved algorithms, but increasingly from the methodology to merge data from various sources into an end-product tailored to a specific need.
Besides sophisticated sensors and effective algorithms for data processing, the success of the final result depends on the collection of spatially- or spectral-temporally relevant remote sensing data. In this context, spatially-relevant means that the spatial resolution of the sensor data is sufficient to distinguish important habitats; spectral-temporally relevant means the appropriate combination of sensor and acquisition date(s) to identify the habitats in question. Additional aspects include the use of improved sensors with better spatial, spectral and/or temporal characteristics, and the use of better classification algorithms (faster and more accurate) or data fusion techniques for multi-source sensor data. Finally, the use of existing geo-referenced information from other sources needs consideration, including knowledge of human activity, soil characteristics, topography and climate data, to generate more accurate classifications.
Satellite remote sensing systems
Data from remote sensing satellites have been used successfully to monitor environmental conditions suited to the emergence and outbreak of infectious diseases. In several projects, the relationships between environmental parameters sensed by satellites (e.g. water, temperature and vegetation cover), the occurrence of disease vectors (e.g. mosquitoes, ticks and flies), disease reservoirs (e.g. deer and rodents) and patterns of human settlements, migration and land use, have been established. Based on such relationships, predictive models can be developed to aid public health efforts to control specific diseases.
The earliest family of polar-orbiting meteorological satellites came on-line in the 1960s supplying valuable data for national meteorological services around the world. The best known satellites of this type are the NOAA series of satellites, managed by the US National Oceanic and Atmospheric Administration. Besides meteorology, data from the main imaging sensor, the Advanced Very High Resolution Radiometer (AVHRR), of NOAA satellites have found widespread applications in oceanography, agriculture, hydrology, forestry and other fields. A broader range of satellites, with low spatial resolution for environmental monitoring, has been introduced over the years (Table 2).

Typical features of this group are scanners with a large swath width implying a high revisit rate and large pixel size. These properties enable investigations of dynamic phenomena on a global and continental scale. As low-resolution data are the cheapest satellite data available, they are the primary data sources for global change studies and are useful for real-time information where timing is crucial. However, these features have drawbacks for other types of analysis. The geometry of a large swath width results in substantial enlargement of the pixel size at the picture edges compared to pixels in the middle of the line. A pixel size of 1 km for vertical pixels can reach several kilometres for oblique measurements. In addition to the need of geometrical corrections, a pixel of this size often covers too much heterogeneous landscape. When analysing pixels with much inherent variability of classes, it is impossible to assign an average radiometric value for the whole pixel area to just one class. The same applies to other values derived from original measurements (e.g. NDVI, LST). Analysis of remote sensing data requires either defined classes of homogeneous areas in the pixel or a more complex knowledge of radiometric values corresponding to all possible area ratios of class combinations within the pixel. With pixels of one kilometre, NOAA-type data cannot be used for local or even regional scale environmental studies.
The opportunity to improve mapping from space of biotic and abiotic components followed the launch of the first Landsat satellite in 1972. The MSS scanner on this US satellite measured 60 m pixels in four spectral bands. For 14 years, Landsat satellites were the only source of remote sensing data with such resolution. French Spot 1 added a new scanner (HRV) providing multispectral data of 20 m pixel and 10 m pixel in panchromatic mode. At present, there are many potentially useful sensors for mapping vegetation type (Table 3). The latest satellite of the Landsat series, Landsat-7, has an advanced ETM+ scanner providing 30 m multispectral data, a 15 m panchromatic band, and an improved 60 m thermal infrared band. The latest Spot 5 satellite has improved spatial resolution in the panchromatic band down to 2·5 m and multispectral data for 10 m pixels. Ikonos, a commercial satellite, has started a new generation of very high-resolution satellites (1 m pixels in the panchromatic band and 4 m in visible and near infrared spectral bands) providing data for detailed studies on large scales.

In addition to the passive systems shown in Tables 2 and 3, there are also active remote sensing systems in orbit (Table 4). Synthetic aperture radars (SAR) are particularly important as they can penetrate cloud and vegetation canopy cover and can detect soil moisture and surface roughness.

APPLICATIONS OF REMOTE SENSING IN THE STUDY OF TICK OCCURRENCE AND IN TICK-BORNE DISEASE EPIDEMIOLOGY
The potential use of aerial photography and other remote-sensing techniques in epidemiological studies was first realized in 1970 when the National Aeronautics and Space Administration (NASA) created the Health Applications Office (HAO). NASA coined a new term, ‘Econoses’ to describe diseases dependent on environmental conditions. During 1970–1976, HAO staff and contractors published about 100 scientific reports concerning remote sensing in health-related programmes (Barnes, 1991), including a mosquito habitat verification, but none referred to ticks. In 1977, aerial photographs were used to map habitats of I. persulcatus during the building of the Baikal-Amur railway in Asiatic Russia (Kuzikov et al. 1982).
The era of RS in the identification of disease vector habitats commenced with the review of Hugh-Jones (1989). Known sites of Amblyomma variegatum infestation were identified in northern St. Lucia in the Caribbean using the MSS scanner of LANDSAT-1. The study was then extended to Guadeloupe where the analysis of LANDSAT TM imagery identified a series of habitats that appeared to have different tick-carrying capacities (see also Hugh-Jones, 1991). Subsequently, Dermacentor variabilis habitats in Orange County, North Carolina were identified using LANDSAT TM scanner data (Cooper & Houle, 1991), while the distribution and abundance of Rhipicephalus appendiculatus in East Africa used in the CLIMEX model and data from NOAA satellites (Perry et al. 1991).
The first identification of I. ricinus habitats in Europe based on LANDSAT MSS data was published by Daniel & Kolář (1990). Satellite and aerial imagery were used in the study of I. scapularis in the environs of New York (Duffy et al. 1994), and Randolph (1993) used RS data to study the seasonal abundance of R. appendiculatus in South Africa. After the mid-1990s, the number of papers on ticks based on RS data increased sharply.
Several landscape features discernible from satellite data have important implications in tick epidemiology, vegetation type being the most important (Table 5). Mapping the boundary between vegetation types, or ecotones, is also important as an indicator of habitats for hosts that are critical to the maintenance and transmission of tick-borne diseases. These boundaries may be areas of increased risk for tick–human contact. Additionally, soil moisture is an indicator of suitable tick habitats.

To date, most remote sensing applications for mapping tick-borne diseases risk areas have exploited vegetation types. The distribution of vegetation types results from the combined impact of rainfall, temperature, humidity, topographic effects, soil, water availability and human activities. Vegetation type identification is suited to remote sensing technology because radiometers onboard satellites detect radiation from the thin upper layer of surface objects. Vegetation type is independent of its height above ground. By contrast, the temperature of the top surface of a biomass differs from the enclosed microclimate, and differs in its flux and variance margins (Hugh-Jones, 1991). Temperature values can be derived from radiometric values measured in the thermal infrared part of the spectrum. Even when corrections are applied, the resulting value applies to the top of the vegetation canopy and says nothing of the ground-level microclimate, which is the main factor influencing tick ecology. The extent to which remotely sensed data are used for studying the spatial and temporal patterns of disease depends on a number of factors. On the whole, inadequate resolution in terms of pixel size and spectral channel or accessibility of satellite data have restricted the use of remote sensing.
A ground resolution threshold of 30 m should be considered as the upper limit for exploring the relationship between vegetation type and disease vectors, reservoirs, and hosts, especially in anthropologically-modified landscapes. If vegetation types and forest patches are difficult to discern, the mosaic pattern typical of tick and tick-borne disease distributions is lost (Gilot, 1985).
The number and sophistication of studies using remote sensing and GIS technology have increased dramatically over the last decade. In 1998, NASA's Centre for Health Applications of Aerospace Related Technologies (CHAART) evaluated current and planned satellite sensor systems as a first step in enabling human health scientists to determine data relevant for the epidemiological, entomological and ecological aspects of their research, as well as developing RS-based models of transmission risk (Beck et al. 2000). An overview describing the methodology of detecting environmental variables using remote sensing and disease risk forecasting is given by Hay, Randolph & Rogers (2000).
Research involving remote sensing data to study tick-borne disease has focused on investigating the application of satellite data and spatial analysis techniques to identify and map landscape elements that collectively define vector and human population dynamics related to disease transmission risk (Daniel & Kolář, 1990).
A study to develop remote sensing-based models for mapping Lyme disease transmission risk was accomplished during the last decade in the northeastern United States. The first study compared Landsat TM data with canine seroprevalence rate and summarised at the municipality level. The amount of remotely sensed deciduous forest was positively correlated with canine exposure to Borrelia burgdorferi. Another study used TM scanner data to map relative tick abundance on residential properties by using TM-derived indices of vegetation greenness and wetness (Dister et al. 1997). The final report of the European Union Concerted Action on Lyme Borreliosis (EUCALB) project (Gray et al. 1998) included recommendations to apply remote sensing and GIS tools in European health services.
Detailed mapping of tick-borne encephalitis (TBE) risk habitats in the Czech Republic marked another step forward in the implementation of remote sensing technology for practical health service (Daniel et al. 1998). This study used long-term records of clinical cases of TBE. In the Czech Republic TBE is a reported disease and only cases that have been verified in the laboratory are registered. The records include locations in which tick bites occurred and identified permanent residents of the region under study. Spatially located ground data of TBE incidences documented over the period 1971–2000 in 5 regions of the Czech Republic (area 52000 km2) and Landsat TM data of 30 m resolution were used in the analysis. Detailed classification of the satellite data, supported by observations from field checks, resulted in the definition of nine vegetation-types related to various risk levels of I. ricinus attack and TBE occurrence. The relationship between risk level and vegetation type, including the importance of ecotones for the circulation of TBE virus, were ascertained. A mathematical model was built that described the epidemiological significance of the structure of the vegetation cover of the landscape to the risk of acquiring TBE. Based on this methodology, risk sites of various levels were determined at the pixel level, and maps printed at 1[ratio ]25000 scale. An atlas of prognostic risk site maps has been produced (Daniel & Kříž, 2002) containing 20 maps at a 1[ratio ]200000 scale together with distribution maps of TBE occurrence (Fig. 7). Several accompanying examples of 1[ratio ]25000 scale maps are included in the atlas (Fig. 8). The spatial distribution of vector and host species relates not simply to the occurrence of forests or grasslands but also to the distribution of specific vegetation types. The study demonstrates the epidemiological importance of spatial heterogeneity of the landscape at the level appropriate to the size of tick habitats. Such studies are possible only if ground truth data for disease distribution are available with the required location accuracy.

Fig. 7. Predictive map of Ixodes ricinus high-occurrence habitats and TBE risk assessment – TBE natural focus territory in the Berounka river valley, Central Bohemia, Czech Republic. Map in original scale 1[ratio ]200000 prepared for assessment of general epidemiological situation. The colour scale is the same as in Fig. 8 (reproduced with permission, Daniel & Kříž (2002)).

Fig. 8. Predictive map of Ixodes ricinus high-occurrence habitats and TBE risk assessment – a part of TBE natural focus in the surroundings of Kaplice town, southern Bohemia, Czech Republic. Risk habitats are dispersed in small ‘islands’ forming a very typical mosaic pattern of elementary foci. Map in original scale 1[ratio ]25000 prepared for a detailed local orientation and a spatial structural analysis (reproduced with permission, Daniel & Kříž (2002)). The colour scale (valid also for Fig. 7): (1) spruce wood cultures of homogeneous structure – practically without TBE risk; (2) coniferous (mostly spruce) wood cultures with heterogeneous structure – essentially without TBE risk; (3) mixed woods mostly with tall stems and prevailing conifers pose high TBE risk; (4) deciduous shrubs with fine grain size of the stand mosaic – high TBE risk; (5) mixed wood stands mostly young low and dominated by deciduous trees – high TBE risk; (6) young deciduous stands and ecotones with highly heterogeneous structure – peak TBE risk; (7) young deciduous wood stands of homogeneous structure – marked TBE risk; (8) tall deciduous woods of homogeneous structure – marked TBE risk; (9) tall deciduous woods of heterogeneous structure – considerable TBE risk.
At the country or continental scale, imagery from meteorological satellites has been used to relate the temporal patterns and variations in rainfall and vegetation green-up. Much of this work used data from the AVHRR scanner onboard meteorological NOAA satellites passing over Africa (Rogers & Randolph, 1993) and Europe (Randolph, 2000). In Europe, a carthogram of TBE distribution produced by the pharmaceutical industry (IMMUNO, 1997) provided the ground truth data set for two areas in central Europe and the Baltic region (Randolph, 2000). Correlation between the ground data and AVHRR data generalised to 8 km pixels has been used as a basis for the TBE prediction map including various possible scenarios in the years 2020–2080 (Randolph & Rogers, 2000). Owing to the characteristics of low resolution satellites (described above), the quality of these for a landscape with highly diversified habitats is insufficient for practical use in decision making.
Technologies now allow distribution of the information in a user-friendly format for the general public, which contributes to prevention and early warnings of impending global health issues. Early warnings are a prerequisite for mitigation measures aimed at reducing the impact of infectious diseases. With the launch of 20 new remote sensing satellites expected by the year 2010, data-collection capabilities will increase considerably. The new generation of research and operational earth observation satellites will provide users with higher spectral and spatial resolutions. Hyperspectral and high spatial resolution satellite sensor imagery will provide new opportunities for determining environmental conditions favourable to various disease vectors. These improved capabilities, when combined with the increased computing power and spatial modelling capabilities of geographical information systems, should extend the use of remote sensing into operational disease surveillance and control. However, it should not be forgotten that successful use of new remote sensing and GIS technologies for landscape epidemiology is dependent on the user appreciating every part of the geoinformation technology chain i.e. data acquisition, image processing and analysis, database development, field support and spatial statistics and modelling.
The application of GIS and RS allows considerable precision in the spatial analysis of tick and TBD distribution and in the drawing up of maps that are applicable for: (1) analyzing the epidemiological situation and planning the management and prevention of TBD within the public health arena; and (2) formulating hypotheses that determine future research. Although RS helps us in formulating hypotheses, the definitive resolution of problems must be sought on the ground. Without verification of RS results in the field, general and definite conclusions cannot be made. As Hugh-Jones (1991) said, ‘The use of RS and GIS results in more field work, not less, because the truth is on the ground, not in the computer. The advantage is that we know exactly where to go in the field’ or, ‘Why should I believe you when you are sitting at the computer terminal with clean boots!?’.
ACKNOWLEDGEMENTS
We are very grateful to Patricia Anne Nuttall and Alan S. Bowman for linguistic and stylistic review of the manuscript.
References
REFERENCES
BALÁT, F. &
ROSICKÝ, B. (
1954).
Birds in lowland forests, their role and importance for the existence of natural foci of diseases.
Československá parasitologie
1, 22–44. (In Czech.)Google Scholar
BARNES, C. M. (
1991).
An historical perspective on the applications of remote sensing to public health.
Preventive Veterinary Medicine
11, 163–166.CrossRefGoogle Scholar
BECK, L. R., LOBITZ, B. M. &
WOOD, B. L. (
2000).
Remote sensing and human health: new sensors and new opportunities.
Emerging Infectious Diseases
6, 217–227.CrossRefGoogle Scholar
BENDA, R. (
1958).
The common tick Ixodes ricinus L. as a reservoir and vector of tick-borne encephalitis. I. Survival of the virus (strain B 3) during the development of the tick under laboratory conditions.
Journal of Hygiene, Epidemiology, Microbiology and Immunology
2, 314–330.Google Scholar
BITHELL, J. F. (
1990).
An application of density estimation to geographical epidemiology.
Statistics in Medicine
9, 691–701.CrossRefGoogle Scholar
BLAšKOVIČ, D. (
1967).
Studies on tick-borne encephalitis.
Bulletin of the World Health Organization
36 (Suppl. 1), 1–95.Google Scholar
CAREY, A. B., McLEAN, R. G. &
MAUPIN, G. O. (
1980).
The structure of a Colorado tick fever ecosystem.
Ecological Monographs
50, 131–151.CrossRefGoogle Scholar
CDC – CENTERS FOR DISEASE CONTROL AND PREVENTION (
1994).
Addressing Emerging Infectious Disease Threats: A Strategy for the United States.
Atlanta, GA:
U.S. Department of Health and Human Services, CDC.
CDC – CENTERS FOR DISEASE CONTROL AND PREVENTION (
1998).
Preventing Emerging Infectious Diseases: A Strategy for the 21st Century.
Atlanta, GA:
U.S. Department of Health and Human Services, CDC.
CHAPUT, E. K., MEEK, J. I. &
HEIMER, R. (
2002).
Spatial analysis of human granulocytic ehrlichiosis near Lyme, Connecticut.
Emerging Infectious Diseases
8, 943–948.CrossRefGoogle Scholar
CLIFF, A. D. &
HAGGETT, P. (
1988).
Atlas of the Distribution of Diseases: Analytical Approaches to Epidemiological Data.
Oxford, Blackwell.
COOPER, J. W. &
HOULE, J. U. (
1991).
Modelling disease vector habitats using thematic mapper data: identifying Dermacentor variabilis habitats in Orange County, North Carolina.
Preventive Veterinary Medicine
11, 353–354.CrossRefGoogle Scholar
CUMMING, G. S. (
2000 a).
Using habitat models to map diversity: pan-African species richness of ticks (Acari: Ixodida).
Journal of Biogeography
27, 425–440.Google Scholar
CUMMING, G. S. (
2000 b).
Using between-model comparisons to fine-tune linear models of species ranges.
Journal of Biogeography
27, 441–455.Google Scholar
CUMMING, G. S. (
2002).
Comparing climate and vegetation as limiting factors for species ranges of African ticks.
Ecology
83, 255–268.CrossRefGoogle Scholar
DANIEL, M. &
DUSBÁBEK, F. (
1994).
Micrometeorological and microhabitat factors affecting maintenance and dissemination of tick-borne diseases in the environment. In
Ecological Dynamics of Tick-borne Zoonoses (
ed. Sonenshine, D. E. & Mather, T. N.), pp.
91–138.
New York and Oxford, Oxford University Press.
DANIEL, M. &
KOLÁŘ, J. (
1990).
Using satellite data to forecast the occurence of the common tick Ixodes ricinus (L.).
Journal of Hygiene, Epidemiology, Microbiology and Immunology
34, 243–252.Google Scholar
DANIEL, M., KOLÁŘ, J., ZEMAN, P., PAVELKA, K. &
SÁDLO, J. (
1998).
Predictive map of Ixodes ricinus high-incidence habitats and a tick-borne encephalitis risk assessment using satellite data.
Experimental and Applied Acarology
22, 417–433.CrossRefGoogle Scholar
DANIEL, M., KOLÁŘ, J., ZEMAN, P., PAVELKA, K. &
SÁDLO, J. (
1999).
Tick-borne encephalitis and Lyme borreliosis: comparison of habitat risk assessments using satellite data.
Central European Journal of Public Health
7, 35–39.Google Scholar
DANIEL, M. &
KŘÍŽ, B. (
2002).
Tick-borne Encephalitis in the Czech Republic: I. Predictive maps of Ixodes ricinus tick high-occurrence habitats and a tick-borne encephalitis risk assessment in Czech regions; II. Maps of tick-borne encephalitis incidence in the Czech Republic in 1971–2000. National Institute of Public Health, Prague. Project WHO/EC Climate Change and Adaptation Strategies for Human Health in Europe, EVK-2-2000-0070.
DANIELOVÁ, V., HOLUBOVÁ, J. &
DANIEL, M. (
2002).
Tick-borne encephalitis virus prevalence in Ixodes ricinus ticks collected in high risk habitats of the South-Bohemian region of the Czech Republic.
Experimental and Applied Acarology
26, 145–151.CrossRefGoogle Scholar
DANIELOVÁ, V., HOLUBOVÁ, J., PEJČOCH, M. &
DANIEL, M. (
2002).
Potential significance of transovarial transmission in the circulation of tick-borne encephalitis virus.
Folia Parasitologia
49, 323–325.CrossRefGoogle Scholar
DE GARINE-WICHATITSKY, M. (
2000).
Assessing infestation risk by vectors: spatial and temporal distribution of African ticks at the scale of a landscape.
Annals of the New York Academy of Sciences
916, 223–232.CrossRefGoogle Scholar
DIGGLE, P. J. (
1983).
Statistical Analysis of Spatial Point Patterns.
London, Academic Press.
DISTER, S. W., FISH, D., BROS, S., FRANK, D. H. &
WOOD, B. L. (
1997).
Landscape characterization of peridomestic risk for Lyme disease using satellite imagery.
American Journal of Tropical Medicine and Hygiene
57, 687–692.CrossRefGoogle Scholar
DUFFY, D. C., CLARK, D. D., CAMPBELL, S. R., GURNEY, S., PERELLO, R. &
SIMON, N. (
1994).
Landscape patterns of abundance of Ixodes scapularis (Acari: Ixodidae) on Shelter Island, New York.
Journal of Medical Entomology
31, 875–879.CrossRefGoogle Scholar
ESTRADA-PEÑA, A. (
1999).
Geostatistics and remote sensing using NOAA-AVHR satellite imagery as predictive tools in tick distribution and habitat suitability estimations for Boophilus microplus (Acari:Ixodidae) in South America.
Veterinary Parasitology
81, 73–82.CrossRefGoogle Scholar
ESTRADA-PEÑA, A. (
2001 a).
Distribution, abundance, and habitat preferences of Ixodes ricinus (Acari: Ixodidae) in northern Spain.
Journal of Medical Entomology
38, 361–370.Google Scholar
ESTRADA-PEÑA, A. (
2001 b).
Forecasting habitat suitability for ticks and prevention of tick-borne diseases.
Veterinary Parasitology
98, 111–132.Google Scholar
GERN, L., ESTRADA-PEÑA, A., FRANDSEN, F., GRAY, J. S., JAENSON, T. G. T., JONGEJAN, F., KAHL, O., KORENBERG, E., MEHL, R. &
NUTTALL, P. A. (
1998).
European reservoir hosts of Borrelia burgdorferi sensu lato.
Zentralblatt für Bakteriologie
287, 196–204.CrossRefGoogle Scholar
GILOT, B. (
1985). Bases biologiques, ecologiques et cartographiques pour l'etude des maladies transmises par les tiques (Ixodidae et Argasidae) dans les Alpes Francaises et leur avant-pays.
Theses pour Docteur es-Sciences, Université de Grenoble.
GILOT, B., PAUTOU, G. &
LACHET, B. (
1981).
La cartographie des populations de tiques exophiles a visée épidemiologique. Application a la fièvre boutonneuse méditerranéenne essai a 1/200000 dans la basse valleée du Rhône.
Documents de Cartographie Ecologique, Grenoble
34, 103–111.Google Scholar
GILOT, B., PAUTOU, G. &
MONCADA, E. (
1975).
L'analyse de la végétation appliqué à la détection des populations de tiques exophiles dans le Sud-Est de la France; l'example d'Ixodes ricinus (Linné, 1758).
Acta Tropica
32, 340–347.Google Scholar
GILOT, B., PAUTOU, G., MONCADA, E., LACHET, B. &
CHRISTIN, J. G. (
1979).
La cartographie des populations de tiques exophiles par le biais de la vegetation: bases écologiques, intérêt épidemiologique.
Documents de Cartographie Ecologique, Grenoble
22, 65–80.Google Scholar
GLASS, G. E., AMERASINGHE, F. P., MORGAN, J. M. &
SCOTT, T. W. (
1994).
Predicting Ixodes scapularis abundance on white-tailed deer using geographic information systems.
American Journal of Tropical Medicine and Hygiene
51, 538–544.CrossRefGoogle Scholar
GLASS, G. E., SCHWARTZ, B. S., MORGAN, J. M., JOHNSON, D. T., NOY, P. M. &
ISRAEL, E. (
1995).
Environmental risk factors for Lyme disease identified with Geographic Information Systems.
American Journal of Public Health
85, 944–948.CrossRefGoogle Scholar
GRAY, J. S., KAHL, O., ROBERTSON, J. N., DANIEL, M., ESTRADA-PEÑA, A., GETTINBY, G., JAENSON, T. G. T., JENSEN, P., JONGEJAN, F., KORENBER, G. E., KURTENBACH, K. &
ZEMAN, P. (
1998).
Lyme borreliosis habitat assessment.
Zentralblatt für Bakteriologie-International Journal of Medical Microbiology, Virology, Parasitology and Infectious Diseases
287, 211–228.CrossRefGoogle Scholar
GREEN, R. M., ROGERS, D. J. &
RANDOLPH, S. E. (
2000).
The use of satellite imagery to predict foci of tick-borne encephalitis.
Proceedings of the 3rd International Conference ‘Ticks and Tick-borne Pathogens: Into the 21st Century’ (
ed. Kazimírová, M., Labuda, M. & Nuttall, P. A.), pp.
209–213.
Institute of Zoology, Slovak Academy of Sciences, Bratislava.
GUERRA, M., WALKER, E., JONES, C., PASKEWICZ, S., CORTINAS, M. R., STANCIL, A., BECK, L., BOBO, M. &
KITRON, U. (
2002).
Predicting the risk of Lyme disease: habitat suitability for Ixodes scapularis in the north central United States.
Emerging Infectious Diseases
8, 289–297.CrossRefGoogle Scholar
HAY, S. I., RANDOLPH, S. E. &
ROGERS, D. J. (ed.) (
2000).
Remote Sensing and Geographical Information Systems in Epidemiology.
Advances in Parasitology
47, 1–357.Google Scholar
HEJNÝ, S. &
ROSICKÝ, B. (
1965).
Beziehungen der Encephalitis zu den natürlichen Pflanzengesellschaften.
Biosoziologie (Herausgebener R. Tuexen), pp.
341–347.
Den Haag, Junk Verlag.
HUGH-JONES, M. (
1989).
Applications of remote sensing to the identification of the habitats of parasites and disease vectors.
Parasitology Today
5, 244–251.CrossRefGoogle Scholar
HUGH-JONES, M. (ed.) (
1991).
Applications of remote sensing to epidemiology and parasitology.
Preventive Veterinary Medicine
11, 155–376.Google Scholar
HUGH-JONES, M., BARRE, N., NELSON, G., WEHNES, K., WARNER, J., GARVIN, J. &
GARRIS, G. (
1992).
Landsat-TM identification of Amblyomma variegatum (Acari: Ixodidae) habitats in Guadeloupe.
Remote Sensing of Environment
40, 43–55.CrossRefGoogle Scholar
HUNGERFORD, L. L. (
1991).
Use of spatial statistics to identify and test significance in geographic disease patterns.
Preventive Veterinary Medicine
11, 237–242.CrossRefGoogle Scholar
IMMUNO, A. G. (
1997).
Tick-borne Encephalitis (TBE) and its Immunoprophylaxis.
Immuno Ag, Vienna.
ISAAKS, E. H. &
SRIVASTAVA, R. M. (
1989).
Applied Geostatistics.
Oxford, Oxford University Press.
JONES, C. G., OSTFELD, R. S., RICHARD, M. P., SCHAUBER, E. M. &
WOLFF, J. O. (
1998).
Chain reactions linking acorns to gypsy moth outbreaks and Lyme disease risk.
Science
279, 1023–1026.CrossRefGoogle Scholar
JONES, L. D., DAVIES, C. R., STEELE, G. M. &
NUTTALL, P. A. (
1987).
A novel mode of arbovirus transmission involving a non-viremic host.
Science
237, 775–777.CrossRefGoogle Scholar
JOURNEL, A. G. &
HUIBREGTS, C. J. (
1978).
Mining Geostatistics.
New York, Academic Press.
KELSALL, J. E. &
DIGGLE, P. J. (
1995).
Non-parametric estimation of spatial variation in relative risk.
Statistics in Medicine
14, 2335–2342.CrossRefGoogle Scholar
KITRON, U., BOUSEMAN, J. K. &
JONES, C. J. (
1991).
Use of the ARC/INFO GIS to study the distribution of Lyme disease ticks in an Illinois county.
Preventive Veterinary Medicine
11, 243–248.CrossRefGoogle Scholar
KITRON, U., JONES, C. J., BOUSEMAN, J. K., NELSON, J. A. &
BAUMGARTNER, D. L. (
1992).
Spatial analysis of the distribution of Ixodes dammini (Acari: Ixodidae) on white-tailed deer in Ogle County, Illinois.
Journal of Medical Entomology
29, 259–266.CrossRefGoogle Scholar
KITRON, U. &
KAZMIERCZAK, J. J. (
1997).
Spatial analysis of the distribution of Lyme disease in Wisconsin.
American Journal of Epidemiology
145, 558–566.CrossRefGoogle Scholar
KITRON, U. &
MANNELLI, A. (
1994).
Modeling the ecological dynamics of tick-borne zoonoses. In
Ecological Dynamics of Tick-borne Zoonoses. (
ed. Sonenshine, D. E. & Mather, T. N.), pp.
198–239.
New York and Oxford, Oxford University Press.
KOLONIN, G. V. (
1978).
World Distribution of Ixodid Ticks (Genus Haemaphysalis).
Moscow, Publishing House Nauka. (In Russian.)
KOLONIN, G. V. (
1981).
World Distribution of Ixodid Ticks (Genus Ixodes).
Moscow, Publishing House Nauka. (In Russian.)
KOLONIN, G. V. (
1983).
World Distribution of Ixodid Ticks (Genera Hyalomma, Aponomma, Amblyomma).
Moscow, Publishing House Nauka. (In Russian.)
KOLONIN, G. V. (
1984).
World Distribution of Ixodid Ticks (Genera Dermacentor, Anocentor, Cosmiomma, Dermacentonomma, Nosomma, Rhipicentor, Rhipicephalus, Boophilus, Margaropus, Anomalohimalaya).
Moscow, Publishing House Nauka. (In Russian.)
KORENBERG, E. I. (
1973).
Methodological principles of mapping the occurrence of Ixodid ticks.
Proceedings of 3rd International Congress of Acarology, Prague (
ed. Daniel, M. & Rosický, B.), pp.
575–577.
Prague, Academia, Publishing House of Czechoslovak Academy of Sciences.CrossRef
KORENBERG, E. I. (
1983).
What is a Natural Focus?
Moscow, Publishing House Znanie. (In Russian.)
KORENBERG, E. I. &
KOVALEVSKY, J. V. (
1981).
Regional classification of the tick-borne encephalitis area of distribution.
Scientific and Technical Results, Series Medical Geography
11, 1–148. (In Russian.)Google Scholar
KREJCIR, P. (
2000).
A maximum likelihood estimator of an inhomogeneous Poisson point process intensity using beta splines.
Kybernetika
36, 455–464.Google Scholar
KUCHERUK, V. V. &
ROSICKÝ, B. (
1984).
Natural focality of infectious diseases – basic terms and its explanation.
Medical Parasitology and Parasitological Diseases
2, 7–16. (In Russian.)Google Scholar
KULLDORFF, M. &
NAGARWALLA, N. (
1995).
Spatial disease clusters: detection and inference.
Statistics in Medicine
14, 799–810.CrossRefGoogle Scholar
KUZIKOV, I. V., KORENBERG, E. I., KOVALEVSKY, J. V. &
RODMAN, L. S. (
1982).
The principles of average scale mapping of distribution of the Ixodid ticks on the basis of aerophoto-materials.
Zoologiocheskii Zhurnal
61, 1802–1814. (In Russian.)Google Scholar
LAM, N. S. (
1983).
Spatial interpolation methods: a review.
The American Geographer
10, 129–149.CrossRefGoogle Scholar
LAWSON, A., BIGGERI, A., BÖHNING, D., LESAFFRE, E., VIEL, J.-F. &
BERTOLLINI, R. (
1999).
Disease Mapping and Risk Assessment for Public Health.
Chichester, John Wiley & Sons Ltd.
LAWSON, A. B. (
2001).
Statistical Methods in Spatial Epidemiology.
Chichester, John Wiley & Sons Ltd.
LAWSON, A. B. &
WILLIAMS, F. L. R. (
1993).
Applications of extraction mapping in environmental epidemiology.
Statistics in Medicine
12, 1249–1258.CrossRefGoogle Scholar
MARTYN, K. P. (
1988).
Provisional Atlas of the Ticks (Ixodoidea) of the British Isles.
Huntingdon, NERC, Institute Terrestrial Ecology.
MEADE, M. S., FLORIN, J. W. &
GESLER, W. M. (
1988).
Medical Geography.
New York, The Guilford Press.
MERLER, S., FURLANELLO, C., CHEMINI, C. &
NICOLINI, G. (
1996).
Classification tree methods for analysis of mesoscale distribution of Ixodes ricinus (Acari: Ixodidae) in Trentino, Italian Alps.
Journal of Medical Entomology
33, 888–893.CrossRefGoogle Scholar
MORAN, P. A. P. (
1950).
Notes on continuous stochastic phenomena.
Biometrica
37, 17–23.CrossRefGoogle Scholar
NICHOLSON, M. C. &
MATHER, T. N. (
1996).
Methods for evaluating Lyme disease risk using geographic information systems and geospatial analysis.
Journal of Medical Entomology
33, 711–720.CrossRefGoogle Scholar
NORVAL, R. A. I., PERRY, B. D., KRUSKA, R. &
KUNDERT, K. (
1991).
The use of climate data interpolation in estimating the distribution of Amblyomma variegatum in Africa.
Preventive Veterinary Medicine
11, 365–366.CrossRefGoogle Scholar
O'CONNELL, S., GRANSTRÖM, M., GRAY, J. S. &
STANEK, G. (
1998).
Epidemiology of European Lyme Borreliosis.
Zentralblatt für Bakteriologie – International Journal of Medical Microbiology, Virology, Parasitology and Infectious Diseases
287, 229–240.CrossRefGoogle Scholar
ODEN, N. (
1995).
Adjusting Moran's I for population density.
Statistics in Medicine
14, 17–26.CrossRefGoogle Scholar
PAVLOVSKY, E. N. (
1939).
Natural focality of infectious diseases.
Vestnik Akademii Nauk SSSR
10, 98–108. (In Russian.)Google Scholar
PAVLOVSKY, E. N. (
1946–1948).
Manual of Human Parasitology, Vol. I–II.
Moscow-Leningrad, Publishing House of the Academy of Sciences USSR. (In Russian.)
PAVLOVSKY, E. N. (
1964).
Natural Nidality of Transmissible Diseases in Relation to Landscape Epidemiology of Zooanthroponoses.
Moscow, Peace Publishers.
PERRY, B. D., KRUSKA, R., LESSARD, R., NORVAL, R. A. I. &
KUNDERT, K. (
1991).
Estimating the distribution and abundance of Rhipicephalus appendiculatus in Africa.
Preventive Veterinary Medicine
11, 261–268.CrossRefGoogle Scholar
PROKHOROV, B. B., BAIBORODIN, V. N., VERSHININA, T. A. &
SOTCHAVY, V. V. (
1974).
Experience in Ixodid Ticks Mapping on the Territory of Asiatic Russia.
Irkutsk, Academy of Sciences of the USSR. (In Russian.)
RADVAN, R., HANZÁK, J., HEJNÝ, S., REHN, F. &
ROSICKÝ, B. (
1960).
Demonstration of elementary foci of tick-borne infections on the basis of microbiological, parasitological and biocenological investigations.
Journal of Hygiene, Epidemiology, Microbiology and Immunology
4, 81–93.Google Scholar
RAND, P. W., LACOMBE, E. H., SMITH, R. P., GENSHEIMER, K. &
DENNIS, D. T. (
1996).
Low seroprevalence of human Lyme disease near a focus of high entomologic risk.
American Journal of Tropical Medicine and Hygiene
55, 160–164.CrossRefGoogle Scholar
RANDOLPH, S. E. (
1993).
Climate, satellite imagery and seasonal abundance of the tick Rhipicephalus appendiculatus in Southern Africa: a new perspective.
Medical and Veterinary Entomology
7, 243–258.CrossRefGoogle Scholar
RANDOLPH, S. E. (
2000).
Ticks and tick-borne diseases systems in space and from space. In
Remote Sensing and Geographical Information Systems in Epidemiology, Advances in Parasitology 47 (
ed. Baker, J. R., Muller, R. & Rollinson, D.), pp.
217–243.
London, Academic Press.CrossRef
RANDOLPH, S. E., MIKLISOVÁ, D., LYSÝ, D., ROGERS, D. J. &
LABUDA, M. (
1999).
Incidence from coincidence: patterns of tick infestations on rodents facilitate transmission of tick-borne encephalitis virus.
Parasitology
118, 177–186.CrossRefGoogle Scholar
RANDOLPH, S. E. &
ROGERS, D. J. (
2000).
Fragile transmission cycles of tick-borne encephalitis virus may be disrupted by predicted climate change.
Proceedings of the Royal Society of London Series B – Biological Sciences
267, 1741–1744.CrossRefGoogle Scholar
ROBINSON, T. P. (
2000).
Spatial statistics and geographical information systems in epidemiology and public health. In
Remote Sensing and Geographical Information Systems in Epidemiology, Advances in Parasitology 47 (
ed. Baker, J. R., Muller, R. & Rollinson, D.), pp.
81–127.
London, Academic Press.CrossRef
ROGERS, A. (
1974).
Statistical Analysis of Spatial Dispersion. The Quadrat Method.
London, Pion.
ROGERS, D. J. (
2000).
Satellites, space, time and the African trypanosomiases. In
Remote Sensing and Geographical Information Systems in Epidemiology, Advances in Parasitology 47 (
ed. Baker, J. R., Muller, R. & Rollinson, D.), pp.
129–171.
London, Academic Press.CrossRef
ROGERS, D. J. &
RANDOLPH, S. E. (
1993).
Distribution of tsetse and ticks in Africa, past, present and future.
Parasitology Today
9, 266–271.CrossRefGoogle Scholar
ROSICKÝ, B. (
1967).
Natural foci of diseases. In
Infectious Diseases – Their Evolution and Eradication (
ed. Cockburn, T. A.), pp.
108–126.
Springfield, Illinois, USA, Charles C. Thomas Publisher.
ROSICKÝ, B. &
DANIEL, M. (
1989).
Medical Entomology and Environment.
Publishing House Academia, Prague. (In Czech.)
SONENSHINE, D. E., PETERS, A. H. &
STOUT, J. I. (
1972).
Rocky Mountain spotted fever in relation to vegetation in the Eastern United States, 1951–1971.
American Journal of Epidemiology
96, 59–69.CrossRefGoogle Scholar
SUTHERST, R. W. (
2001).
The vulnerability of animal and human health to parasites under global change.
International Journal for Parasitology
31, 933–948.CrossRefGoogle Scholar
SUTHERST, R. W. &
MAYWALD, G. F. (
1985).
A computerised system for matching climates in ecology.
Agriculture Ecosystems and Environment
13, 281–299.CrossRefGoogle Scholar
THOMSEN, I. (
1991).
Population data for small area studies. In
Data Requirements and Methods for Analysing Spatial Patterns of Disease in Small Areas, pp.
10–14.
Copenhagen, WHO EUR/ICP/CEH 087/A.
VAN BEURDEN, A. U. C. J. &
HILFERINK, M. T. A. (
1993).
Spatial Analysis with GIS at RIVM. A background overview of spatial analysis within GIS in research for environment and public health. National Institute of Public Health and Environmental Protection, report No 421503002, pp.
1–42, Bilthoven.
VERSHININA, T. A. (
1985).
Mapping of Ixodid Ticks Distribution and Seasonal Activity.
Novosibirsk, Publishing House Nauka. (In Russian.)
WHITTIE, P. S., DRANE, W. &
ALDRICH, T. E. (
1996).
Classification methods for denominators in small areas.
Statistics in Medicine
15, 1921–1926.3.0.CO;2-3>CrossRefGoogle Scholar
ZEMAN, P. (
1997).
Objective assessment of risk maps of tick-borne encephalitis and Lyme borreliosis based on spatial patterns of located cases.
International Journal of Epidemiology
26, 1121–1130.CrossRefGoogle Scholar
ZEMAN, P. (
1998).
Borrelia-infection rates in tick and insect vectors accompanying human risk of acquiring Lyme borreliosis in a highly endemic region in Central Europe.
Folia Parasitologica
45, 319–325.Google Scholar
ZEMAN, P. (
1999).
A spatial analysis of uncertain occurence of Lyme borreliosis.
Zentralblatt für Bakteriologie – International Journal of Medical Microbiology, Virology, Parasitology and Infectious Diseases
289, 717–719.CrossRefGoogle Scholar
ZEMAN, P., VITKOVA, V. &
MARKVART, K. (
1990).
Join occurence of tick-borne encephalitis and Lyme borreliosis in the Central Bohemian region of Czechoslovakia.
Československá Epidemiologie, Mikrobiologie a Imunologie
39, 95–105.Google Scholar
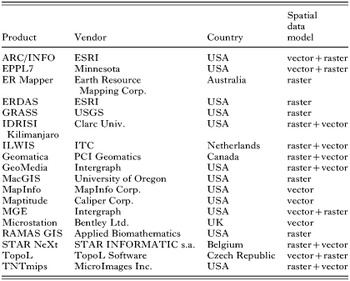
Table 1. Selected software GIS products
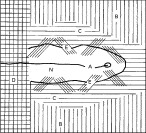
Fig. 1. Outline of the structure of a nucleus in a focus of TBE: A – axis of the nucleus; B – spruce mono-culture (without any tick occurrence); C – coat of the nucleus; D – grain field (without ticks); E – transitional phytocenoses; N – nucleus (reproduced with permission, Rosický & Daniel (1989)).
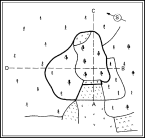
Fig. 2. Example of a nucleus in a natural focus of TBE (delineated by thick line) monitored in north-eastern Bohemia. Length of tract AC – 235 m; tract BD – 289 m; width of the nucleus proper 167 m, length 141 m (according to Radvan et al. (1960) reproduced with permission, Rosický & Daniel (1989)).
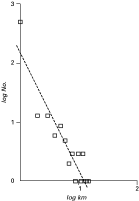
Fig. 3. The frequency distribution of distances between residential addresses and places of infection in a set of patients of Lyme borreliosis fitted with power regression illustrates a peri-residential exposure of the population at risk (reproduced with permission, Zeman (1997)).
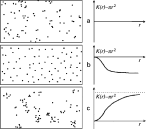
Fig. 4. Principal types of spatial distribution: (a) random, (b) regular, and (c) aggregated, and corresponding shapes of the K(r)−πr2 diagram clearly distinguishing between them (reproduced with permission, Zeman, Vitkova & Markvart (1990)).
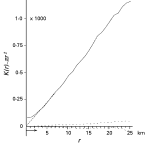
Fig. 5. Plot of K(r)−πr2 statistic versus radius in km for tick-borne encephalitis cases (solid) along with confidence envelopes of a Monte Carlo model of complete spatial randomness (dotted) documents that spatial clustering is well pronounced in this disease (reproduced with permission, Zeman (1997)).
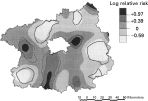
Fig. 6. Log relative risk of acquiring Lyme borreliosis through the ‘tick’ or ‘insect’ bite according to self-reported data in cases from Central Bohemia computed by the Kelsall-Diggle's method; test of non-constant ratio gave p-value of 0·023, and solid and dashed lines indicate where the 95% tolerance limits were surpassed for the ‘insect’ and ‘tick’ reports, respectively (reproduced with permission, Zeman (1997)).
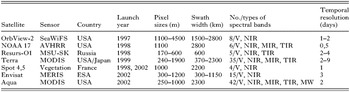
Table 2. Satellites providing remote sensing data of low resolution
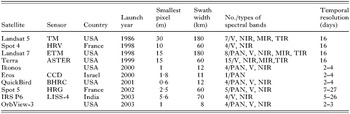
Table 3. Current optical sensor systems for identifying and mapping vegetation in medium and large scales
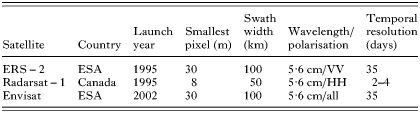
Table 4. Current satellites with synthetic aperture radars
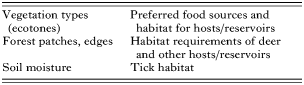
Table 5. Potential links between information obtained from remote sensing and tick-borne disease influencing factors (according to Beck, Lobitz & Wood, 2000)
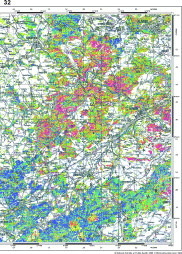
Fig. 7. Predictive map of Ixodes ricinus high-occurrence habitats and TBE risk assessment – TBE natural focus territory in the Berounka river valley, Central Bohemia, Czech Republic. Map in original scale 1[ratio ]200000 prepared for assessment of general epidemiological situation. The colour scale is the same as in Fig. 8 (reproduced with permission, Daniel & Kříž (2002)).
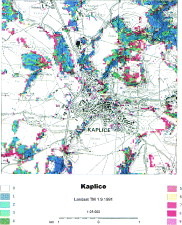
Fig. 8. Predictive map of Ixodes ricinus high-occurrence habitats and TBE risk assessment – a part of TBE natural focus in the surroundings of Kaplice town, southern Bohemia, Czech Republic. Risk habitats are dispersed in small ‘islands’ forming a very typical mosaic pattern of elementary foci. Map in original scale 1[ratio ]25000 prepared for a detailed local orientation and a spatial structural analysis (reproduced with permission, Daniel & Kříž (2002)). The colour scale (valid also for Fig. 7): (1) spruce wood cultures of homogeneous structure – practically without TBE risk; (2) coniferous (mostly spruce) wood cultures with heterogeneous structure – essentially without TBE risk; (3) mixed woods mostly with tall stems and prevailing conifers pose high TBE risk; (4) deciduous shrubs with fine grain size of the stand mosaic – high TBE risk; (5) mixed wood stands mostly young low and dominated by deciduous trees – high TBE risk; (6) young deciduous stands and ecotones with highly heterogeneous structure – peak TBE risk; (7) young deciduous wood stands of homogeneous structure – marked TBE risk; (8) tall deciduous woods of homogeneous structure – marked TBE risk; (9) tall deciduous woods of heterogeneous structure – considerable TBE risk.
 You have
Access
- 18
- Cited by