Introduction
Schizophrenia (SCZ) is a serious mental disorder with a significant economic and societal impact (Charlson et al., Reference Charlson, Ferrari, Santomauro, Diminic, Stockings, Scott and Whiteford2018). High heritability suggests that genetic risk factors play crucial roles in SCZ (Hilker et al., Reference Hilker, Helenius, Fagerlund, Skytthe, Christensen, Werge and Glenthøj2018; Wander, Reference Wander2020). So far, many SCZ GWASs have been reported. For example, the Schizophrenia Working Group of the Psychiatric Genomics Consortium reported 108 independent risk loci based on a multi-stage genome-wide association study (GWAS) in ~150 000 individuals (Schizophrenia Working Group of the Psychiatric Genomics, 2014). More recently, using GWAS, Lam et al. (Reference Lam, Chen, Li, Martin, Bryois, Ma and Brown2019) compiled the largest East Asian genetics cohort and identified 208 significant associations in 176 genetic loci (through combining results of East Asian and European ancestries), suggesting consistency of SCZ risk alleles across ethnicities and cultures (Lam et al., Reference Lam, Chen, Li, Martin, Bryois, Ma and Brown2019). Despite the fact that GWASs have achieved unprecedented success in the past decade, deciphering the genetic underpinnings and pathophysiology of SCZ remains difficult due to the genetic heterogeneity of the disease and the unknown functionality of most GWAS loci (Wainberg & Sinnott-Armstrong, Reference Wainberg and Sinnott-Armstrong2019; Wang et al., Reference Wang, Li, Li, Liu, Yao, Li and Luo2021).
As the majority of SCZ-associated polymorphisms are located in non-coding regions, where they have no direct impact on protein structure or function (Harrison, Reference Harrison2015), it is difficult to translate the risk SNPs into susceptibility genes without additional information. It has been proposed that trait-associated SNPs are more likely to be eQTLs (Nicolae et al., Reference Nicolae, Gamazon, Zhang, Duan, Dolan and Cox2010), suggesting that integration of eQTL data will facilitate to identify risk genes and delineate disease pathophysiology. In the past decade, several analysis approaches have been developed to integrate eQTL and GWAS data, including transcriptome-wide association study (TWAS) (Gusev et al., Reference Gusev, Ko, Shi, Bhatia, Chung, Penninx and Pasaniuc2016), Sherlock (He et al., Reference He, Fuller, Song, Meng, Zhang, Yang and Li2013), SMR (Zhu et al., Reference Zhu, Zhang, Hu, Bakshi, Robinson, Powell and Yang2016) and so on. These integrative approaches use different assumptions and strategies to identify risk genes. For example, TWAS uses prediction models trained on reference eQTL data to assess the association between gene expression and disease risk, whereas Sherlock uses a Bayesian statistical method to infer genes whose expression changes are associated with diseases or complex traits (He et al., Reference He, Fuller, Song, Meng, Zhang, Yang and Li2013). Though several integrative studies have been performed on SCZ, these studies only used single approach or included limited or single eQTL dataset, which might lead to missing of important biological insights. Moreover, as different integrative methods have different assumptions and limitations and, integrating the results of different approaches will help to identify promising candidates. Finally, integrating of additional data will provide important complementary information for characterizing the potential roles of the identified risk genes in SCZ. For example, structural brain abnormalities have been frequently reported in SCZ and Chen et al. (Reference Chen, Ursini, Romer, Knodt, Mezeivtch, Xiao and Weinberger2018) showed that polygenic risk scores generated from the most recent SCZ genome-wide association studies predict mnemonic hippocampal activity. In addition, structural abnormalities of the frontal-limbic circuit have been frequently reported in SCZ (Chen et al., Reference Chen, Ursini, Romer, Knodt, Mezeivtch, Xiao and Weinberger2018; Ferrarelli et al., Reference Ferrarelli, Sarasso, Guller, Riedner, Peterson, Bellesi and Tononi2012; McCutcheon, Abi-Dargham, & Howes, Reference McCutcheon, Abi-Dargham and Howes2019). Integration of brain morphometry data may help to explore the potential role of risk genes in SCZ.
To further identify SCZ risk genes and to explore the potential roles of the identified risk genes in SCZ, we first performed a TWAS (Gusev et al., Reference Gusev, Ko, Shi, Bhatia, Chung, Penninx and Pasaniuc2016) in this work by combining SCZ genome-wide associations (56 418 cases and 78 818 controls) and three large-scale brain eQTL datasets, and we utilized conditional analysis to prioritize the risk gene (or genes at each risk locus) that drives the TWAS signal. We then used an alternative integrative method (Sherlock) to validate the results of TWAS. We also conducted cell-type-specific analysis of TWAS SCZ risk genes and examined its expression levels in the postmodern brains of SCZ patients and controls. Finally, the PRS derived from TWAS genes were used to test the associations between the PRS and brain structures. Our findings not only highlight the power of TWAS in identifying SCZ risk genes, but also providing testable candidates for future functional validation.
Material and methods
Brain expression quantitative trait loci (eQTL) datasets
Our study utilized three independent genome-wide genotyping and polyA + RNA-Seq data sets from the dorsolateral prefrontal cortex (DLPFC) of human brains, including the CommonMind (n = 467) discovery eQTL (Fromer et al., Reference Fromer, Roussos, Sieberts, Johnson, Kavanagh, Perumal and Sklar2016), the GTEx (n = 175) (Aguet et al., Reference Aguet, Brown, Castel, Davis, He and Jo2017) and BrainSeq Phase 2 (n = 397) (Collado-Torres et al., Reference Collado-Torres, Burke, Peterson, Shin, Straub, Rajpurohit and Jaffe2019) validation eQTLs. Detailed information about eQTL data used in our study are provided in the online supplementary methods.
SCZ GWAS data
Genome-wide SNP associations were retrieved from a recent SCZ GWAS (Lam et al., Reference Lam, Chen, Li, Martin, Bryois, Ma and Brown2019). Briefly, Lam et al., conducted the largest SCZ GWAS (56 418 cases and 78 818 controls) and identified 208 significant associations in 176 genetic loci. More details about sample description, genotyping, and statistical analyses could be found in the original publication (Lam et al., Reference Lam, Chen, Li, Martin, Bryois, Ma and Brown2019).
Transcriptome-wide association analysis
On the basis of the underlying assumption that the expression change of a specific gene may contribute to SCZ risk, we used TWAS method developed by Gusev et al. (Reference Gusev, Ko, Shi, Bhatia, Chung, Penninx and Pasaniuc2016) to integrate SNP associations from SCZ GWAS and brain eQTL datasets. We used a strict Bonferroni-corrected p threshold to correct transcriptome-wide significant genes (i.e. TWAS p value = 3.95 × 10⁻⁶ (0.05/12 647)) (total number of genes across panels). Detailed information about TWAS was provided in the online supplementary methods.
Conditional and joint analysis
The joint and conditional tests aim to evaluate the GWAS association signal after removing expression association from TWAS (i.e. to investigate if the GWAS signals are still significant after removing the expression association from TWAS) (Gusev et al., Reference Gusev, Ko, Shi, Bhatia, Chung, Penninx and Pasaniuc2016). Detailed information about conditional and joint analysis was provided in the online supplementary methods.
Sherlock integrative analysis
We also used independent integrative analysis approach (Sherlock) developed by He et al. (Reference He, Fuller, Song, Meng, Zhang, Yang and Li2013) to verify SCZ risk genes identified by TWAS. Brain eQTL data (Aguet et al., Reference Aguet, Brown, Castel, Davis, He and Jo2017) and GWAS signals (Lam et al., Reference Lam, Chen, Li, Martin, Bryois, Ma and Brown2019) were used for Sherlock analysis. Details about the Sherlock analyses can be found in the original paper (He et al., Reference He, Fuller, Song, Meng, Zhang, Yang and Li2013) and are provided in the online supplementary methods.
Spatio-temporal and tissue-type-specific expression pattern analysis of TWS SCZ genes
To explore the spatio-temporal expression pattern of the TWS genes in human brain, we downloaded expression data (based on RNA-seq) from the Allen Institute for Brain Science (http://www.brainspan.org/) (Kang et al., Reference Kang, Kawasawa, Cheng, Zhu, Xu, Li and Sedmak2011). The gene-expression level was measured by RPKM (read per kilobase per million mapped reads) and two gene sets implicated by TWAS were used in this study. Background genes were extracted from a previous study (Zhang et al., Reference Zhang, Nogales-Cadenas, Lin, Zhang, Cai, Vijg and Zhang2016). To explore the expression pattern of TWS genes in human tissues, we investigated their expression level in diverse human tissues using the Genotype-Tissue Expression (GTEx) project (http://gtexportal.org/) (Aguet et al., Reference Aguet, Brown, Castel, Davis, He and Jo2017), which includes expression data in 54 human tissues. Detailed information about the GTEx (e.g. sample source or size, gene-expression normalization) can be found in original publication (Aguet et al., Reference Aguet, Brown, Castel, Davis, He and Jo2017) and the GTEx website.
Differential expression analysis of TWS genes in brains of SCZ cases and controls
To further explore if the genes identified by integrative analysis were dysregulated in patients with SCZ, we compared the brain expression level of the genes identified in cases with SCZ and controls using the expression data. We examined the expression of eight TWS genes in SCZ cases and controls using expression data from the LIBD (Jaffe et al., Reference Jaffe, Straub, Shin, Tao, Gao, Collado-Torres and Weinberger2018). Briefly, DLPFC tissues from 155 SCZ cases and 196 controls were used for gene expression. Gene expression was quantified with RNA sequencing (HiSeq 2000). Differential expression analysis was conducted on 196 controls and 155 cases, adjusting for RNA quality and other covariates (including age, sex, RNA quality). The significance threshold (p value) was set at 0.05.
Cell-type-specific analysis of TWS SCZ genes
Using human brain single-cell RNA sequencing (RNA-seq) data profiled from the Cell Types database (https://portal.brain-map.org/atlases-and-data/rnaseq), we investigated the cell type-specific expression of the eight TWS genes. Briefly, cortical tissues covering the middle temporal gyrus (MTG), anterior cingulate gyrus, primary visual cortex, primary motor cortex, primary somatosensory cortex, and primary auditory cortex, were dissociated and sorted using the neuronal marker NeuN to obtain single cell. Nuclei were sampled from postmortem and neurosurgical (MTG only) donor's brains, and expression was profiled with SMART-Seq v4 or 10 × Genomics Chromium Single Cell 3′ v3 RNA-seq. CELLEX (CELL-type EXpression-specificity), a method for generating cell-type Expression Specificity (ES) profiles, was used to obtain gene ES values (Timshel, Thompson, & Pers, Reference Timshel, Thompson and Pers2020).
Association of TWS genes with cognitive function
Previous studies have shown that SCZ risk variants are associated with cognitive function in either SCZ patients or healthy controls (Cosgrove et al., Reference Cosgrove, Mothersill, Kendall, Konte, Harold and Giegling2017). We thus investigated the associations between eSNPs of eight TWS genes and cognitive function. We focused on verbal-numerical reasoning scores (VNR), a well-characterized cognitive function that has been frequently reported to be impaired in SCZ (Hagenaars et al., Reference Hagenaars, Harris, Davies, Hill, Liewald, Ritchie and Longevity2016; Smeland et al., Reference Smeland, Frei, Kauppi, Hill, Li, Wang and Neuro2017). We combined VNR and genetic data from the CHARGE and COGENT consortia, and UK Biobank (total N = 300 486; age 16–102) and find if eSNPs of eight TWS genes are associated with VNR. Details of the VNR phenotype for all cohorts, quality control, and statistical analyses can be found in the original paper (Davies et al., Reference Davies, Lam, Harris, Trampush, Luciano, Hill and Deary2018).
Association of the TWS SCZ genes with striatal volume
Previous studies have shown that genetic risk variants in SCZ risk genes (e.g. ERBB4 and NRG1) were associated with striatal structure in SCZ (Zhang et al., Reference Zhang, Ni, Liu, Tian, Wei, Xiang and Li2020). We explored the associations between eSNPs identified by TWS and striatal structure in a total of 13 717 healthy subjects from ENIGMA (Hibar et al., Reference Hibar, Stein, Renteria, Arias-Vasquez, Desrivières, Jahanshad and Medland2015). More detailed information about the ENIGMA (including sample description, MRI collection, genotyping, quality control, and statistical analyses) can be found in the original paper (Hibar et al., Reference Hibar, Stein, Renteria, Arias-Vasquez, Desrivières, Jahanshad and Medland2015).
Association of polygenic risk of TWS genes with the white matter integrity of cingulum hippocampus
Subjects
We enrolled 105 first-episode, drug-naive SCZ patients and 140 healthy controls from the West China Hospital of Sichuan University to investigate the associations between the polygenic risk scoring (PRS) burden of TWS genes and white matter tract abnormalities. We interviewed all participants using the Structured Clinical Interview for Diagnostic and the Statistical Manual of Mental Disorders, Fourth Edition, Text Revision (DSM-IV-TR) Axis I Disorders (SCID, patient edition and non-patient edition). The inclusion and exclusion criteria are: (1) Aged between 16 and 50; (2) Han Chinese; (3) Right-handed; (4) Experience the first episode of psychosis at the time of recruitment; (5) Fulfill the diagnosis criteria of SCZ in the Diagnostic and Statistical Manual of Mental Disorders (DSM-IV); (6) I.Q. ⩾ 70 according to Wechsler IQ Test; (7) The current episode cannot be accounted for by any specific life events. All procedures involving human subjects/patients were approved by the Institutional Review Board of West China Hospital of Sichuan University.
Genotyping
Whole-genome genotyping was performed using Infinium Global Screening Array-24 v1.0 BeadChip. Detailed information about the quality control of genomic data are provided in online supplementary methods.
Computation of gene-set PRS
For gene-set PRS, the summary file using East Asian SCZ (Lam et al., Reference Lam, Chen, Li, Martin, Bryois, Ma and Brown2019) was trimmed to contain only SNPs that were located within genes detailed in the TWS gene list using Plink1.07 (Purcell et al., Reference Purcell, Neale, Todd-Brown, Thomas, Ferreira, Bender and Sham2007). Then, gene-set based PRS for SCZ was created using the ‘score’ utility in PGRSice-2 (Watanabe, Taskesen, Van Bochoven, & Posthuma, Reference Watanabe, Taskesen, Van Bochoven and Posthuma2017). The default values for LD clumping were used (window size = 250 kb, R 2 > 0.1). To explore the optimal PRS p-threshold to inform future research and to examine the stability of results as an index of validity, we expanded our analyses to PRS calculated under a wider range of p-thresholds (i.e. 0.5, 0.1, 0.01, 0.001, 0.0001). For subsequent analysis, the GWAS-derived p value threshold with the greatest R 2 pseudo was chosen. Age, sex and three components from the population PCA were used as covariates.
Magnetic resonance images (MRI) scanning
All diffusion tensor imaging (DTI) and T1-weighted data were acquired using a Philips 3T (Achieva TX, Best, the Netherlands) MRI scanner. Detailed information about parameters of the MRI scanning are provided in online supplementary methods.
DTI processing and automatic tract identification
Whole-data processing steps have been outlined elsewhere (Yeatman, Richie-Halford, Smith, Keshavan, & Rokem, Reference Yeatman, Richie-Halford, Smith, Keshavan and Rokem2018). For automated fiber quantification, we used MATLAB-based open source software Automatic Fiber Quantification (AFQ), which implemented both the fiber tract identification algorithms proposed by Hua et al. (Reference Hua, Zhang, Wakana, Jiang, Li, Reich and Mori2008) and Zhang, Olivi, Hertig, van Zijl, and Mori (Reference Zhang, Olivi, Hertig, van Zijl and Mori2008). Prior studies have demonstrated that the cingulum's poor microstructural integrity might act as an early warning sign of the SCZ risk that endures throughout the disease's various phases (Karlsgodt, Jacobson, Seal, & Fusar-Poli, Reference Karlsgodt, Jacobson, Seal and Fusar-Poli2012). With the loss of white matter in the cingulate hippocampus, the frontal limbic structural network of the brain starts to degrade, affecting memory and cognitive function and exacerbating SCZ symptoms (Fornito, Yücel, Dean, Wood, & Pantelis, Reference Fornito, Yücel, Dean, Wood and Pantelis2009; Karlsgodt et al., Reference Karlsgodt, Jacobson, Seal and Fusar-Poli2012; Wu et al., Reference Wu, Wang, Wang, Long, Zhao and Wu2021; Xiao et al., Reference Xiao, Sun, Shi, Jiang, Tao, Zhao and Lui2018). We thus question if the TWAS polygenic risk affects the cingulate and hippocampus's white matter integrity. Following tract identification, the bilateral cingulum hippocampal tract's mean diffusional fractional anisotropy (FA) along the tract core was retrieved. Detailed information about procedures of AFQ are provided in online supplementary methods.
Statistical analysis
The differences in demographic variables between the SCZ group and the healthy control group were tested using Student's t tests and χ2 tests. A linear regression model was used to compare the PRS of TWS genes and FA of the cingulum hippocampus between the SCZ group and the healthy control group, after adjusting for age and sex. The effect of FA of white matter tracts on the relationship between the PRS of TWS genes and SCZ was investigated using mediation analysis. The following interactions were tested in the model: the predictor (i.e. PRS of TWS genes), the potential mediator (i.e. FA) and the dependent variable (i.e. SCZ outcomes). The number selection was set to 5000 according to the bootstrapping method. The effect of the mediation was considered to be significant when the 95% CI did not include zero and the p value was smaller than 0.05. Mediation analysis was carried out using PROCESS 3.2 (Hayes & Preacher, Reference Hayes and Preacher2014).
Results
TWAS prioritizes 8 susceptibility genes for SCZ
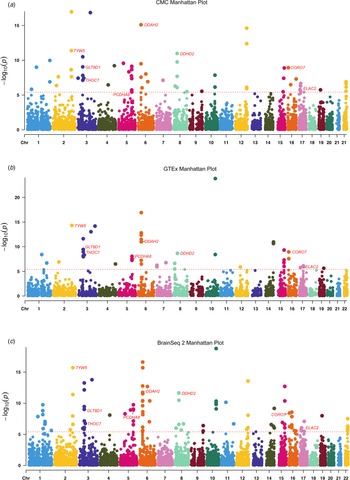
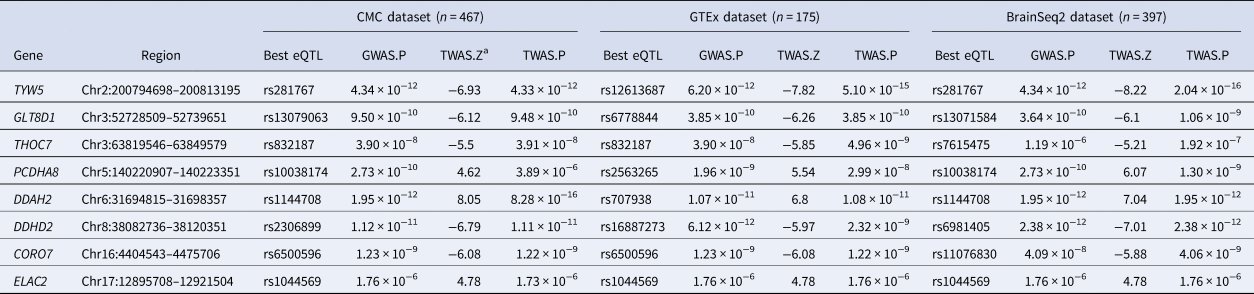
To identify genes associated with SCZ, we firstly performed a TWAS by integrating three gene-expression reference panels (i.e. CMC, GTEx and BrainSeq2) and SCZ GWAS from Lam et al. (Reference Lam, Chen, Li, Martin, Bryois, Ma and Brown2019) After Bonferroni correction, we identified 64 significant genes in the CMC dataset (Fig. 1a and online Supplementary Table S1), 42 genes in the GTEx dataset (Fig. 1b and online Supplementary Table S2), and 97 genes in the BrainSeq2 dataset (Fig. 1c and online Supplementary Table S3). Notably, we found that eight genes achieved transcriptome-wide significance (TWS) level in all three expression reference panels (CMC, GTEx, and BrainSeq2). These eight genes include CORO7, DDAH2, DDHD2, ELAC2, GLT8D1, PCDHA8, THOC7 and TYW5 (Table 1 and Fig. 1). These results strongly suggest that eight genes are SCZ risk genes whose expression change may have a role in SCZ.
Manhattan plot of the TWAS results for schizophrenia (56 418 and 78 818 controls). (a) Manhattan plot of TWAS results in CMC dataset (8 out of 64 significant genes detected). (b) Manhattan plot of TWAS results in GTEx dataset (8 out of 42 significant genes detected). (c) Manhattan plot of TWAS results in BrainSeq2 dataset (8 out of f 97 significant genes detected). Each point represents a gene, with physical genomic position (chromosome, basepair) plotted on the circle-axis and association p value (the −log10 (FUSION p value)) between gene expression in the DLPFC and SCZ plotted on the vertical line. Bonferroni-corrected significant genes are labeled and the significance threshold of p = 3.95 × 10⁻⁶ was used. Eight genes that reached transcriptome-wide significance in all three expression panels (including CORO7, DDAH2, DDHD2, ELAC2, GLT8D1, PCDHA8, THOC7, and TYW5) are highlighted in red color.

Significant TWAS genes among in CMC, GTEx and Brain Seq2 datasets for schizophrenia

a The Z statistic reflects the association strength between this gene and schizophrenia. Z < 0 suggests that this gene was predicted to be down-regulated in schizophrenia cases compared with controls, and vice versa. Transcriptome-wide significance were Bonferroni corrected p < 0.05.
Expression signals driven the SCZ TWAS hits
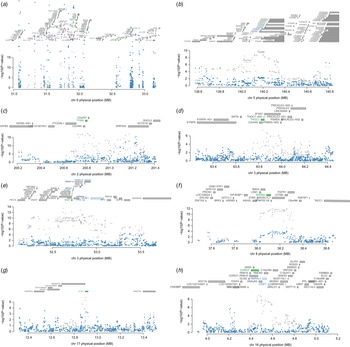
We used conditional and joint analyses to assess if the discovered TWAS signals were conditionally independent and to explore if the GWAS signals were significant after eliminating the expression weights from TWAS. Several conditional independent TWS genes were identified (Fig. 2). For example, we found that DDAH2 (rs3130484 lead SNP P GWAS = 1.08 × 10⁻¹¹, conditioned on DDAH2 lead SNP P GWAS = 2.8 × 10⁻⁴) explains most of the signal at its locus in GTEx dataset (Fig. 2a). Conditional studies also revealed that PCDHA8 accounted for the majority of the signal at its locus in GTEx dataset (Fig. 2b). In addition, the TWS gene TYW5 explained the most of the variance in this loci (rs281771 lead SNP P GWAS = 4.0 × 10⁻¹⁸, conditioned on TYW5 lead SNP P GWAS = 7.8 × 10⁻⁵) in GTEx dateset (Fig. 2c). The TWS gene THOC7 explained the most of the variance in this loci (rs832187 lead SNP P GWAS = 3.9 × 10⁻⁸, conditioned on THOC7 lead SNP P GWAS = 0.02) in GTEx dateset (Fig. 2d). Furthermore, we discovered that the genes GLT8D1 (Fig. 2e), DDHD2 (Fig. 2f), ELAC2 (Fig. 2g), and CORO7 (Fig. 2h) accounted for the majority of the variance in GTEx eQTL datasets. Our conditional analysis identified independent genes that drove the transcriptome-wide association signals.
Regional association of TWS genes. (a) Chr 6 regional association plot. Of note, DDAH2 driven the association signal. (b) Chr 5 regional association plot. (c) Chr 2 regional association plot. Notably, TYW5 explained most of the association signal. (d) Chr 3 regional association plot. Notably, THOC7 driven the association signal. (e) Chr 3 regional association plot. (f) Chr 8 regional association plot. Notably, DDHD2 driven the association signal. (g) Chr 17 regional association plot. Notably, ELAC2 driven the association signal. (h) Chr 16 regional association plot. Notably, CORO7 driven the association signal. The top panel in each plot shows all of the genes in the locus. The marginally TWS associated genes are highlighted in blue, and those that are jointly significant highlighted in green. The bottom panel shows a Manhattan plot of the GWAS data before (grey) and after (blue) conditioning on the predicted expression of the green genes. The x-axis denotes genome coordinates and the y-axis denotes association p values in GWAS.

Sherlock integrative analyses support the TWS genes as SCZ risk genes
In addition to TWAS, we used Sherlock to validate if the SCZ risk genes identified by TWS could be validated. We utilized Sherlock to integrating brain eQTL data (Aguet et al., Reference Aguet, Brown, Castel, Davis, He and Jo2017) and SCZ GWAS data from Lam et al. (Reference Lam, Chen, Li, Martin, Bryois, Ma and Brown2019). Sherlock integrative analysis revealed that the TWS genes (CORO7, DDAH2, DDHD2, ELAC2, GLT8D1, PCDHA8 and TYW5) were also showed significant associations with SCZ, providing further support for the potential roles of these genes in SCZ (online Supplementary Table S4).
TWS genes showed higher expression level than background genes in the human brain
Spatio-temporal gene-expression profiling is an essential method for determining the biological function of a gene set. Therefore, we performed spatio-temporal expression pattern analysis for two TWAS gene sets (gene set 1: TWS genes, N = 8; gene set 2: all TWAS SCZ genes across CMC and BrainSeq2 expression panels, N = 160) using data from BrainSpan (http://www.brainspan.org/). Across all developmental stages, the average expression level of TWAS in gene set 1 (Table 1) was substantially higher than the background genes (Wil-coxon rank-sum test, p < 0.005) (online Supplementary Fig. 1). These findings imply that the discovered TWS SCZ genes may play an important role in brain development and function.
Spatio-temporal expression pattern of TWS genes
Using GTEx expression data, we performed tissue-type-specific expression analysis to investigate the expression pattern of the eight TWS genes in various human tissues. Our findings showed that DDHD2 and PCDHA8 are abundantly expressed in human brains (online Supplementary Figs. 2–9). Using the BrainSpan expression data, we further investigated the expression pattern of TWS genes in the developing and adult human brain. Expression level of 7 genes (except for DDHD2 are higher in early developmental stages (i.e. embryonic and fetal phases) than in childhood and maturity, according to our findings (online Supplementary Fig. 10).
Cell-type specificity analysis in the brain
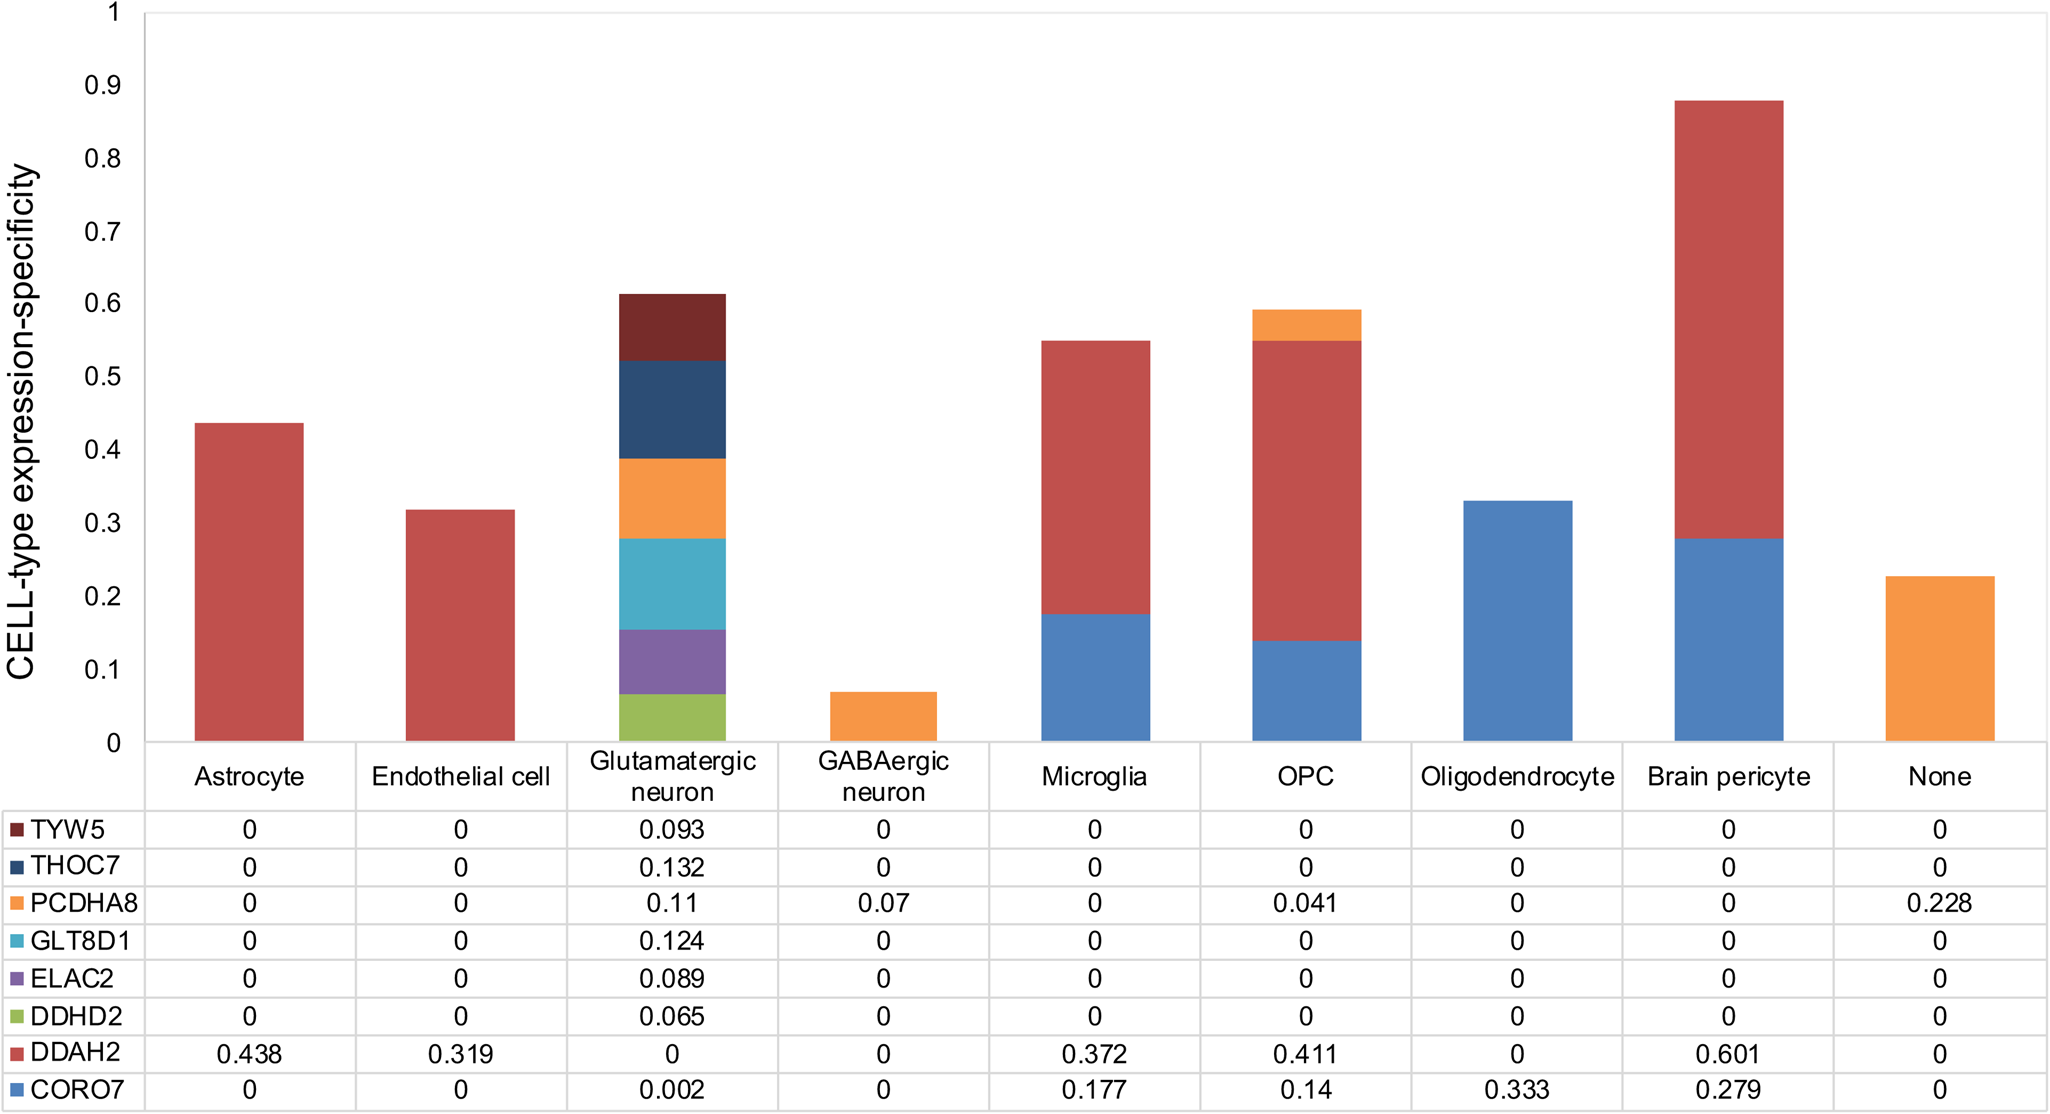
We next asked whether the TWS risk genes were enriched in a particular brain cell type. Using human single-cell RNA-seq data from the Cell Types database (https://portal.brain-map.org/atlases-and-data/rnaseq), we found cell type-specific enrichment for expression of the eight risk genes (Fig. 3). CORO7 and DDAH2 were found to be more abundant in microglia, whereas THOC7 and TYW5 were only found in glutamatergic neurons. GABAergic neurons have higher levels of PCDHA8.
Single-cell-type expression of the potentially TWS genes. Bar graph of single-cell-type enrichment for risk genes in schizophrenia from the TWS genes. The graph depicts CELL-type EXpression-specificity (y axis) for each gene (x axis), with evidence of substantial enrichment within a specific brain cell type (histgram of bar). The ‘wisdom of the crowd’ technique was used to assess enrichment based on gene expression in one cell type against all other cell types. OPC, oligodendrocyte precursor cell. None: Cell types that cannot be classified.

Dysregulation of TWS genes in SCZ
TWAS infers SCZ-associated genes based on the assumption that the candidate genes' expression levels are changed in patients compared with controls. As a result, if the TWS identified genes are true risk genes, their expression in SCZ should be dysregulated. We therefore explored the expression of the identified TWS genes in DLPFC in SCZ patients and healthy controls. CORO7, DDHD2, and GLT8D1 were down-regulated in the DLPFC of SCZ patients (p = 0.0003, 0.03, and 0.005, respectively) (online Supplementary Table S5). However, expression of DDAH2, ELAC2, THOC7, and TYW5 were elevated in the prefrontal cortex of SCZ patients compared to controls (p = 0.03, 0.008, 0.003, and 0.004, respectively) in the DLPFC (online Supplementary Table S5). These results further support the potential role of these genes in SCZ.
TWS genes are associated with cognitive function and striatal structure
We investigated the associations between eSNPs in TWS genes and VNR and stratum structure in healthy people. SCZ-associated eSNPs of the DDAH2 gene (rs1144708, rs707938), GLT8D1 gene (rs13079063, rs6778844), PCDHA8 gene (rs10038174, rs2563265), THOC7 gene (rs7615475), and TYW5 gene (rs281767, rs12613687) were showed to be significantly associated with VNR (online Supplementary Table S6). We also discovered that putamen volume is related with SCZ-associated eSNPs of DDHD2 (i.e. rs2306899, rs16887273, and rs6981405) (p = 0.003, 0.007, and 0.002, respectively) (online Supplementary Table S7). Furthermore, caudate volume (p = 0.006, 0.007, and 0.017, respectively) and pallidum volume (p = 0.005, 0.001, and 0.0006, respectively, online Supplementary Table S7) are related with the three eSNPs of DDHD2.
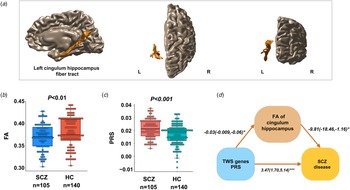
Mediation effect of PRS of TWS genes and FA on cingulum-hippocampus
We recruited 140 healthy controls (57 males, mean age 23.74 ± 3.93) and 105 untreated SCZ patients (52 males, mean age 22.62 ± 6.56). There were no significant differences in age, sex between the two groups (online Supplementary Table S8). We found reduced FA of the left cingulum-hippocampus (t = −2.9, p = 0.004) in SCZ patients compared to healthy controls (Fig. 4a, b), but no decreased FA of the right cingulum-hippocampus (t = −0.97, p = 0.33). Age of onset, PANSS score, and FA of the right cingulum-hippocampus are not significantly correlated. The gene-set based PRSs calculated with a 0.0123 p threshold revealed the greatest difference between SCZ and controls (highest R 2 = 3.2%, p < 0.001, Fig. 4c and online Supplementary Fig. 11). The effect of PRS of TWS genes on SCZ was shown to be mediated in part by FA of the left cingulum-hippocampus (accounting for 8.4% of the effects). The indirect effect coefficient was significant, with bootstrap confidence intervals derived from 5000 samples, logistic regression coefficients = 0.313, s.e. = 0.189, 95% CI 0.02–0.73, supporting the hypothesis that the relationship between polygenic risk of TWS genes and SCZ disease is mediated by FA of the left cingulum hippocampus (Fig. 4d).
Association of polygenic risk of TWS genes with the white matter integrity of cingulum hippocampus. (a) The white matter tract of the left cingulum hippocampus in brain. (b) Reduced FA of the left cingulum-hippocampus in patients with SCZ compared to healthy controls. (c) The PWS based PRSs is higher in SCZ compared to controls. (d) The effect of PRS of TWS genes on SCZ was shown to be mediated in part by FA of the left cingulum-hippocampus. The indirect effect coefficient was significant, with bootstrap confidence intervals derived from 5000 samples, logistic regression coefficients = 0.313, s.e. = 0.189, 95% CI 0.02–0.73. FA, fractional anisotropy; L, left; R, right.

Discussion
We explored TWS genes for SCZ using three independent expression quantitative traits datasets from the DLPFC (i.e. CMC, GTEx and Brain-Seq2). We identified eight genes (including CORO7, DDAH2, DDHD2, ELAC2, GLT8D1, PCDHA8, THOC7 and TYW5) whose genetically-regulated expression are associated with SCZ in all three eQTL datasets, strongly suggesting that these eight TWS genes are true risk genes for SCZ. In addition, expressions of seven TWS genes were dysregulated in brains (DLPFC) of SCZ cases compared with controls. TWS genes were mainly expressed on the surface of glutamatergic neurons, GABAergic neurons, and microglia. Of note, we found that eSNPs of TWS genes were associated with striatal anatomy and VNR. Finally, the PRS derived from TWS genes and MRI data suggested a mediation effect of TWS gene's PRS on cingulum-hippocampus FA. The findings of our integrative analysis provide convergent evidence that TWS genes may have a role in frontal-limbic dysfunctions in SCZ.
Several of the eight overlapping TWS genes have a role in neurodevelopment. For example, Yang et al., found that GLT8D1 knockdown promotes the proliferation and inhibits the differentiation abilities of neural stem cells, and alters morphology and synaptic transmission of neurons (Yang et al., Reference Yang, Li, Wu, Shen, Zeng, Xiong and Luo2018). PCDHA8, a member of the protocadherin family of genes, was reported to be involved in the creation and maintenance of neural connections in the brain (Korologou-Linden, Leyden, Relton, Richmond, & Richardson, Reference Korologou-Linden, Leyden, Relton, Richmond and Richardson2021; Wu & Maniatis, Reference Wu and Maniatis1999). The TREX complex, which has been linked to neurodevelopmental abnormalities and human illness, contains the component THOC7 (Heath, Viphakone, & Wilson, Reference Heath, Viphakone and Wilson2016). Other notable molecular roles for the 8 risk genes in SCZ include DNA stability, RNA transportation, mitochondria and apoptosis. THOC7 maintains the stability of repetitive DNA in human (Katahira, Senokuchi, & Hieda, Reference Katahira, Senokuchi and Hieda2020). TYW5 is an essential tRNA hydroxylase (Kato et al., Reference Kato, Araiso, Noma, Nagao, Suzuki, Ishitani and Nureki2011; Ramos & Fu, Reference Ramos and Fu2019), and previous studies have found that tRNA alteration defects are linked to many neurodevelopmental disorders (Goes et al., Reference Goes, McGrath, Avramopoulos, Wolyniec, Pirooznia, Ruczinski and Pulver2015; Ikeda et al., Reference Ikeda, Takahashi, Kamatani, Momozawa, Saito, Kondo and Iwata2019; Ochoa et al., Reference Ochoa, Hercules, Carmona, Suveges, Gonzalez-Uriarte, Malangone and McDonagh2021; Pardiñas et al., Reference Pardiñas, Holmans, Pocklington, Escott-Price, Ripke, Carrera and Walters2018; Periyasamy et al., Reference Periyasamy, John, Padmavati, Rajendren, Thirunavukkarasu, Gratten and Mowry2019). Studies indicate that ELAC2 functions involved in human mitochondria (Brzezniak, Bijata, Szczesny, & Stepien, Reference Brzezniak, Bijata, Szczesny and Stepien2011). Loss of DDHD2, whose mutation causes promotes reactive oxygen species generation and (Maruyama et al., Reference Maruyama, Baba, Maemoto, Hara-Miyauchi, Hasegawa-Ogawa, Okano and Tani2018). In addition, activation of the Hippo pathway requires CORO7, and dysregulation of the Hippo pathway leads to abnormal cell growth and apoptosis (Park et al., Reference Park, Jun, Choi, Yoon, Kim, Jang and Chung2021). Taken together, these 8 genes are involved in a number of molecular pathways that are implicated in SCZ and, in particular, emphasize the role of the neurodevelopment in SCZ. Our differential expression analysis also showed that three (CORO7, DDHD2, and GLT8D1) of the eight overlapping TWS genes were down-regulated, and four genes (CORO7, DDHD2, and GLT8D1) were up-regulated in SCZ compared with controls, further supporting the potential role of these genes in SCZ (Jaffe et al., Reference Jaffe, Straub, Shin, Tao, Gao, Collado-Torres and Weinberger2018). In addition, THOC7 and TYW5 were only found in glutamate neurons, and GABAergic neurons had higher levels of DDHD2, ELAC2 and GLT8D1, which is helpful for us to explore the future targeted treatment of excitatory inhibitory imbalance in SCZ.
Because it is linked to higher cognitive processes like attention, memory, and reasoning, the prefrontal cortex is considered a vital component of the brain that differentiates humans (Collado-Torres et al., Reference Collado-Torres, Burke, Peterson, Shin, Straub, Rajpurohit and Jaffe2019; Sigmundsson et al., Reference Sigmundsson, Suckling, Maier, Williams, Bullmore, Greenwood and Toone2001). The involvement of genetic factors in prefrontal dysfunctions in the development of SCZ is extensively acknowledged (Crossley et al., Reference Crossley, Mechelli, Scott, Carletti, Fox, McGuire and Bullmore2014). The recent SCZ GWAS supports this view as genes involved in frontal eQTL and differential gene expression have been repeatedly emphasized (Dong et al., Reference Dong, Ma, Zhou, Shi, Ye, Yang and Zhou2020; Fromer et al., Reference Fromer, Roussos, Sieberts, Johnson, Kavanagh, Perumal and Sklar2016). Prior research on SCZ risk genes utilizing integration analysis somewhat corroborated our findings, but mostly lacked mechanism explanatory data (Chen et al., Reference Chen, Ursini, Romer, Knodt, Mezeivtch, Xiao and Weinberger2018). According to our findings, the expression-related SNPs of DDAH2, GLT8D1, PCDHA8, THOC7, and TYW5 in the frontal lobe are associated to verbal number reasoning. From the perspective of neurodevelopmental function, TWS genes may change the development and function of the prefrontal cortex, which is implicated in the disordered cognitive process of SCZ (Raju et al., Reference Raju, Shukla, Jacob, Bharath, Kumar, Varambally and Rao2021; Ripke et al., Reference Ripke, O'Dushlaine, Chambert, Moran, Kähler, Akterin and Fromer2013; Rodriguez-López, Arrojo, Paz, Páramo, & Costas, Reference Rodriguez-López, Arrojo, Paz, Páramo and Costas2020).
The prefrontal cortex also interacts with SCZ subcortical regions like the limbic system, which is involved in the hippocampus and striatum (Fettes, Schulze, & Downar, Reference Fettes, Schulze and Downar2017; Kalin, Reference Kalin2019). SCZ-related genes are abundantly expressed in the brain, particularly in the striatum's spinous neurons and the hippocampus' pyramidal neurons (Savage et al., Reference Savage, Jansen, Stringer, Watanabe, Bryois, de Leeuw and Posthuma2018). In our research we found that SCZ-associated eSNPs of DDHD2, one of the TWS genes, were linked to putamen, caudate, and pallidum volume. In earlier research, it was also discovered that DDHD2−/− mice exhibit defects in movement and cognitive function (Inloes et al., Reference Inloes, Hsu, Dix, Viader, Masuda, Takei and Cravatt2014). These findings show that DDHD2 may be a key limbic brain gene and that disruption of the pathway has a significant impact on both movement and cognitive function. SCZ's psychopathology and cognitive deficits have been connected to limbic circuitry alterations, notably white matter disruptions of the limbic system's important pathways, including the cingulum. According to Dugré and colleagues, SCZ is linked to abnormal limbic system control in response to non-threatening stimuli, which may be important for the development of delusions (Kalin, Reference Kalin2019). In first-episode untreated SCZ patients, we discovered that FA of the left cingulum hippocampus mediates the connection between polygenic risk of TWS genes and SCZ diagnosis. TWS genes appear to have a substantial role in frontal-limbic dysfunctions in SCZ, according to the findings. Although the specific role of TWS genes in this brain function is unknown, further functional investigations are needed to learn whether and how TWS genes alter brain circuits and behavior in SCZ.
The limitations of the study should be considered when interpreting our findings. First, TWAS generally only considers the cis genetic component of expression on traits, thus variations that influence SCZ but are unrelated to cis expression would be missed. Second, the number of identified TWS genes is constrained by the quantity of reference persons with expression and bonferroni correction on TWAS data. Further effort is required to expand the sample size and improve the quality of expression data for future TWAS research. Finally, despite our study revealed that TWS genes may have a role in neurodevelopment, currently we still do not know the exact role of TWS genes in brain development and SCZ. Further in vivo functional studies are needed to demonstrate how TWS genes confer risk of SCZ.
There are several advantages of our research. First, we used three independent brain eQTL datasets for TWAS, thus the findings observed in discovery dataset can be verified in replication datasets. In addition, we also used an independent integrative analysis to corroborate our findings. Finally, we investigated the genetic implications of eight TWS genes on the aberrant frontal limbic circuit using MRI in first-episode SCZ. In summary, the TWS genes discovered in our study will be critical for understanding the etiology of SCZ, prioritizing potential therapy targets, and showing the viability and importance of resource integration and sharing in this big data era of biomedical research.
Supplementary material
The supplementary material for this article can be found at https://doi.org/10.1017/S0033291723000417.
Data
All data relevant to the study are included in the article or uploaded as online supplementary information. The data generated in this study will be available from the corresponding author on reasonable request.
Acknowledgements
The authors would like to thank all their coworkers at West China Hospital, the State Key Laboratory of Biotherapy in West China Hospital, Suzhou Psychiatry Hospital, and the Affiliated Mental Health Centre & Hangzhou Seventh People's Hospital for their contributions to this research study.
Author contributions
T. L. and C. C. Z. concepted and designed research; C. C. Z., X. J. L., X. J. L. and W. D. analyzed and interpreted data; and C. C. Z. and L. S. Z. drafted the article; X. J. L., T. L., Q. W., W. J. G., X. D. D. revised the article; all the authors approved the final version to be published.
Financial support
This work was partly funded by National Nature Science Foundation of China Key Project (81630030; 81920108018); National Nature Science Foundation of China Project (82001413); Project for Hangzhou Medical Disciplines of Excellence & Key Project for Hangzhou Medical Disciplines; Introduction Project of Suzhou Clinical Expert Team (SZYJTD201715); Key R & D projects of Science and Technology Department of Sichuan Province (2021YFS0248); China Postdoctoral Science Foundation (2020M673247); Postdoctoral Foundation of West China Hospital (2020HXBH163); 1.3.5 Project for disciplines of excellence, West China Hospital of Sichuan University (ZY2016103, ZY2016203 and ZYGD20004).
Competing interests
The authors declare no conflict of interests.
Ethical standards and consent to participate
The study was approved by the Ethics Committee of West China Hospital, Sichuan University, and complied with the principles of the Declaration of Helsinki. All participants received a complete description of the study and provided written informed consent.
Consent for publication
Not applicable.