





1. Introduction
Supercritical pressure fluids are used as working fluids in many industrial applications, such as advanced nuclear reactors, transcritical CO $_2$ refrigeration system, platelet transpiration cooling methods and solar-thermal power stations (Mao et al. Reference Mao, Zhou, Wei, Liu and Zhang2021; Ehsan et al. Reference Ehsan, Awais, Lee, Salehin, Guan and Gurgenci2023). Advanced platelet transpiration cooling methods are intended to protect surfaces with significant thermal loads, such as walls in rocket thrust chambers at high operating temperatures (May & Burkhardt Reference May and Burkhardt1991; Yin & Liu Reference Yin and Liu2018). Platelet cooling technology has been developed as a very flexible thermal management method by designing diffusion bonding together thin metal platelets which contain etched coolant passages. The coolant passages are generally very small, from a dozens of microns to hundreds of microns range (Mueggenburg et al. Reference Mueggenburg, Hidahl, Kessler and Rousar2010). The advanced supercritical
 ${\rm CO}_2$ Braydon cycle has gained much interest in renewable energy systems to improve the cycle efficiency. The design method of the high-efficiency compact heat exchanger of high efficiency and compactness is the focal point (Robey et al. Reference Robey, Ramesh, Sabau, Abdoli, Black, Straub and Yip2022). In view of increasing power density and higher integration degree of electric technology, microchannel heat sink is a promising technology for power electronics cooling. Compared with traditional refrigerants, supercritical
 ${\rm CO}_2$ is promising as a heat transfer fluid in microchannel heat sink (Leng et al. Reference Leng, Wang, Yan and Wang2016). In the above advanced technologies, the supercritical pressure fluids often flow through micron-scale channels with high heat fluxes at the surfaces and present very advantageous but complicated flow and heat transfer characteristics.
A variety of technologies have been developed to combat new challenges of extreme thermal loads, including thermoelectric, two-phase and supercritical technologies. Turbulent convection cooling in microchannels is one of the practical threads of technology (Zeighami et al. Reference Zeighami, Laser, Zhou, Asheghi, Devasenathipathy, Kenny, Santiago and Goodson2000), since the commonly used single-phase laminar convection are not in the position to address the heat removal needs. From the 1990s, many microchannel cooling studies have utilized turbulent convection in micron-scale channels; both theoretical models and experimental investigations have been reported (Phillips Reference Phillips1990; Hegab, Ban & Ameel Reference Hegab, Ban and Ameel2002). As a result, the turbulent heat transfer and pressure drop characteristics of the supercritical pressure fluids in micron-scale channels are of significance to the development of future energy and power systems using supercritical pressure fluids.
The major reason that the heat transfer characteristics can be very complicated is the drastic thermophysical properties variation within small temperature and pressure changes as shown in figure 1. Variations in the thermophysical properties of supercritical pressure fluids directly influence the heat transfer ability. For example, the increase in specific heat and thermal conductivity will enhance the heat transfer near the pseudocritical point. When a pure substance is heated in a constant-pressure process at a pressure greater than the critical point, there are no two phases present. But there is a continuous change in molecular organization structure, resulting in continuous changes in physical property (Yoo Reference Yoo2013). The pseudocritical point  $(T_{pc}, P_{pc})$ corresponds to the maximum value of specific heat at this particular pressure. In addition, changes in temperature or pressure cause non-uniform distributions of thermophysical properties that not only directly influence other properties, but also contribute to buoyancy and flow acceleration and thereby induce abnormal turbulent dynamics and heat transfer phenomena.
Thermophysical properties of supercritical pressure  ${\rm CO}_2$ at
 $7.8$ MPa (solid lines) and
 $8.8$ MPa (dashed lines).

Convective heat transfer to supercritical pressure fluids has been investigated since the 1950s by many researchers for applications of supercritical fluids in various industrial fields (Krasnoshchekov & Protopopov Reference Krasnoshchekov and Protopopov1966; Hall Reference Hall1971; Petukhov Reference Petukhov1977; Petukhov, Polyakov & Launder Reference Petukhov, Polyakov and Launder1988; Jackson Reference Jackson2001; Jiang et al. Reference Jiang, Xu, Lv, Shi, He and Jackson2004). The working fluids have mostly been water, carbon dioxide and hydrocarbon fuels. Over time, extensive experimental studies have been developed, and they have provided comprehensive quantitative and qualitative insights into the complicated heat transfer characteristics of supercritical pressure fluids (Kirillov, Yur'ev & Bobkov Reference Kirillov, Yur'ev and Bobkov1990; Jackson Reference Jackson2002; Liao & Zhao Reference Liao and Zhao2002; Kim, Jeon & Lee Reference Kim, Jeon and Lee2007; Kim et al. Reference Kim, Kim, Song and Bae2008). The previous studies showed that the turbulent heat transfer characteristics of supercritical pressure fluid could be especially complex and difficult to predict. The complicated heat transfer behaviour, including deterioration, recovery and enhancement mainly resulted from the violent thermophysical property variations, buoyancy and acceleration of the bulk flow. To understand the mechanism of the turbulent heat transfer of supercritical pressure flow, it is important to figure out how the turbulence dynamics are affected.
The turbulent heat transfer rules under different pipe diameters are significantly different. Several theories have been proposed for the mechanism for turbulent convective heat transfer of fluid at supercritical pressure in different conditions. With the decrease of pipe diameter, the effect of buoyancy decreases and the effect of flow acceleration increases. The characteristics of supercritical pressure flow at low Reynolds number in tubes with diameter of tens of millimetres were found to be influenced by buoyancy and thermophysical properties. In millimetre-scale tubes, the turbulent convection is influenced by coupling effects of buoyancy and thermal acceleration. In the micron-scale tubes, flow acceleration and scale effect will induce more complicated flow and heat transfer characteristics, which is not yet fully understood. Numerical simulation has been regarded as a method to help understand the phenomenon and mechanisms of supercritical heat transfer (Bae, Yoo & Mceligot Reference Bae, Yoo and Mceligot2008; He, Kim & Bae Reference He, Kim and Bae2008; Mohseni & Bazargan Reference Mohseni and Bazargan2011; Nemati et al. Reference Nemati, Patel, Boersma and Pecnik2015; Peeters et al. Reference Peeters, Pecnik, Rohde, Van der Hagen and Boersma2016; Jiang, Wang & Xu Reference Jiang, Wang and Xu2018; Cao et al. Reference Cao, Xu, Yan, He and Jiang2021; He et al. Reference He, Tian, Jiang and He2021). Herein, we would like to give a brief introduction to current knowledge of turbulent dynamics of heated flows at supercritical pressures and to set the scene for the research in this present paper.
Several numerical studies have investigated the effects of variations in thermophysical properties on turbulent dynamics (Zonta, Marchioli & Soldati Reference Zonta, Marchioli and Soldati2012a; Lee et al. Reference Lee, Jung, Sung and Zaki2013; Zonta Reference Zonta2013; Zonta & Soldati Reference Zonta and Soldati2014; Patel et al. Reference Patel, Peeters, Boersma and Pecnik2015). Zonta et al. (Reference Zonta, Marchioli and Soldati2012a) reported that the characteristics of streaks are affected by variations in viscosity. The authors showed that high- and low-viscosity regions dampen and enhance the intensity of turbulence, which has a large influence on momentum and heat transfer in channel flows. Patel et al. (Reference Patel, Peeters, Boersma and Pecnik2015) found that the stability of streaks was significantly affected by mean density and viscosity stratification. These studies have indicated that strong variations in properties had a profound effect on turbulent dynamics, whereas it was not very clear whether these were direct effects of changes in thermophysical properties or indirect effects of induced buoyancy and flow acceleration.
Besides the Reynolds-averaged Navier–Stokes simulations, many direct numerical simulation (DNS) studies have contributed to the establishment of the general understanding of a mechanism of property variations. Nemati et al. (Reference Nemati, Patel, Boersma and Pecnik2015) studied the effects of buoyancy and large thermophysical property variations on mean flow statistics and reported that property fluctuations had a small effect on mean momentum and a large effect on energy budgets of Reynolds stresses. Peeters et al. (Reference Peeters, Pecnik, Rohde, Van der Hagen and Boersma2016) conducted a DNS of supercritical fluid flow in an annular channel with a hot outer wall and a cool inner wall to study the buoyancy effect in aiding and opposing flows. Turbulence was significantly decreased near the hot wall but increased near the cold wall; this was only partially attributed to the effects of mean dynamic viscosity and density variations. The authors concluded that near the pseudocritical temperature, the structural effect decreased because the temperature fluctuation diminished, but in contrast, it became effective when the heat capacity was smaller. Furthermore, Azih & Yaras (Reference Azih and Yaras2018) investigated the structural effect of density variations on the topology of turbulence in heated channel flow of supercritical fluids. It was shown that the reduction in density and viscosity in forced convection contributed to the generation of small-scale vortices and the interaction and breakage of existing large near-wall structures, which resulted in a reduction in turbulent mixing. He et al. (Reference He, Tian, Jiang and He2021) proposed a new understanding of turbulent dynamics in a heated flow of fluid at supercritical pressure by treating the various factors (i.e. variable viscosity, buoyancy and thermal expansion) as pseudo-body forces. The effect of pseudo-body forces caused a reduction in the so-called apparent Reynolds number, which led to the turbulence attenuation. In their study, the partially laminarizing flow was represented by a reference flow with equivalent pressure gradient plus a flow perturbation. Their conclusion about the effect of buoyancy on turbulent dynamics was consistent with the results of previous studies under similar conditions. However, the present studies mainly considered the fluid properties variations with temperature changes under constant wall temperature or constant heat flux boundary condition. There is a gap in the research of the mechanisms of pressure changes which caused physical property variations on the turbulent heat transfer.
The buoyancy effect caused by density gradient on turbulent mixed convective in millimetre-scale tubes has received considerably more attention. The buoyancy effect makes an interesting contribution in terms of decreasing convective heat transfer due to turbulence, recovery and enhancement by influencing the intensity and structures of turbulence. An early explanation of the mechanism involved was given by Hall & Jackson (Reference Hall and Jackson1969). They suggested that the dominant factor was the modification of the shear stress distribution across the pipe, with a consequent change in turbulence production. In a follow-up study (Petukhov et al. Reference Petukhov, Polyakov and Launder1988), the authors further analysed the effect of buoyancy on the dynamics of turbulence and proposed that the influence of buoyancy forces can be characterised into two ways as a structural (direct) effect and an external (indirect) effect. The former refers to the effect of the interactions between the fluctuating buoyancy force and velocity  $\overline {\rho ' u '}$, which is quantified by the buoyancy production term in the turbulent kinetic energy equation. The external effect refers to the fact that buoyancy acting as a body force distorts the mean velocity profile by local flow acceleration or deceleration, which in turn results in a change in turbulence shear stress production. Bae, Yoo & Choi (Reference Bae, Yoo and Choi2005) further noted that turbulent heat transfer is recovered and even enhanced as the turbulence regeneration restored, when the mean velocity distribution is deformed into an M-shaped profile in upward flow.
However, there are far fewer investigations into the effect of flow acceleration than the effect of the buoyancy effect on convective heat transfer by turbulent flow. Flow acceleration including thermal expansion is usually not a strong effect compared with the buoyancy effect in tubes and channels with large diameters (e.g.  $d_{in} > 1\,{\rm mm}$), as concluded by Jiang et al. (Reference Jiang, Zhao, Zhang, Shi and Li2010). Their experimental results indicated that for all flow orientations, the local Nusselt number decreased substantially with decreasing diameter submillimetre tubes (e.g.
 $d_{in} = 0.27$ mm), which differed from results for normal size tubes due to flow acceleration. In the study of Peeters et al. (Reference Peeters, Pecnik, Rohde, Van der Hagen and Boersma2016), the annular flows with hot and cool walls enable the authors to study the influence of both thermal expansion and buoyancy on the evolution of streamwise coherent structures. The authors demonstrated that near the hot wall, both thermal expansion and buoyancy had negative impacts on coherent streak flank strength. They noted that the thermal expansion had the largest influence. For millimetre-scale channels, Cao et al. (Reference Cao, Xu, Yan, He and Jiang2021) conducted a DNS study of convective heat transfer of supercritical pressure
 ${\rm CO}_2$ in a heated vertical tube with
 $d^*=1\,{\rm mm}$, with coupling buoyancy and thermal acceleration effects. The authors observed that under the coupled effects, the turbulent flow and heat transfer exhibited four periods of development in which buoyancy and thermal acceleration alternately dominated. The results indicated that the local flow acceleration induced a stretch-to-disrupt mechanism of coherent turbulent structures. The previous study illustrated the coupling mechanism of buoyancy and thermal acceleration. For submillimetre and micron-scale channels, the coupling effects turn to flow acceleration and scale effect where pressure drops could not be ignored. Compared with studies of the effect of buoyancy on heat transfer, there are relatively few studies on the deterioration of local heat transfer caused by flow acceleration in submillimetre and micron-scale channels.
Previous studies in normal-size channels generally ignored the pressure drop along the flow direction. However, the pressure drops would substantially increase in smaller channels. Though the hydraulic resistance is conventionally increased in turbulence regime and higher pumping powers are required, the turbulence convection in micron channels is necessary for future cooling technologies. Within last three decades, much research has been done on turbulent flow in microchannels with diameter of several microns to hundreds of microns using subcritical pressure refrigerant. The research studied the details relevant for microchannel convection and focused on the transition from laminar flow to turbulence. Peng, Peterson & Wang (Reference Peng, Peterson and Wang1994) studied the pressure drop along channels with hydraulic diameters from 133 to  $367\ \mathrm {\mu }$m and found the transition Reynolds number,
 $200< Re_{tr} <700$. Yu et al. (Reference Yu, Warrington, Barron and Ameel1995) studied the fluid flow and heat transfer characteristics of dry nitrogen gas and water in pipe of diameters from 19 to
 $102\ \mathrm {\mu }$m. The results indicated that turbulent Nusselt numbers in the microchannel were higher than that for larger tubes, suggesting that the Reynolds analogy does not hold for microchannel flow. Zeighami et al. (Reference Zeighami, Laser, Zhou, Asheghi, Devasenathipathy, Kenny, Santiago and Goodson2000) studied turbulent transition in a
 $120\ \mathrm {\mu }$m microchannel at various Reynolds numbers using micron-resolution particle imaging velocimetry. The velocity field data suggest transition for
 $1200< Re_{tr} <1600$, their study provided a direct flow field measurements for a more rigorous study of flow transition in microchannels. In recent years, more experimental investigations about the turbulent mechanism for heat and momentum transfer in microchannels showed that both channel size and surface roughness have remarkable effects on the performance of flow behaviour and heat transfer (Lee, Garimella & Liu Reference Lee, Garimella and Liu2005; Ahmad, Hassan & Megahed Reference Ahmad, Hassan and Megahed2015; Jajja, Zada & Fronk Reference Jajja, Zada and Fronk2019). The prediction of turbulent heat transfer in microchannels differs in microchannels from macrochannels.
As for turbulence flows at supercritical pressure, the high specific heat capacity and low viscosity characteristics are beneficial to reduce the pressure drop. But the mechanism of pressure drop influence on the turbulence convection is not clear. Most numerical research on turbulent heat transfer of supercritical pressure fluids was conducted in normal-size channels with the assumption of thermodynamically constant pressure, which determines all thermodynamic state variables at a constant thermodynamic pressure,  $P_0$. Recognizing the apparent lack of systematic research on heat and momentum transport in microchannels, Jiang et al. (Reference Jiang, Zhao, Zhang, Shi and Li2010, Reference Jiang, Liu, Zhao and Luo2013) and Liao & Zhao (Reference Liao and Zhao2002) conducted experimental investigations of heat transfer and pressure drops characteristics in micron-scale pipes. They concluded that the thermodynamic pressure change was non-negligible when the tube is micron-scale or the ratio of heat flux to mass flow rate was large and a thermophysical pressure change occurred in the tube. According to Jiang et al. (Reference Jiang, Zhao, Zhang, Shi and Li2010, Reference Jiang, Liu, Zhao and Luo2013), the thermophysical pressure change consists of pressure drops due to friction and acceleration, which can be of the same order of magnitude as the inlet pressure and have a significant effect on the heat transfer of supercritical fluids. The pressure drop contributes to significant global flow acceleration as well as thermal acceleration caused by the temperature gradient in the heated tube flow since density changes with pressure and temperature. In summary, the decrease in heat transfer caused by global flow acceleration is different from that caused by the buoyancy effect. Lack of understanding of this behaviour is responsible for lack of a corresponding predictive method. Thus, there is a need for more studies and better understanding of heat transfer in submillimetre and micron-scale channels.
In this paper, we aim to investigate the mechanisms of turbulence attenuation and heat transfer deterioration in a micron-scale tube at supercritical pressure. Based on our previous study in millimetre-scale tubes (Cao et al. Reference Cao, Xu, Yan, He and Jiang2021), the DNS method has been modified to conduct simulations of supercritical pressure fluid flow in a heated micron tube with an inner diameter of  $99.2\,\mathrm {\mu }$m while considering the pressure variation along the heated section. The thermophysical property variations with pressure as well as temperature are included, and the pressure gradient term in the energy equation is considered. First, we investigated how thermophysical property variation, both the mean variation and its fluctuation, affects the turbulent heat transfer characteristics. Comparisons of numerical predictions with experimental data are provided. Second, an understanding was developed of how flow acceleration affects turbulent motion in a qualitative as well as a quantitative manner, including thermal expansion and pressure drop acceleration. Finally, the generation of turbulence structures under scale effect in micron-scale tube was investigated.
2. Methodology
2.1. Governing equations
The simulations were performed using the code CHAPSim, which is first developed by Seddighi (Reference Seddighi2011). In this study, the code was modified to consider the pressure change in the micron-scale tube, as well as thermophysical property variation due to the pressure change of supercritical pressure fluid flow. Near the critical point, the amplitude of the density fluctuations increases with the associated correlation length  $\xi$, and
 $L$ is the length scale of the given volume. According to the experimental results of Nishikawa, Tanaka & Amemiya (Reference Nishikawa, Tanaka and Amemiya1996), the assumption of local thermodynamic equilibrium is valid in this paper with the scale
 \begin{equation} L\gg \xi \end{equation}
Therefore, we assumed that the heated CO $_2$ flow at supercritical pressure under investigation may be considered to be in local thermodynamic equilibrium, which indicated that the hydrodynamic equations apply fully (Zappoli, Beysens & Garrabos Reference Zappoli, Beysens and Garrabos2014). Under this assumption, the fluid state was described by the hydrodynamic conservation equations written for a viscous, highly expandable fluid with low heat diffusivity, also referred to as a low-Mach number flow.
In the following discussion, the superscript  $*$ denotes the dimensional quantities and the subscript 0 denotes the values at the pipe inlet. To derive the low-Mach number equations, one expands the pressure
 $P^*$ as a power series in
 $\varepsilon =\lambda M^2$, the ratio of the dynamic to the thermodynamic pressure. In the definition,
 $\gamma =c_p^*/c_v^*$ is the ratio of specific heats, and
 $M=U_b^*/a^*$ is the Mach number,
 $a^*$ is the sound velocity:
 \begin{align} P^* &= \frac{1}{\varepsilon} \rho^{*(0)} T^{*(0)} + \rho^{*(1)} T^{*(0)} + \rho^{*(0)} T^{*(1)} +\cdots \nonumber\\ &= \frac{1}{\varepsilon} P^{*(0)} + P^{*(1)} +\cdots \, . \end{align}
Equation (2.2) states that the pressure is decomposed of a thermodynamic part  $P^{*(0)}$ and a hydrodynamic part
 $P^{*(1)}$. Obviously,
 $\varepsilon$ is a small parameter in a low Mach number flow, and the hydrodynamic pressure is assumed to be very small compared with the thermodynamic pressure. Thus, all thermophysical property variations due to hydrodynamic pressure fluctuations can be neglected. This would mean that thermodynamic variables such as density, temperature, enthalpy and entropy could be determined as functions of thermophysical pressure and enthalpy; for example,
 \begin{equation} \rho^*(P^*,h^*)= \rho^*(P^{*(0)},h^*). \end{equation}
In addition, the viscous heating term in the energy equation is off, and it is eliminated in the limit of low Mach numbers. We aimed to investigate heated  ${\rm CO}_2$ flows at 7.8 and 8.8 MPa, for which the speed of sound has the minimum value of 173 m s
 $^{-1}$. Considering bulk velocities of 3 m s
 $^{-1}$, the Mach number is less than
 $0.02$, which validates the uses of the low-Mach number assumption. By neglecting the hydrodynamic pressure change, the total pressure change used to evaluate a thermophysical property for supercritical pipe flow is decomposed into three terms from the following equation:
 \begin{equation} \Delta P_{total}^*=\Delta P_{f}^*+\Delta P_{g}^*+\Delta P_{a}^* .\end{equation}
The first term on the right-hand side is the friction pressure drop along the pipe,  $\Delta P_{f}^*$. According to the friction law for smooth pipes, the friction factor
 $f\equiv (\Delta P^*_f D^*)/({1}/{2} \rho ^* \bar {U}^{*2}L^*)$ of the smooth pipe flow is implicitly a function of
 $Re={\rho ^*\bar {U}^{*2}L^*}/{\mu ^*}$, where
 $D^*$ is the diameter of the pipe. This indicates that at a specified inlet
 $Re_0$, the fractional pressure drop
 $\Delta P^*_f$ over an axial distance
 $L$ for pipe flow is proportional to
 $D^{*-3}$. The acceleration pressure drop
 $\Delta P^*_a$ between the inlet and exit, it can be calculated by invoking an energy balance along the heated test section
 $\Delta P^*_a\approx (\rho ^*_0 U^*_0)^2({1}/{\rho ^*_{out}}-{1}/{\rho ^*_0} )$, which is proportional to
 $D^{*-2}$ at a specified inlet
 $Re_0$. Since the height of the vertical section is very small, the gravitational pressure drop along the heated section of the pipe is neglected.
Based on the above analysis, the distribution of the wall shear stress and the pressure drop of supercritical pressure  ${\rm CO}_2$ in a heated tube with diameter
 $D^* = 100\ \mathrm {\mu }$m are evaluated and shown in figure 2. Setting the inlet pressure to 7.8 MPa, inlet temperature to 300 K and inlet Reynolds number to
 $4000$, the Blasius correlation is used to calculate the friction factor. Since the magnitude of shear stress is inversely proportional to the scale, the dimensional viscous stress in the micron-scale tube with a diameter of
 $100\ \mathrm {\mu }$m is two orders of magnitude larger than that in tubes with a diameter of 1 mm at the same inlet Reynolds number. Therefore, the pressure drop shown along the axial direction is more than 0.1 MPa, which is remarkable compared with the inlet pressure
 $P_0^*$. Figure 3 shows the variation of properties at the pseudocritical temperature with 0.1 MPa pressure drop from
 $P_0^*=7.8\,{\rm MPa}$ and
 $P_0^*=8.8\,{\rm MPa}$. Notably, the physical properties vary significantly with a large pressure drop, especially near
 $P_0^*=7.8$ MPa. From the flow continuity, the following can be deduced:
The distribution of the wall shear stress, and the pressure drop along the axial direction of supercritical pressure  ${\rm CO}_2$ in a micron tube. The diameter of the tube is
 $D^*= 100\ \mathrm {\mu }$m, the inlet pressure is
 $P_0^*=7.8\,{\rm MPa}$, the inlet temperature is
 $T_0^*=300\,{\rm K}$ and the inlet Reynolds number is
 $Re_0= 4000$.

Variation of the (a) density, (b) thermal conductivity, (c) viscosity, (d) specific capacity at  $T_{pc}^*$ with 0.1 MPa pressure change from
 $P_0^*=7.8$ MPa (—) and
 $P_0^*=8.8$ MPa (- -), respectively.

 \begin{equation} {\rm d} G=\rho_b {\rm d} u_b +u_b {\rm d} \rho_b =0; \end{equation}
therefore
 \begin{equation} \frac{{\rm d} u_b}{{\rm d}\kern 0.06em x}={-}\frac{u_b}{\rho_b} \frac{{\rm d} \rho_b}{{\rm d}\kern 0.06em x}={-}\frac{u_b}{\rho_b} \left[ \left(\frac{\partial \rho_b}{\partial p} \right)_{T_b} \frac{{\rm d} p}{{\rm d}\kern 0.06em x}+ \left(\frac{\partial \rho_b}{\partial T_b} \right)_p \frac{{\rm d} T_b}{{\rm d}\kern 0.06em x} \right] .\end{equation}
That is, the flow acceleration includes the part caused by the reduction in pressure along the way and the part caused by the thermal expansion of the fluid. For supercritical pressure fluids flowing in micron-scale diameter channels near the critical point, both parts could have a significant effect on the turbulence dynamics and contribute to severe heat transfer deterioration. Thus, it is necessary to reconsider the pressure variation in the governing equation and thermoproperty update function.
Based on the assumption above, the property change caused by hydrodynamic pressure fluctuations and the viscous heating term is neglected, but the total pressure change term in the governing equations is considered in the micron tube. The governing equations are solved in the following conservation form in a cylindrical coordinate system:
 \begin{align} &\frac{{\partial} \rho}{{\partial} t}+\frac{{\partial} (\rho u_x)}{{\partial} x}+\frac{1}{r}\frac{{\partial} (r \rho u_r)}{{\partial} r}+ \frac{1}{r}\frac{{\partial} (\rho u_\theta)}{\theta}=0, \end{align}
 \begin{align} & \frac{{\partial} (\rho u_x)}{{\partial} t}+\frac{{\partial} (\rho u_x u_x)}{{\partial} x} + \frac{1}{r}\frac{{\partial} (r \rho u_r u_x)}{{\partial} r} +\frac{1}{r}\frac{{\partial}(\rho u_\theta u_x)}{{\partial} \theta} \nonumber\\ &\quad ={-}\frac{{\partial} P}{{\partial} x} \mp \frac{\rho}{Fr_0^2}+\frac{1}{{{Re}}_{0}} \left(\frac{{\partial} \tau_{xx}}{{\partial} x} +\frac{1}{r}\frac{{\partial} (r \tau_{xr})}{{\partial} r}+ \frac{1}{r}\frac{{\partial} \tau_{x\theta}}{{\partial} \theta} \right), \end{align}
 \begin{align} & \frac{{\partial} (\rho u_r)}{{\partial} t}+\frac{{\partial} (\rho u_x u_r)}{{\partial} x} + \frac{1}{r}\frac{{\partial} (r \rho u_r u_r)}{{\partial} r} +\frac{1}{r}\frac{{\partial}(\rho u_\theta u_r)}{{\partial} \theta}+ \frac{\rho u_\theta u_\theta}{r} \nonumber\\ &\quad ={-}\frac{{\partial} P}{{\partial} r}+\frac{1}{{{Re}}_{\rm 0}}\left(\frac{{\partial} \tau_{rx}}{{\partial} x} + \frac{1}{r}\frac{{\partial} (r \tau_{rr})}{{\partial} r}+\frac{1}{r}\frac{{\partial} \tau_{r\theta}}{{\partial} \theta} - \frac{\tau_{\theta \theta}}{r} \right), \end{align}
 \begin{align} &\frac{{\partial} (\rho u_\theta)}{{\partial} t}+\frac{{\partial} (\rho u_x u_\theta)}{{\partial} x} + \frac{1}{r}\frac{{\partial} (r \rho u_r u_\theta)}{{\partial} r} +\frac{1}{r}\frac{{\partial}(\rho u_\theta u_\theta)}{{\partial} \theta}+ \frac{\rho u_r u_\theta}{r} \nonumber\\ &\quad ={-}\frac{1}{r}\frac{{\partial} P}{{\partial} \theta}+\frac{1}{{{Re}}_{\rm 0}}\left(\frac{{\partial} \tau_{\theta x}}{{\partial} x} + \frac{1}{r^2}\frac{{\partial} (r^2 \tau_{\theta r})}{{\partial} r}+ \frac{1}{r}\frac{{\partial} \tau_{\theta \theta}}{{\partial} \theta}\right), \end{align}
 \begin{align} & \frac{{\partial} (\rho h)}{{\partial} t}+\frac{{\partial} (\rho u_x h)}{{\partial} x}+\frac{1}{r}\frac{{\partial}(r \rho u_r h)}{{\partial} r}+ \frac{{\partial} (\rho u_\theta h)}{{\partial} \theta} \nonumber\\ &\quad =\frac{U_0^2}{c_{p0}T_0}\left(\frac{{\partial} P}{{\partial} t} +u_x \frac{{\partial} P}{{\partial} x}+ \frac{u_r}{r} \frac{{\partial} P}{{\partial} r} + \frac{u_\theta}{r} \frac{{\partial} P}{{\partial} \theta} \right) \nonumber\\ &\qquad +\frac{1}{{{Re}}_{\rm 0}}\frac{1}{{{Pr}}_{\rm 0}} \left[\frac{{\partial}}{{\partial} x} \left(\lambda \frac{{\partial} T}{{\partial} x}\right)+\frac{1}{r}\frac{{\partial}}{{\partial} r}\left(r \lambda \frac{{\partial} T}{{\partial} r}\right)+\frac{1}{r}\frac{{\partial}}{{\partial} \theta}\left(\frac{1}{r} \lambda \frac{{\partial} T}{{\partial} \theta}\right)\right], \end{align}
where
 $$\begin{gather} \tau_{ij}=2\mu S_{ij} - \frac{2}{3}\mu \frac{{\partial} u_k}{{\partial} x_k}\delta_{ij}, \end{gather}$$
 $$\begin{gather}S_{ij}=\frac{1}{2}\left(\frac{{\partial} u_i}{{\partial} x_j} +\frac{{\partial} u_j}{{\partial} x_i}\right). \end{gather}$$
The negative sign in front of the gravitational force term in (2.8) corresponds to upward flows, and the positive sign corresponds to downward flows. The above governing equations are defined in cylindrical coordinates  $(x,r,\theta )$ in the present study, where,
 $x,r,\theta$ are the streamwise, radial and circumferential coordinates, respectively. In addition, the wall-normal distance
 $y (= 1-r)$ is used in this paper. In the above governing equations, the variables are all in non-dimensional form defined as follows:
 \begin{align}
\left.\begin{gathered}
t=\frac{t^*}{R^*/U^*_0},\quad x_i=\frac{x^*_i}{R^*},\quad
u_i=\frac{u^*_i}{U^*_0},\quad P=\frac{{{P}^{*}}}{\rho
_{0}^{*}U_{0}^{*2}},\\
\rho =\frac{{{\rho }^{*}}}{\rho _{0}^{*}},\quad \mu
=\frac{{{\mu }^{*}}}{\mu _{0}^{*}},\quad \lambda
=\frac{{{\lambda }^{*}}}{\lambda _{0}^{*}},\quad
{{c}_{p}}=\frac{c_{p}^{*}}{{{c}_{p}}_{0}^{*}},\\
T=\frac{{{T}^{*}}}{T_{0}^{*}},\quad
h=\frac{{{h}^{*}}-h_{ref}^{*}}{{{c}_{p}}_{0}^{*}T_{0}^{*}},
\end{gathered}\right\}
\end{align}
where the subscript 0 denotes the inlet value, and the superscript  $*$ denotes a dimensional value. All the equations are in dimensionless form normalized with the inlet bulk velocity denoted by
 $U_0^*$, and
 $R^*$ is the tube radius. The thermophysical properties, including temperature, are normalized by their inlet values. The enthalpy is normalized by the inlet specific heat capacity
 $c_{p0}^*$, the inlet temperature
 $T_0^*$ and the referred enthalpy
 $h_{ref}^*$, which is the enthalpy at a temperature much higher than the pseudocritical value at the working pressure. The non-dimensional parameters shown in the governing equations are written as
 \begin{equation} Re_{0}=\frac{\rho _{0}^{*}U_{0}^{*}{{R}^{*}}}{\mu _{0}^{*}},\quad Pr_{0}=\frac{\mu _{0}^{*}{{c}_{p}}_{0}^{*}}{\lambda _{0}^{*}},\quad \frac{1}{F{{r}_{0}}}=\frac{{{g}^{*}}{{R}^{*}}}{U_{0}^{*2}}, \end{equation}
where  $g^*$ represents the magnitude of the gravitational vector. All the thermophysical properties of
 $\textrm {CO}_2$ are from a National Institute of Standards and Technology database (Lemmon, Huber & McLinden Reference Lemmon, Huber and McLinden2010). The fluid temperature is calculated first from the computed static enthalpy and thermodynamic pressure, while other properties are updated as functions of temperature and thermodynamic pressure using a third-order spline interpolation along an isobar. Notably, the change in thermodynamic pressure
 $P^{*(0)}$ is considered when we update the properties.
2.2. Numerical methods
The low-Mach-number equations for variable-density flows are solved using a conservative space–time discretization scheme that was developed by Pierce (Reference Pierce2001), Pierce & Moin (Reference Pierce and Moin2004) and Wall, Pierce & Moin (Reference Wall, Pierce and Moin2002), in which each velocity component is staggered by half a time step and by half a space step with respect to scalar variables such as temperature and density. An explicit low-storage, third-order Runge–Kutta scheme is used for temporal discretization, while a second-order central difference scheme is used for spatial discretization. The pressure terms in the governing equations are always treated implicitly via the Poisson equation.
The numerical methods described above were previously used to simulate incompressible turbulent flows with variable thermophysical properties at supercritical pressure. The code was successfully validated for velocity profiles and temperature profiles of heated and unheated turbulent flows. The details of their numerical methods and validation can be found in Cao et al. (Reference Cao, Xu, Yan, He and Jiang2021), He et al. (Reference He, Tian, Jiang and He2021) and Seddighi (Reference Seddighi2011). The good agreement indicates that the turbulence generator can generate reasonable turbulence in the tube.
2.3. Simulation conditions
A schematic diagram of the heated section for upward pipe flow is shown in figure 4. Before the heated section, a periodic inflow turbulence generator with  $L^*/R^*=10$ is applied to generate the time-dependent velocity as inlet boundary condition (Cao et al. Reference Cao, Xu, Yan, He and Jiang2021). The heated section is strongly heated with a constant non-dimensional heat flux, and no-slip boundary conditions at the wall. For the outflow, the convective boundary condition (Orlanski Reference Orlanski1976) is specified for the velocities and the enthalpy. The diameter of heated pipe is micron-scale, which is the typical characteristic scale of chamber cooling channels. The significant pressure drop influence and scale effect occurred in the micron-scale pipe. Five experimental cases by Jiang et al. (Reference Jiang, Liu, Zhao and Luo2013) were selected to be simulated using DNS to investigate flow acceleration including thermal expansion and pressure drop acceleration, while the other four cases were selected to simulate flow acceleration considering only thermal expansion in a heated micron tube. Table 1 summarizes the flow conditions in terms of non-dimensional parameters.
Schematic diagram of the heated section (for upward pipe flow).

Flow conditions for the supercritical pressure  $\textrm {CO}_2$ flow simulations (
 $D^*=99.2\ \mathrm {\mu }$m).

The non-dimensional buoyancy parameter  $Bo^*$ used to evaluate the buoyancy effect is defined as (Jackson & Hall Reference Jackson and Hall1979)
 \begin{equation} Bo^{*}=\frac{Gr^{*}}{Re^{3.425}Pr^{0.8}},\quad Gr^{*}=\frac{g{{\alpha }_{p}}d_{i}^{4}{{q}_{w}}}{\lambda {{\nu }^{2}}}. \end{equation}
The non-dimensional flow acceleration parameter  $Kv$ used to evaluate the flow acceleration due to thermal expansion and pressure drop is defined as
 \begin{equation} \left.\begin{gathered}
Kv=\frac{{{\nu
}_{b}}}{{{u}_{b}}^{2}}\frac{\text{d}{{u}_{b}}}{\text{d}\kern
0.06em x}={-}\frac{d}{Re} {{\beta
}_{T}}\frac{\text{d}p}{\text{d}\kern 0.06em x}+
\frac{4{{q}_{w}}d{{\alpha }_{p}}}{{{Re}^{2}}{{\mu
}_{b}}{{c}_{p}}},\\
Kv_{T}=\frac{4{{q}_{w}}d{{\alpha
}_{p}}}{{{Re}^{2}}{{\mu}_{b}}{{c}_{p}}},\quad
Kv_{p}={-}\frac{d}{Re} {{\beta
}_{T}}\frac{\text{d}p}{\text{d}\kern 0.06em x},
\end{gathered}\right\}
\end{equation}
where  $Kv_T$ is the non-dimensional thermal expansion acceleration parameter proposed by Mceligot & Jackson (Reference Mceligot and Jackson2004) which describes the effect of flow acceleration due to density variation with temperature, and
 $Kv_p$ is the non-dimensional flow acceleration parameter describing the effect of flow acceleration due to pressure drop through the tube, modified by Jiang et al. (Reference Jiang, Liu, Zhao and Luo2013).
As mentioned in the introduction, when the tube size is reduced to the micron-scale size, the buoyancy effect is reduced; however, the flow acceleration effect, including both the flow acceleration due to thermal expansion and the flow acceleration due to the pressure drop in the tube is more significant than in large tubes. For these cases in simulation,  $Bo^*$ has a magnitude of
 $10^{-9}$, much less than the threshold of
 $5.6\times 10^{-7}$ given by Mceligot & Jackson (Reference Mceligot and Jackson2004), and
 $2.0 \times 10^{-7}$ given by Jiang et al. (Reference Jiang, Zhao, Zhang, Shi and Li2010) with buoyancy effects only important for
 $Bo^*$ above this value. This indicates that the buoyancy effect can be ignored. The local non-dimensional flow acceleration parameter
 $Kv$ has a magnitude of
 $10^{-7}$–
 $10^{-6}$, and the previous experiment indicated that the high heat fluxes and the heat transfer were reduced by the flow acceleration effect when the non-dimensional flow acceleration parameter,
 $Kv$, exceeded approximately
 $6.0\times 10^{-7}$ (Jiang et al. Reference Jiang, Liu, Zhao and Luo2013).
The details of the mesh used in the present study and comparison with simulations from the literature are summarized in table 2. In the axial and circumferential directions, the grids are uniform. In the radial direction, the grid spacing is non-uniform with, conveniently, a finer grid spacing near the wall with a hyperbolic tangent function. Note that a grid spacing of approximately  $O (0.1\eta )$ and
 $O (0.1\delta _v)$ in the radial direction is satisfied at the wall, where
 $\eta \equiv (\nu ^3/\varepsilon )^{1/4}$ is the Kolmogorov scale and
 $\delta _\nu \equiv \nu / u_\tau$ are expected to be smaller than the Kolmogorov length scale
 $\eta$, since the Prandtl number
 $Pr > 1$. For most of the remaining flow
 $Pr\approx 4$, and it is believed that the mesh resolution captures all the relevant scales. To quantify this, simulations with two coarser meshes were performed in a short section
 $L^*/D^*=10$ for case I in table 2. The results for both meshes are compared in terms of averaged streamwise wall temperatures and axial velocity in figure 5. It can be concluded that a finer mesh would incur a much longer calculation time but make only a slight difference in the results. The difference in the local wall temperature did not exceed
 ${\pm }0.1\,\%$. Moreover, the mean velocity profiles in the boundary layer proved that the modified code could generate reasonable turbulence in a micron-scale pipe. The non-dimensional time step used was
 $3.0\times 10^{-4}$ while the Courant–Friedrichs–Lewy number
 $(\textrm {CFL} < 1.0)$ was specified, and the equations were integrated forward in time until the statistically stationary state was reached before collecting turbulence data.
The different mesh resolutions. (a) Averaged temperature along the pipe wall for case I. (b) Mean axial velocity profile for case I at  $x/d=7.5$. Line,
 $384\times 56\times 128$ (present study); solid symbols,
 $432\times 72\times 256$; hollow symbols,
 $432\times 108\times 256$.

Details of the mesh used in the present study and comparison with simulations from the literature.

3. Results and discussion
The purpose of the present study is to further understand the mechanism of turbulent convective heat transfer of supercritical pressure fluids in heated microtubes, which is influenced by variations in thermophysical properties, the scale effect and flow acceleration; the last two factors are particularly significant in micron-scale tubes. In this discussion, we first give a comparison between DNS and experiments and the analyse the heat transfer and flow characteristics both qualitatively and quantitatively. Next, we investigate the thermophysical property variations with respect to the temperature and pressure changes, and their influence on turbulent motions and convective heat transfer. Subsequently, we investigate instantaneous and mean velocity fields to show the development of the original turbulence in the spatial accelerating flow. This is followed by a discussion on the development of turbulence statistics and structures. To that end, we elucidate the physical mechanism of the peculiar characteristics of turbulent heat transfer to supercritical pressure fluids in a heated micron tube.
In the results and discussion, the mean quantities are obtained by taking a statistical average over time and the homogeneous circumferential direction using Reynolds and Favre averaging. In the following discussions, Favre averaging and Reynolds averaging are used to obtain the mean quantities of density-variable turbulent flows. Let  $\varphi$ be a general property of turbulence that can be decomposed into the Reynolds form or Favre form. The Favre average is defined as
 \begin{equation} \tilde{\varphi}=\overline{\rho \varphi }/\bar{\rho }\varphi =\tilde{\varphi}+{\varphi }'', \end{equation}
where  $\bar {\varphi }$ denotes the Reynolds average, which is defined as an average over time and the homogeneous circumferential direction. For the steady state conditions studied in this study, a sufficiently long period of time after full development is selected to be statistically averaged to give direct statistical values of Reynolds stress and other parameters for the observation and analysis of turbulence behaviour. Notably, the mean temperature is always calculated with Reynolds averaging.
3.1. Heat transfer and hydraulic resistance characteristics
In this section, we begin the investigation with the heat transfer and hydraulic resistance characteristics of the present simulations and compare the results of DNSs and experiments. The corresponding experimental studies were conducted by the authors’ group (Jiang et al. Reference Jiang, Liu, Zhao and Luo2013) using a vertical smooth stainless steel 1Cr18N9T tube. The inner tube diameter was  $99.2\ \mathrm {\mu }$m and the outer diameter was
 $217\ \mathrm {\mu }$m. The test section had a 40 mm heated section and 5 mm adiabatic sections before and after the heated section. The authors indicated that the experimental uncertainty of the heat transfer coefficient was
 ${\pm }12.7\,\%$, and the experimental uncertainty of the pressure was
 $0.13\,\%$. Since the effects of the flow acceleration are more significant at relatively lower pressures close to pseudocritical point and lower inlet Reynolds number, in the simulation the boundary conditions of cases A–C were set to be consistent with the relatively low inlet pressure and low Reynolds numbers cases of the experimental studies. In this way, we were able to provide comparisons of the wall temperature, Nusselt number and pressure drop between the DNS and experimental results.
In the discussion, we need to define some of the physical quantities in the experiments and simulations. The local heat transfer coefficient,  $h_x^*$, at each axial location is calculated as
 \begin{equation} h_{x}^{*}=\frac{q_{w}^{*}(x)}{T_{w}^{*}(x)-T_{b}^{*}(x)}, \end{equation}
where  $q_{w}^{*}(x)$ is the local heat flux on the inner wall,
 $T_{w}^{*}(x)$ is the inner wall temperature and
 $T_{b}^{*}(x)$ is the local bulk fluid temperature. Based on the mass and energy conservation, the bulk parameters are defined as follows:
bulk mass flux,  $G_{b}^{*}$,
 \begin{equation} G_{b}^{*}=\frac{1}{A}\int_{A}{\overline{\rho {{u}_{x}}}}\,{\rm d} A; \end{equation}
bulk enthalpy,  $H_{b}^{*}$,
 \begin{equation} H_{b}^{*}=\frac{1}{G_{b}^{*}A}\int_{A}{\overline{\rho {{u}_{x}}h}}\,{\rm d} A; \end{equation}
bulk temperature,  $T^*_b$, and bulk thermophysical property,
 $\phi _{b}^{*}$,
 \begin{equation} T_{b}^{*}=T({{P}^{*(0)}},H_{b}^{*})/T_{0}^{*},\quad \phi _{b}^{*}=\phi ({{P}^{*(0)}},T_{b}^{*})/\phi _{0}^{*}; \end{equation}
bulk velocity,  $U^*_b$,
 \begin{equation} {U^*_b=\frac{G_{b}^{*}}{\rho_{b}^{*}}} \end{equation}
the convective heat transfer coefficient,  $h$,
 \begin{equation} h=\frac{q_{w}^{*}}{T_{w}^{*}-T_{b}^{*}}. \end{equation}
The streamwise distributions of the dimensional wall temperature  $T^*_w$ and local Nusselt number
 $Nu(x)$ are shown in figure 6(a,b). In figure 6(a), the DNS results for the relatively low pressure and low inlet Reynolds number cases A–C show trends similar to those of the corresponding experimental measurements with a local peak and then a decline, which indicates that the heat transfer decreases locally. Figure 6(b) gives the distributions of wall temperature at 8.8 MPa. For case I, the heat flux is low and the bulk temperature at outflow is beyond pseudocritical temperature. The wall temperature distribution is almost linear after the entrance region, which represented the normal heat transfer behaviour of supercritical pressure fluids. With the increase of heat flux, the distribution of wall temperature shows a non-monotonic trend. This local heat transfer decrease is due to the continuously reduced turbulence while accelerating along the streamwise direction, as shown below. When the bulk fluid temperature approaches
 $T_{pc}^*$, all of the thermal properties change dramatically, and the large variation in the other thermophysical properties obviously introduce complexity to the heat transfer. In particular, the significant density change associated with a large flow acceleration is expected to occur in the axial direction. In regions farther downstream,
 $T^*_w(x)$ begins to decrease along the streamwise direction after reaching a peak, which is also observed in the convection heat transfer under the influence of buoyancy effect. However, it is noticed that the locations of the wall temperature peaks due to flow acceleration barely change as with the heat flux increased.
Streamwise distributions of wall and bulk temperature (a,b), and the local Nusselt number  $Nu(x)$ (c,d). Thin lines for bulk fluid temperature
 $T_b^*$ for both experiments and simulations, thick lines for DNS results, symbols for experimental results.

Figure 6(c,d) show the distributions of the corresponding local  $Nu(x)=h^*D^*/\lambda ^*_b$, where
 $h^*$ is the convective heat transfer coefficient,
 $D^*$ is the diameter of the tube and
 $\lambda ^*_b$ is the bulk thermal conductivity. In figure 6(c), the comparison of the Nusselt number between the present DNS results and experimental results is presented. Quantitatively, the predictions of the integral heat transfer parameter, including the wall temperature and the local Nusselt number, are in good agreement with the experimental data. The maximum absolute errors in
 $T_w$ and
 $Nu$ between experiments and predictions are 5.80 K and 14.22. Neglecting the possible inconsistency in boundary conditions, the DNS code was proven to produce good results for heat transfer of supercritical pressure fluids in the heated micron tubes. The magnitude of
 $Nu(x)$ directly represents the strength of convective heat transfer capacity. As already explained in the temperature behaviours, for lightly accelerating case I the local Nusselt number
 $Nu(x)$ increases monotonously, for significantly accelerating cases A–C and II–III the local Nusselt number
 $Nu(x)$ decreases at first and then increases along the streamwise direction.
Because the  $Bo^*$ number and
 $Kv$ number based on the bulk properties are independent of the flow direction, only one value for the upward direction is given in the following analysis. Figure 7 shows the distribution of the local
 $Bo^*$ number and the local
 $Kv$ number for upward flow. As shown in figure 7(a,b), the
 $Bo^*$ number is higher near the inlet and then decreases rapidly. The peak
 $Bo^*$ in this set of conditions is much less than the critical value of
 $2.0 \times 10^{-7}$ proposed by Jiang et al. (Reference Jiang, Zhao, Zhang, Shi and Li2010). This indicates that the effect of the buoyancy force is negligible for all cases in our simulation.
Streamwise distributions of the buoyancy parameter  $Bo^*$ (a,b) and the flow acceleration parameter
 $Kv$ (lines,
 $-$),
 $Kv_T$ (dash lines, - -) and
 $Kv_p$ (dash dot lines, -
 ${\cdot }$-) (c,d).

The distributions of the dimensionless factors  $Kv_T$ and
 $Kv_p$ characterizing the fluid acceleration effect due to thermal expansion and pressure drop are given in figure 7(c,d). The distribution pattern at low inlet Reynolds number is consistent with that at high inlet Reynolds number. Also,
 $Kv_T$ increases with increasing heat flow density, peaks at fluid temperature close to quasicritical temperature and then decreases, and at high heat flow density, the value of
 $Kv_T$ is already greater than the value of the threshold value
 $6.0 \times 10^{-7}$ (Jiang et al. Reference Jiang, Liu, Zhao and Luo2013). Then
 $Kv_p$ increases with increasing fluid temperature, peaks when the fluid temperature approaches the quasicritical temperature and then decreases rapidly. The trend of the distribution of
 $Kv$ is similar to that of the dimensionless factor
 $Kv_T$. Comparing
 $Kv_T$ and
 $Kv_p$ values,
 $Kv_p$ is relatively low, but the magnitude of the
 $Kv_p$ value is the same as that of
 $Kv_T$ in cases A–C at relatively low inlet pressure and Reynolds number. The distribution of
 $Kv$ values is improved by the
 $Kv_p$ value as shown in figure 7(c). Therefore, the contribution of
 $Kv_p$ to
 $Kv$ is not negligible for case A–C, and
 $Kv_p$ causes a backwards shift in the location where the peak
 $Kv$ appears, and thus the
 $Kv$ peak appears exactly at the location of the peak wall temperature. For the cases I–III at relatively high inlet pressures and Reynolds numbers, the convection heat transfer is expected to be influenced by only thermal expansion since
 $Kv_p$ is one order of magnitude less than
 $Kv_T$.
Comparing figure 6 with 7, the position of the maximum local  $Kv$ number is close to the position of the minimum local
 $Nu$ number, and the two trends are opposite. The flow acceleration changes the mean velocity distribution of the fluid cross-section, and the decrease of the flow acceleration is stronger than the buoyancy force in the downward flow, resulting in the weakening of the turbulent shear stress near the wall and the suppression of turbulent kinetic energy generation.
The distributions of the local Nusselt number  $Nu_f$ show that the convection heat transfer for the relatively high heat flows is severely impaired and then recovered in the heated micron-scale tubes due to the flow acceleration. It is interesting to compare the present Nusselt number with that of forced convection. In figure 8, the ratios of the local Nusselt number for mixed convection
 $Nu$ to that of forced convection
 $Nu_f$ are plotted in terms of the flow acceleration parameter
 $Kv$. Here
 $Nu_f$ is obtained from the modified Krasnoschekow & Protopopov correlation by (Jackson & Hall Reference Jackson and Hall1979)
 \begin{equation} Nu_{f}=0.0183Re_{b}^{0.82}Pr_{b}^{0.4} {{\left(\frac{\rho _{w}^{*}}{\rho _{b}^{*}}\right)}^{0.3}} {{\left(\frac{\overline{c_{p}^{*}}}{{{c}_{p}}_{b}^{*}}\right)}^{n}}, \end{equation}
where the exponent  $n$ for
 ${{({\overline {c_{p}^{*}}}/{{{c}^{*}_{p_{b}}}})}^{n}}$ is defined as
 \begin{equation} n= \left\{\begin{array}{ll} 0.4, & \text{for }T_{b}^{*}< T_{w}^{*}\le T_{pc}^{*}\text{ or }1.2T_{pc}^{*}\le T_{b}^{*}< T_{w}^{*},\\ 0.4+0.2\left(\dfrac{T_{w}^{*}}{T_{pc}^{*}}-1 \right), & \text{for }T_{b}^{*}\le T_{pc}^{*}< T_{w}^{*},\\ 0.4+0.2\left(\dfrac{T_{w}^{*}}{T_{pc}^{*}}-1 \right)\\ \quad \times\left[ 1-5\left(\dfrac{T_{w}^{*}}{T_{pc}^{*}}-1 \right)\right], & \text{for }T_{pc}^{*}< T_{b}^{*}\le 1.2T_{pc}^{*}\text{ and }T_{b}^{*}< T_{w}^{*}. \end{array}\right. \end{equation}
Distributions of the Nusselt number radios with  $Kv$ number.

Note that  $\overline {c_{p}^{*}}=({1}/{T_{w}^{*}-T_{b}^{*}})\int _{T_{b}^{*}}^{T_{w}^{*}}{c_{p}^{*}\,\textrm {d} T={(h_{w}^{*}-h_{b}^{*})}/{(T_{w}^{*}-T_{b}^{*})}}$. The correlation was proposed based on supercritical
 $\textrm {CO}_2$ experiments data at
 $P$, 7.8–9.8 MPa;
 $Re$,
 $8 \times 10^4$–
 $5 \times 10^5$,
 $q_w \le 260\,\textrm {kW}\,\textrm {m}^{-2}$;
 $d$, 4.1 mm. The normalized Nusselt numbers in the present simulations decreases as the
 $Kv$ number increased and is less than unity when
 $Kv$ exceeds
 $6.0 \times 10^{-7}$ (see figure 8). The results are in excellent agreement with the experimental conclusion.
The hydraulic resistance characteristics of cases A–C and I–III are shown in figure 9. Figure 9(a) shows the streamwise distributions of the bulk Reynolds number  $Re_b$. Due to the increase in fluid temperature, which is influenced by the decreases in density and viscosity, along the flow direction, the fluid accelerates very significantly, and the
 $Re_b$ number increases rapidly. The effect of streamwise flow acceleration is coincident with the
 $Kv$ number shown in figure 8. This fact implies that the effect of bulk flow acceleration on the change in heat transfer characteristics is significant in the present simulations.
Streamwise distributions of Reynolds number, pressure drop, and the local friction coefficient for case B and III: (a)  $Reb$, (b)
 $P^{*(0)}$ and (c)
 $C_f$.

Distributions of dimensional pressure drops along the streamwise direction are shown in figure 9(b). In the low heat flux case I, the distribution of  $P^{*(0)}$ is almost linear because the average wall shear stress is basically unchanged. As the wall heat flux increases for case II, the temperature of the near-wall fluid increases at the inlet region, which causes sudden reductions in the dynamic viscosity and wall shear stress near the wall. Therefore, the gradient of the axial pressure drop at the inlet region decreases at first due to the variable viscosity. However, as the flow temperature is heated beyond the pseudocritical point
 $T_{pc}^*$ in the flow downstream, the significant density gradient contributes to the great flow acceleration associated with both increasing friction pressure drop
 $\Delta P_{f}^{*}$ and increasing acceleration pressure drop
 $\Delta P_{a}^{*}$. As the flow acceleration effect increases further, such as in cases A–C, the pressure drops become considerably larger than those in cases I–III and the gradient of the pressure drops continue to increase along the downstream direction. Additionally, the overall pressure change from the inlet to the exit increases as the wall heat flux increases, and is not negligible compared with the inlet thermodynamic pressure
 $P^{*(0)}$; this is consistent with the modified low-Mach-number assumption adopted in the present study.
Distributions of the local skin friction coefficient compared with the Blasius correlation are shown in figure 9(c). For cases I to III, where the flow acceleration is mainly caused by thermal expansion,  $C_f$ decreases slightly near the inlet due to the reduction in dynamic viscosity, which is in agreement with the distribution of pressure drops. For case II, the reduction in
 $C_f$ near the inlet is end at approximately
 $x/d = 30$, and subsequently increased because of a steeper mean velocity gradient near the wall due to flow acceleration in the streamwise direction. For case C, where the flow acceleration effect is strongest among all the cases considered, a quick increase in
 $C_f$ is observed from the inlet. The local skin friction coefficient at the downstream region varies significantly, which indicates that the turbulence dynamic is significantly affected by the flow acceleration and the various properties in the micron-scale tube.
Undoubtedly, the developing turbulence due to acceleration is strongly associated with heat transfer and hydraulic resistance characteristics. Studying the mechanism of such turbulence development has not only academic significance but also great practical engineering value. Thus, we proceeded to make a diagram of the different stages of the flow. Figure 10 illustrates a framework for the present analysis of the typical simulation. The initial turbulence at the inlet  $x/d = 0$ is fully developed by a turbulence generator with periodic boundary conditions. Beyond that, a steep velocity gradient is formed by flow acceleration. It is reasonable to begin by dividing region I in the neighbourhood of the inlet, believing that the flow in this region still remains turbulent, similar to the initial turbulence. Region II is defined as a transitional region, where the turbulence kinetic energy continues to decrease. Region III far downstream represents the completion of the reversion, which is identified by specifying the degree to which the Reynolds stresses are negligible. In this region, the velocity fluctuations inherited from the previous history may have remained, but no new vortical structures are generated, which in such circumstances could be claimed that to have reached a quasilaminar state. Finally, in region IV, retransition occurs in the high Reynolds flow. This framework provides an overall picture of the development process that largely describes the simulation observations of the acceleration turbulence at supercritical pressure. A more quantitative and detailed investigation is conducted based on the specific physical mechanisms in these regions.
Diagram of the flow situation considered, with a preliminary division into different stages.

3.2. Statistics of thermophysical properties
The analysis in the previous section shows that for heat transfer by turbulent convection of a fluid at supercritical pressure in a heated micron tube, the pressure drop along the streamwise direction is significant. The effect of the pressure drop has a key role in terms of heat transfer and turbulent dynamics, referred to as both a direct effect in the governing equations and an indirect effect on the thermophysical properties. Since the pressure drop driven flow acceleration in high inlet Reynolds number cases I–III could approximately be ignored according to § 2.1, cases I–III considering the pressure change as well as the contrast case III-0 with constant pressure were selected to analyse the thermophysical property influence.
In the simulation cases, the fluid was heated by the wall heat flux, and the fluid in the near wall region was rapidly heated above the pseudocritical temperature. Thus, the fluid density and viscosity were reduced significantly, and the Prandtl number and specific heat capacity of the fluid peaked near the pseudocritical temperature. Figure 11 shows the instantaneous distributions of the Prandtl number, density and dynamic viscosity in the varied pressure case III and constant pressure case III-0. Drastic variations in thermophysical property values are observed in the cross-section. Along the radial direction, the low-density/low-dynamic-viscosity fluid and the high-density/high-dynamic-viscosity fluid mixes strongly, which indicates the significant turbulent motion near the wall. Moreover, the low-density area in case III is larger and more fully blended than in case III-0 considering the pressure change influence on the property, which is quantitatively analysed in figure 12.
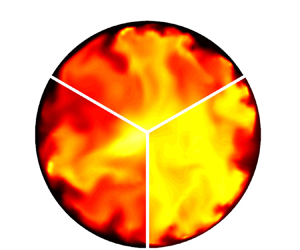
Instantaneous values of thermophysical properties for case III (Vary-pressure, left) and case III-0 (Constant pressure, right) at the location where  $h_b^*= 3.435\times 10^{5}$ (
 $h_{pc}^*$ at 8.8 MPa). The upper third shows the density, the lower left shows the dynamic viscosity and the lower right shows the Prandtl number.

Radial profiles of mean thermophysical properties for vary-pressure cases and constant pressure cases. Black and red lines indicate results from vary-pressure cases I and III, respectively. Blue lines indicate results from constant pressure case III-0.

The distributions of the mean density, dynamic viscosity, specific heat capacity and Prandtl number for cases I, III and III-0 are shown in figure 12. The radial profiles of the density show that the density changes little along the flow direction for the low heat flux for case I. As the heat flux increases, the enthalpy difference along the flow direction increases; therefore, a significant density difference is observed in the axial coordinate. The three axial locations shown are equally spaced;  $x/d=66.4$ is the location where the heat transfer coefficient achieves the lowest value (see figure 7), and
 $x/d=105.8$ is the location where the bulk enthalpy
 $H^*_b$ achieves
 $H^*_{b,pc}$. According to the energy conservation law, for the same energy input, the enthalpy increase of supercritical pressure
 $\textrm {CO}_2$ in cases III and III-0 are the same. Therefore, as shown in figure 7, with the same local enthalpy, there is an obvious difference in the thermophysical properties in cases with variable and constant pressure. This indicates that the property variation with pressure change is non-negligible, i.e. the density variation is
 \begin{equation} {\rm d}\rho ={{ \left.\frac{\partial \rho }{\partial P} \right| }_{T}} {\rm d} P+{{\left.\frac{\partial \rho }{\partial T} \right| }_{P}}{\rm d} T, \end{equation}
where  $P$ denotes the thermodynamic pressure
 $P^{*(0)}$, and
 $T$ denotes thermodynamic temperature. From figure 10 we can see that
 $\textrm {d} P$ along the axial direction is non-negligible. The results verifies the assumption that the effect of pressure variation on the physical properties inside the micron tube could not be neglected. Due to the effect of the pressure drop along the flow direction, there is a difference between the local density and the local dynamic viscosity at the same enthalpy value, especially at the location where the fluid temperature crosses the pseudocritical temperature near the wall. The lower the pressure is, the lower the values of density and dynamic viscosity at the same local location, while the peak of specific heat capacity and Prandtl number moves towards the centre of the tube. Along the direction of flow, the pressure difference becomes larger, which in turn leads to a larger difference in physical properties.
Figure 13(a,b) shows the root-mean-square (r.m.s.) profiles of the density and dynamic viscosity fluctuations. The fluctuations presented in the high heat flux cases are found to be much larger than those in the low heat flux case. At the upstream location  $x/d = 22.7$, the largest normalized thermophysical property fluctuation intensity is 20 % for density
 $\rho _{r.m.s.}/\bar {\rho }$ and 18 % for dynamic viscosity
 $\mu _{r.m.s.}/\bar {\mu }$ for high heat flux case III. For low heat flux case I, the largest value of
 $\rho _{r.m.s.}/\bar {\rho }$ is 10 % while that of
 $\mu _{r.m.s.}/\bar {\mu }$ is 9 %, and the largest thermophysical property fluctuation intensities are almost unchanged along the flow direction. This is because for the low heat flux case, the pseudocritical point is always located in the laminar layer where the turbulence fluctuation is weak. However, for cases with large heat flux, the pseudocritical point moves towards the centre flow region, and the large values of the molecular Prandtl in the buffer layer as well as in the centre region with strong turbulence fluctuation contribute to locally more significant thermophysical property fluctuations. When the fluid temperature exceeds the pseudocritical temperature at
 $x/d = 105.8$, the molecular Prandtl number decreases and thus, the fluctuation of the physical properties becomes weaker again. The difference in fluctuation intensities at the same location between cases III and III-0 could be attributed to the change in the local molecular Prandtl number with the pressure drop.
Root-mean-square profiles of property fluctuations in cases I, III and III-0. Black and red lines indicate results from vary-pressure cases I and III, respectively. Blue lines indicate results from constant pressure case III-0.

The local steep pressure gradients lead to locally steep thermophysical property gradients, such as density and dynamic viscosity, as shown in figure 14(a,b). The difference between the bulk properties observed only is apparent while the pressure drop is significant downstream. The bulk density gradient as well as the local density gradient affects flow acceleration. The distorted profiles of the velocity field and the dynamic viscosity variation influences the turbulence shear stress and turbulence structures, thereby affecting turbulence production. The distributions of thermophysical properties in cases A–C are similar to those discussed for cases I–III.
Distributions of mean bulk thermophysical properties along the axial direction for vary-pressure cases and constant pressure cases. Black and red lines indicate results from vary-pressure cases I and III, respectively. Blue lines indicate results from constant pressure case III-0.

The thermophysical properties of the near-wall region have a direct or indirect effect on the generation of turbulence and the thickness of the thermal boundary layer. The direct effect refers to the influence on the heat transfer and turbulence production due to thermophysical property fluctuations. For example, the peak value of the specific heat capacity contributes to the strong ability of fluids to carry heat. The density and dynamic viscosity are also explicitly included in the expression of turbulent statistics, such as turbulence shear stress  $\overline {\rho {u_{x}''}{u_{r}''}}$ and viscous shear stress
 $\bar {\mu }{\partial {{u}_{x}}}/{\partial r}$. The variations in thermophysical properties directly influences the turbulence statistics. However, the indirect effect of thermophysical properties refers to the indirect consequences of the mean velocity profile caused by local flow acceleration or deceleration. The decrease in density or increase in dynamic viscosity along the flow direction aids the flow such that the profiles of the velocity field is distorted and thereby changes the gradient of the velocity, which is also called flow acceleration.
In the previous discussion, we compared the distributions of the mean profiles as well as the fluctuation profiles of the thermophysical properties for vary-pressure cases III and constant pressure III-0. Since the flow acceleration driven by the pressure drop was not significant in the corresponding inlet pressure and Reynolds number, it was concluded that the influence of pressure change considered was essentially presented in the reflected values of physical properties. Figure 15 shows the distributions of the mean local wall temperature and the local Nusselt number for cases III and III-0. For the case considering the pressure drop, the worst deteriorated point of flow heat transfer moves downstream, and the peak wall temperature is higher. However, the subsequent heat transfer recovery in case III is better than that in case III-0 after  $x/d=100$. The observation is attributed to the direct and indirect effects of thermophysical property variation due to the pressure change, as discussed in the following section.
Radial profiles of (a) the mean local wall temperature and (b) the local Nusselt number distributions along the axial direction for cases III and III-0.

3.3. Mean and instantaneous velocity fields
In this section, we discuss how the pressure change, thermophysical property variation and flow acceleration effects modulate turbulent flow. The changes in flow patterns under the acceleration of flows at supercritical pressure flows were investigated for both mean and instantaneous velocity fields. An apparent streamwise speed increase is found in the mean streamwise velocity profiles owing to the significant density gradient in both the centre and near-wall regions. For cases with low or high inlet Reynolds numbers, the flow acceleration attributes of the velocity profiles are flat and increase in magnitude, when compared with the velocity profile of the inlet flow. This is a consequence of density fluctuations due to the streamwise enthalpy increase across the pseudocritical point. The significant density drop in the bulk of flow causes bulk flow acceleration rather than local flow acceleration (see figure 16) in the near-wall region, which is in stark contrast to that due to the buoyancy effect. Notably, the mean strain rates  $\partial \overline {u_x}/ \partial r$ at the hot wall increases, while that in the centre flow region decreases during the initial acceleration phase.
Radial profiles of the mean streamwise velocity for cases A, B and III at different axial locations.

The instantaneous distributions of fluctuating velocities in both axial and wall-normal directions are presented in figure 17 across a spanwise span at  $y^+=19$ for cases A, B and III. For the former two cases, the inlet Reynolds number based on the tube diameter is 2600. In these two cases, a typical characteristic of low Reynolds number turbulent flow is observed at the inlet, where the contours of the streamwise fluctuating velocity shows random fluctuations with some weak streaky structures. As the flows accelerated along the streamwise direction, the streamwise velocity fluctuation is strengthened and forms more high- and low-speed streaks, which is similar to the boundary layer bypass transition processes from laminar flows. In the downstream, some isolated turbulent spots are observed in the accelerated flow after
 $x/d=120$, and in case B, the turbulence spots gradually fills the entire flow region similar to fully developed turbulence. In case III, the inlet Reynolds number is 3800, and the streamwise velocity fluctuations are generally stronger than those in low Reynolds number flows. Likely, the development of streamwise fluctuating velocities is continuedly enhanced in case III, and the turbulence intensity is significantly higher in the downstream than in the inlet.
Instantaneous distributions of the (a) streamwise momentum and (b) wall-normal fluctuating velocities for cases A, B and III along spanwise coordinates at the near-wall region ( $y^+=19$).

Figure 17(b) illustrates the development of the wall-normal velocity fluctuations along the flow direction. Unlike the streamwise velocity, the wall-normal velocity undergoes a process of decay followed by regeneration. For relatively low inlet Reynolds number cases A and B, the radial turbulent fluctuations almost disappear after the inlet development section. The ‘silent’ flow pattern continued until  $x/d=120$, and many turbulence spots appear abruptly when passing the monitoring line. In case III, a similar attenuation is observed in that the fluctuations of wall-normal velocity are relatively weak compared with those before
 $x/d = 10$ and after
 $x/d = 90$. This behaviour is related to changes in the turbulent kinetic energies and coherent structures during strong flow acceleration along the streamwise direction, indicating that the initial turbulence attenuation and regeneration.
The development of turbulent flow observed here is seen as a modulation of the flow acceleration for the initial turbulence. Streamwise velocity fluctuations are always present due to the significant mean velocity gradient in the axial direction and eventually lead to stronger turbulence in the high-speed flow downstream. Intriguingly, during the transition process, the wall-normal and spanwise (not shown here) fluctuating velocities significantly decline, which indicate that the streamwise vorticity might have disappeared during the modulation of streamwise acceleration.
Figure 18 shows the r.m.s. profiles of the streamwise and wall-normal velocity fluctuations. For case A, the wall heat flux is small, so the streamwise flow acceleration shown in figure 16(a) is not great. However, the wall-normal fluctuating velocities in the vicinity of the wall are enhanced after a period of decay, in agreement with the visualization in figure 18(b). As the heat flux increases, the pressure and temperature change of the bulk flow in case B are larger and lead to more significant flow acceleration. In comparison with  $u''_x$ in case A, the fluctuation decay is more severe in case B, but significant turbulence regeneration is observed after
 $x/d = 150$, which is not present in case A. That significant regeneration process is also observed in case III, in which the regenerated flow is more strengthened and disturbed because the initial flow Reynolds number and the velocity gradient in case III are larger and more significant. It is interesting to note that the maximum of the velocity fluctuations move to the hot wall and decrease in magnitude.
Root-mean-square profiles of streamwise (a) and wall-normal (b) velocity fluctuations for cases A, B and III at different axial locations.

In fact, the fluctuations of velocities are related to the coherent behaviour of the near-wall turbulent structures. As discussed in Zonta, Marchioli & Soldati (Reference Zonta, Marchioli and Soldati2012b), the streak characteristics were altered due to the variation in viscosity. Patel et al. (Reference Patel, Peeters, Boersma and Pecnik2015) stated that the stability of streaks was significantly affected by mean density and viscosity stratification. Combined with the findings of the authors in a previous study (Cao et al. Reference Cao, Xu, Yan, He and Jiang2021), the flow acceleration induced a stretch-to-disrupt mechanism of coherent turbulent structures and thus contributed to changes in the turbulent shear stress as well as the self-regeneration of near-wall turbulence. As a consequence, the variable properties and flow acceleration influenced the mean and instantaneous velocity fields. In fact, the fluctuating property itself dampenes the burst of streaks, although flow acceleration enhances the process in low-viscosity regions. The turbulence statistics and the near-wall turbulence structures are further discussed in the following section.
3.4. Turbulence statistics
Due to a dramatic variation in density with temperature and pressure, the profiles of streamwise velocity changed with both magnitude and gradient at different axial locations, resulting in the development of profiles of shear stresses. The total shear stress in the  $(x,r)$ section consistes of the viscous stress
 $\tau _{vis}=Re_{0}^{-1} \bar {\mu }{\partial \widetilde{u_x}}/{\partial r}$, the fluctuating viscosity stress
 ${{\tau }_{fluc}}=Re_{0}^{-1}\overline {{{\mu }^{'}}S_{xr}^{'}}$, and the turbulent stress
 ${{\tau }_{Re}}=-\bar {\rho }\widetilde {u_{x}^{''}u_{r}^{''}}$, where
 $S_{ij}$ represents the deviatoric stress tensor and
 $\mu '$ represents the dynamic viscosity fluctuation; notably, the scale of the second term is much less than the other two.
Thus, the fluctuating viscosity stress is negligible when analysing the profiles of the shear stresses. The developing profiles of both the viscous shear stresses and the Reynolds shear stresses are regarded as direct reflections of the velocity profiles. Figure 19(a–d) show the viscous stress as well as the turbulent shear stress for cases B and III. As the stresses directly scaled with the dynamic viscosity and density, the viscous stress and Reynolds shear stress shifted after the inlet in all cases. In the inlet region, the supercritical pressure fluids near the wall are quickly heated beyond the pseudocritical temperature, and consequently, the dynamic viscosity and density decrease abruptly in the near-wall region. Therefore, the changes in the shear stress profiles are attributed to the fluctuations of both dynamic viscosity and density. Since the Reynolds shear stress is an integral part of the generation of the near-wall turbulence, it is necessary to analyse the development of the profiles of Reynolds shear stress.
Viscous stress and Reynolds shear stress in cases B and III.

As the fluid temperature increases, the magnitude of density decreases, and the streamwise velocity profiles become flat due to acceleration (see figure 16). The turbulent shear stress declines significantly at  $x/d=0$–
 $120$, which means that less high-momentum fluid is transported from the bulk towards the wall, resulting in a smaller mean strain rate magnitude and thus a smaller wall shear stress. Although the mean strain rate magnitude at the wall increases slightly due to the flow acceleration, the significant decrease in dynamic viscosity at
 $x/d=0$–
 $20$ contributes to a significant decrease in wall shear stress at the very beginning. After
 $x/d=120$, the fluctuations of thermophysical properties at the near-wall region become small, and the magnitudes of dynamic viscosity remain a low level, but as the flow acceleration proceeds, the mean strain rate, especially in the buffer layer, recovered to some exceedance. Thus, the momentum exchange in the wall-normal direction is strong, and the Reynolds shear stress recovers to a high level. More high-speed momentum in the central region is transported to the wall; therefore, the mean strain rate magnitude at the wall recovered and the wall shear stress consequently increased. These results show that the mean profiles of both the dynamic viscosity and the density have an important influence on the viscous stress and Reynolds shear stress distribution. Compared with case III, which considers only thermal acceleration, case B, which is influenced by both pressure drop acceleration and thermal acceleration, shows a more severe decrease in Reynolds shear stress. In fact, the flow acceleration due to the pressure drop aggravates the deterioration of flow heat transfer, such as changes in total shear stress, production of turbulent kinetic energy and changes to turbulent structures. This is further discussed in subsequent sections.
The Reynolds shear stress is appreciably affected by thermophysical property variations and velocity profile stratification due to flow acceleration. Moreover, the magnitude of the turbulent kinetic energy is determined by the Reynolds shear stress and mean velocity profiles. Figure 20 shows the turbulence production and turbulent kinetic energy for case B. In addition to the increase in bulk velocity along the axial direction due to the decrease in a cross-sectional-average density, the bulk velocity also increases strongly due to a large pressure gradient. The developing profile of the streamwise velocity influence the Reynolds shear stress indirectly through the production  $-\overline {\rho {u}_{x}''{u}_{r}''}{\partial \widetilde {{{u}_{x}}}}/{\partial {{x}_{r}}}$, which is also the dominant term for turbulent production
 $P_k$. Strong reductions in both
 $\overline {\rho {u}_{x}''{u}_{r}''}$ and
 $P_k$ are observed during
 $30< x/d<120$. Correspondingly, turbulent kinetic energy
 $k$ reaches the minimum which means strong suppression of turbulence. This is where the flow is fully laminar and a local wall temperature peak is observed nearby. After that, the maximum axial gradient of density moves to the core region, while the acceleration slows at the near wall region and the mean strain rate at that region recovers. This results in a recovered Reynolds shear stress in the core and the production of turbulence. Notably, the peaks of the production of turbulence and turbulence kinetic energy move towards the wall as the flow accelerates. The initial turbulence intensities are modulated under the flow acceleration, and the behaviour is explained as a response of the pre-existing turbulence to the property variations and flow acceleration. In fact, the transient flow progress turns out to be the redistribution of the mean velocity and fluctuation fields in the turbulent boundary layer by the various thermophysical properties and pressure.
Distributions of turbulence production and turbulent kinetic energy for case B.

The changes in turbulence intensities are closely associated with the turbulent convective heat transfer characteristics. The stronger the turbulent mixing is, the greater the convective heat transfer capacity. When the turbulent kinetic energy reaches the minimum, the turbulence is significantly attenuated, and the convective heat transfer coefficient decreases to a large degree. Therefore, for the constant wall heat flux, the steep peak of the wall temperature appears near  $x/d=80$ (figure 6a) where local heat transfer deterioration occurs, and then the wall temperature drops dramatically as the turbulence kinetic energy regenerates. Figures 19(c) and 20(a) show that the turbulence production at
 $x/d=150$ is enhanced by approximately two times compared with the initial value, but the recovery of the Reynolds shear stress at
 $x/d=150$ is not as obvious. This suggests that the large mean strain rate makes an important contribution to turbulence regeneration. The mean strain rate
 $\partial \overline {u_x}/\partial r$ increases in the highly accelerated flow in the low-viscosity region near the wall but decreases upstream due to the high dynamic viscosity.
The turbulent structures are also of great importance to the production of turbulent kinetic energy since the formation of streamwise vortices and near-wall streaks as well as their instabilities are an integral to the self-regeneration process of near-wall turbulence. According to figure 20, the heat transfer deterioration occurs while the turbulent kinetic energy reaches a lower value but still remains significant in magnitude; however, the heat transfer capacity of turbulent flow shows the characteristics of laminar flow. In this paper, the term quasilaminar region refers to a region where no new vorticial structures are generated. This suggests that in the quasilaminar region, the decaying turbulence fluctuations might still be significant, but the self-regeneration of turbulence structures is disrupted, leading to attenuated turbulent mixing behaviour and consequently leading to the turbulence heat transfer deterioration. In the following discussion, we further investigate the effects on the turbulent structures in terms of the scale effect, thermophysical property variation and flow acceleration.
3.5. Turbulent structures
The fluctuations of wall turbulence are assumed to be generated by near-wall coherent structures. In the turbulent boundary layer, the maximum fluctuation velocity intensity occurs at approximately  $y^+=15$, while the maximum Reynolds stress occurs at approximately
 $y^+=30$, where the strip undergoes vibration and rupture. Thus, the bursting behaviour of wall turbulence is the mechanism that generates turbulent pulsations and Reynolds stresses. Therefore, in this section, we study the behaviour of turbulent structures to reveal the turbulence regeneration mechanism and identify the representative structures with a view to modifying the turbulence to achieve engineering goals such as enhancement of heat transfer and reduction of pressure drop.
The first important mechanism in the common characteristic coherent pattern is the streaks that occurs in the region  $0< y^+<10$. The effects of flow acceleration and variable properties on the steaks are investigated. The flow visualization in figure 21 reveals the streaks in the near-wall region (
 $y^+=8$). The figure clearly shows that the magnitude of
 $|(\rho u_x)'|$ remains significant along the acceleration process; however, the pattern of the streaks is obviously distorted in cases B and C, especially in the reverse-transitional and quasilaminar regions. In case B, the stratification of high-speed and low-speed streaks is evident at
 $x/d=80$, and the streamwise length of the streaks is obviously stretched (see figure 21b). Downstream at
 $x/d=120$ in case B, disorganized streaks appear again as the turbulence gradually regenerated. The change in the streaks morphology is more obvious in case C. Since the streaks are largely related to the turbulent shear stress, the above observations are consistent with our earlier observations in § 3.4. Low-speed streaks are believed to be traces of streamwise vortices; therefore, the change in the streak structure from disorganized to rarefied visually indicates the stages of turbulence flow (§ 3.1). For instance, in case B, the turbulent heat transfer deterioration occurs at
 $x/d=30$–
 $120$, showing a steep temperature peak, and recovers downstream as a result of turbulence regeneration.
Contour plots of the streaks  $(\rho u_x)'$ for case A, case B and case C at the near-wall region (
 $y^+=8$).

Notably, in the bulk accelerating flow, we found a different change in the structures of the steaks. However, in the most deteriorated stages, the streak structures do not decrease uniformly in the near-wall region as found by Peeters et al. (Reference Peeters, Pecnik, Rohde, Van der Hagen and Boersma2016). Under the effects of thermophysical property fluctuations, they appear intermittently as more significant large-scale structures. Therefore, we extracted the velocity profiles from individual streak realizations to quantitatively investigate streak motions. As illustrated in figure 22(a), the bold contour indicates the typical cross-section of the lifted streaks; the streamwise velocity profiles at different regions are discussed below. To evaluate the instability of streaks, we analysed the wavenumbers of the spanwise disturbances in accordance with Floquet theory,
 \begin{equation} \left( \begin{matrix} u' \\ v' \\ w' \\ p' \\ \end{matrix} \right)\left( x,y,z,t \right)=\text{Real}\left[ \left( \begin{matrix} \tilde{u} \\ \tilde{v} \\ \tilde{w} \\ \tilde{p} \\ \end{matrix} \right)(y,z)\exp({{\rm i}(\alpha x+\beta z)}){{\rm e}^{\sigma t}}\right], \end{equation}
where  $\alpha$ and
 $\beta$ are the streamwise and spanwise streak wavenumbers, respectively, with eigenvalues
 $\sigma ={{\sigma }_{r}}+i{{\sigma }_{i}}$. The complex eigenfunctions are periodic in the spanwise direction. As shown in figure 22(b), at the beginning of flow acceleration, high-frequency and large-magnitude periodic low-speed streaks are lifted from the wall. In this region, the wavenumber
 $\beta$ of the streaks and the strength of the lifted streaks are basically constant. However, as the flow acceleration proceeds, the flow velocity field distribution is distorted, resulting in decreasing mean strain rate and therefore decreasing Reynolds shear stress near the wall (see figure 19). The smaller mean strain rate means fewer low-speed fluids are transformed from the wall to the centre of the tube. Therefore, with this negative normal momentum exchange, the magnitude of the streaks is expected to decrease substantially, as the smaller wave crests show in figure 22(c). However, as the flow acceleration accompanies more significant positive streamwise velocity fluctuations in the flow centre, the high-speed fluid is transformed from the centre to the wall, contributing to new disturbances to the flow with a larger spanwise wavenumber
 ${{\beta }_{0}}$ superimposed on existing perturbations. At
 $x/d=171.85$, the perturbation order is re-established due to the recovery of the average deformation rate, which is consistent with the regeneration of the strips shown in the previous visualization.
Low-speed streak realization in the near-wall region: (a) 0.55  $U_0$ isosurface; (b–d) contour line of streamwise velocity
 $U_x$ at cross-stream section. The dashed lines in (c) denote the crests of the middle two streaks.

According to previous studies (Bae et al. Reference Bae, Yoo and Choi2005; Nemati et al. Reference Nemati, Patel, Boersma and Pecnik2015), it is necessary to define the momentum vorticity as  $\boldsymbol {\omega } =\boldsymbol {\nabla } \times (\rho \boldsymbol {u} )$ by considering the density variation for fluids under supercritical pressure. Figure 23 provides the distributions of instantaneous streamwise momentum vortices
 ${{\omega }_{x}}=( 1/r )( \partial ( r\rho {{u}_{\theta }} )/\partial r-\partial ( \rho {{u}_{r}} )/\partial \theta )$. To explain the perturbation vorticity generation mechanism, we derived the vorticity perturbation equations in the streak-vortex-line coordinate system
 $(x, n, s)$, where the
 $s$ and
 $n$ directions denote the tangent and normal directions to the base-flow vortex lines, respectively. By performing the coordinate system transformation, we significantly simplified the evolution equations for perturbation vorticity (Schoppa & Hussain Reference Schoppa and Hussain2002) to the following form:
 \begin{equation} \left.\begin{gathered} \frac{\partial \omega _{x}^{'}}{\partial t}+U\frac{\partial \omega _{x}^{'}}{\partial x}={{h}_s}\varOmega \frac{\partial u_{x}^{'}}{\partial s}+{{h}_{n}}\omega _{n}^{'}\frac{{\rm d} U}{{\rm d} n}=\varOmega \frac{\partial u_s^{'}}{\partial x},\\ \frac{\partial \omega _{n}^{'}}{\partial t}+U\frac{\partial \omega _{n}^{'}}{\partial x}+ {{h}_s}{{h}_{n}}\varOmega u_{n}^{'}\frac{\partial \left( 1/{{h}_{n}} \right)}{\partial s}= {{h}_s}\varOmega \frac{\partial u_{n}^{'}}{\partial s},\\ \frac{\partial \omega _s^{'}}{\partial t}+U\frac{\partial \omega _s^{'}}{\partial x}+ {{h}_s}u_s^{'}\frac{\partial \varOmega }{\partial n}+{{h}_{n}}u_{n}^{'} \frac{{\rm d}\varOmega }{{\rm d} n}={{h}_s}\varOmega \frac{\partial u_s^{'}}{\partial s}+ {{h}_s}{{h}_{n}}\varOmega u_{n}^{'}\frac{\partial \left( 1/{{h}_s} \right)}{\partial n}, \end{gathered}\right\} \end{equation}
where  ${{h}_s},{{h}_{n}},\varOmega$ are determined from
 \begin{equation} h_s^{2}={{\left( \frac{\partial n}{\partial r} \right)}^{2}}+{{\left( \frac{1}{r} \frac{\partial n}{\partial \theta } \right)}^{2}},\quad h_{n}^{2}= {{\left( \frac{\partial s}{\partial r} \right)}^{2}}+{{\left( \frac{1}{r} \frac{\partial s}{\partial \theta } \right)}^{2}},\quad \varOmega ={-}{{h}_{n}}\,{\rm d} U/{\rm d} n. \end{equation}
Contours of streamwise momentum vorticity  $\omega _x$ in case B: (a)
 $x/d=80$; (b)
 $x/d = 170$. Solid lines denote the contours of streamwise velocity at
 $\textrm {moment}=n$ s. Dashed lines denote the contours of streamwise velocity at
 $\textrm {moment}=n+10^{-6}$ s.

To understand the right-hand side of  $\omega _{x}^{'}$, we concluded that the generation of perturbation streamwise vorticity consisted of two tilting terms. By introducing the base-flow vorticity
 $\varOmega$ we further simplified the original tilting terms to one term
 $\varOmega {\partial u_s^{'}}/{\partial x}$. The sole generation term clearly explains the mechanism of
 $\omega _{x}^{'}$ generation by the mean shear motions, illustrating the vortex generation in both the quasilaminar and retransition regions due to significant flow acceleration. In the quasilaminar region, there is apparent local shear as the deformed near-wall streaks provide apparent high-speed and low-speed flow stratification. The vector of
 $u_s'$ is represented in the crest top. The initial
 $u_s'$ regions from the spanwise motion undergo shear deformation by the base flow shear
 $\textrm {d} U/\textrm {d} n$, resulting in the advection of
 $+u_s'$ to
 $-u_s'$. Consequently, a spanwise shear layer of
 $u_s'$ is generated, which is the form of streamwise vorticity perturbation
 $+\omega _{x}^{'}$ in the region where
 ${\partial u_s^{'}}/{\partial x}$ is negative and symmetrically
 $-\omega _{x}^{'}$ is generated in the region where
 ${\partial u_s^{'}}/{\partial x}$ is positive. Notably,
 $u_n'$ is extremely small in this region, resulting in the restrained generation of
 $\omega _{n}^{'}$, which is dominated by
 ${{h}_s}\varOmega {\partial u_{n}^{'}}/{\partial s}$. Subsequently, the
 $+\omega _{x}^{'}$ generated is further advected under the bottom of
 $-\omega _{x}^{'}$, resulting in
 $z$-elongated sheets of
 $\omega _{x}^{'}$, as shown in the figure. Downstream at
 $x/d=170$, in addition to the
 $\omega _{x}^{'}$ generation due to mean shear, the magnitude of
 ${\partial u_{n}^{'}}/{\partial s}$ is large compared with that at
 $x/d=80$, resulting in the recovered generation of
 ${{h}_s}\varOmega {\partial u_{n}^{'}}/{\partial s}$ and hence of
 $\omega _{n}^{'}$ and
 $\omega _s^{'}$.
The vorticity distribution also corresponds to the flow region due to the inherent disturbances to the vorticity structures of the corresponding streaks. During the region where the streak disturbances are normal in regions I and IV (see figure 10), and the spanwise wavenumber is large and successive, vorticity perturbations are also generated in the normal mode. However, the perturbations are susceptible to accelerated flow velocity profiles. As the velocity profiles are distorted, the original streak perturbations decay fast, changing the dominant perturbation to high-speed bulk flow transformed to the wall. The new perturbation mode eventually evolves into the generation of streamwise vorticity due to tangential shear and the attenuation of the other vortices. This kind of unstable mode is temporary in the heated turbulent flow at supercritical pressure since the highly accelerated flow will retransition to full turbulence in the downstream low-viscosity region. In the retransition region, in contrast to the quasilaminar region, the generation of turbulent structures recover to a large extent, even beyond the initial turbulence.
We further investigated the integrated vortical structures by the Q criterion to visually illustrate the dynamics of the development of turbulence. The Q criterion is defined as the second invariant of the velocity gradient  $Q=0.5( S_{ij}^{2}-{s_{ij}}{s_{ji}}-{{W}_{ij}}{{W}_{ij}} )$, where the strain rate tensor is
 ${s_{ij}}=0.5( {{A}_{ij}}+{{A}_{ji}} )$, the skew-symmetric rotation rate tensor is
 ${{W}_{ij}}=0.5( {{A}_{ij}}-{{A}_{ji}} )$, and the velocity gradient tensor is
 ${{A}_{ij}}=\boldsymbol {\nabla } \boldsymbol {u}$. Figure 24 shows the evolution of vortical structures for cases A–C at three different locations
 $x/d = 10$, 80, 120. As clearly shown, the vortical structures in the first column at left are intensive in the original turbulent region. The turbulence laminarization is revealed by the reduction in the strength of vorticity motions. For the quasilaminar regions, such as
 $x/d\approx 80$, the vorticity motions become so weak that the isosurfaces are sparse. More specifically, the coherent hairpin vortex with a large-scale is strongly inhibited to almost invisible due to the flow acceleration effects discussed before. Note that there remains some long finger/stick-like structures (also several spanwise prolate structures) corresponding to the generation mechanism of streamwise vorticity in this region. The high-shear heads of the hairpin vortex are partly destroyed, resulting in less coherent behaviour. Subsequently, in the retransition region, large-scale vortex sheets regenerated, evolving more eddies and therefore the coherent behaviours produces strong turbulent fluctuations.
Temporal evolution of vortical structures for case A (a–c), case B (d–f) and case C (g–i) at times  $x/d = 10$, 80, and 120 in (a,d,g), (b,e,h) and (c,f,i), respectively. The vortical structures are identified by isosurfaces of
 $Q = 0.001$ for all cases.

3.6. Additional effects
3.6.1. Scale effect
Owing to the scale effect of the micron pipe, the dimensional viscous stress  $\overline {{{\mu }^{*}}}{\partial \widetilde {{{u}_{x}}^{*}}}/{\partial {{r}^{*}}}$ in the viscous layer was much greater than that in the tubes with millimetre diameters. Figure 25 shows the effect of scale on the magnitude of the wall shear stress of turbulent flow at supercritical pressure in vertical tubes. As the figure shows, the wall shear stress in the micron tubes with diameter 0.0992 mm is approximately two orders of magnitude larger than that in tubes with diameters
 $1$–
 $3$ mm, which contributes to a larger frictional pressure drop. The scale effect also has a significant influence on the generation of wall vortex structures for wall turbulence. The scale of the near-wall structure of wall turbulence is inversely proportional to the magnitude of the friction velocity. Cantwell (Reference Cantwell1981) obtained the characteristic parameters of the coherent structure of wall turbulence. For example, the average width of the bottom steaks of wall turbulence was 100
 $\nu /{{u}_{\tau }}$, in which the friction velocity is
 ${{u}_{\tau }}=\sqrt {{{{\tau }_{w}}}/{\rho }}$.
Wall shear stress of turbulent flow at supercritical pressure in vertical tubes with different diameters. Black and purple dots denote results in tubes with  $D^*=3.0$ and 2.0 mm, respectively, from DNSs by Bae et al. (Reference Bae, Yoo and Choi2005). Red dots denote results in tubes with
 $D^*=1.0$ mm, from Cao et al. (Reference Cao, Xu, Yan, He and Jiang2021). Blue dots denote results from the present study, for tubes with
 $D^*=0.0992$ mm.

The turbulent structure behaviour is a key component in the process of turbulence generation. The DNS results revealed that the turbulent coherent structures of accelerating turbulent flow in micron tubes are influenced to distort and even disappear in the quasilaminar region. The structures of the long and narrow low-speed stripes and the short and wide high-speed stripes structure are shown in § 3.5. It directly influences the turbulent mixing motion and convection heat transfer ability. In micron tubes, the average width of the bottom steaks is expected to be one order of magnitude smaller than that in large-scale tubes. Figures 26 and 27 show the details of the characteristic parameters of the turbulence coherent structures obtained from DNSs. Typical vortex structures are shown in contours in the micron tube in the initial turbulent region. Isosurfaces of streamwise vorticity  $\omega _x$ and spanwise vorticity
 $\omega _r$ at levels
 $>+0.6\omega _i|_{max}$ and
 $<-0.6\omega _i|_{max}$ are shaded in red and blue, respectively. The threshold value of
 $0.6\omega _i|_{max}$ is chosen according to Schoppa & Hussain (Reference Schoppa and Hussain2002), who provided a comprehensive understanding of the generation mechanism of near-wall vortices. Limited to the micron radial scale, the dimensional scale of the boundary layer is very small, leading to a thin but strong shear layer along with quadrant Reynolds stresses and especially large-scale turbulence structures at the near-wall region. As shown in figure 26(a,b), the streamwise vortices generated in the initial turbulence in the micron tube are visualized and the dimensional scale is calculated at different radial locations. Apparently, the vortex generation mechanism is inherently three-dimensional, as it is intensely stretched in the streamwise direction with a significant gradient
 $\omega _x\partial u/\partial x$, and tilting and convection terms are necessary. The micron-scale magnifies the effects of the wall with curvature. Due to the complexity of the vortex structure in the flow field, the vortex shape in the transient flow field obtained by visualization is not a regular circle and exists eccentricity. To quantitatively analyse the distribution of the vortex scale, the network lattice method is used in this study to approximately characterize the scale of the vortex. The number of normal detection lattices multiplied by the edge length is taken as the normal width of the vortex structure. The schematic diagram for calculating the mean diameter of the vortex is given in the subfigure, and the average width
 $D^+=Du_\tau /\nu$ results are shown in figure 26(b). The average width of the prograde vortex is shown in the solid label and line, and in the hollow label and line of the retrograde vortex. For both the prograde vortex and retrograde vortex, the width increases and then decreases along the non-dimensional wall distance and shows a local maximum at
 $y^+\approx 30$. Notably, the width is defined as the wall-normal length of the vortex, and the width of the streamwise vortices in the centre region is approximately
 $\sim 70~\nu /u_\tau$ wide. and it is clear that the streamwise vortices are narrow than the typical wall-normal length of vortex
 $100\nu /u_\tau$ in the centre region for wall turbulence in normal-scale channels.
Characteristic parameters of the turbulence vortices were obtained from direct numerical simulations. (a,b) Schematic diagram and scale of streamwise vortex, respectively. (c,d) Schematic diagram and scale of wall-normal vortex, respectively. Here: (a)  $\omega _x$; (b)
 $D^{+}\ of\ \omega _x$; (c)
 $\omega _r$; (d)
 $H^+\ of\ \omega _r$.

Characteristic parameters of the near-wall streaks were obtained from direct numerical simulations. (a,b) The scale of typical near-wall streaks at  $y^+=5$ in micron tube based on autocorrelation analysis of the velocity of flow direction pulsation. (c) Qualitative description of burst events with scale effect. (d) Distribution of
 $-u'v'$ at
 $y^+= 30$.

The same method is used to calculate the average wall-normal height  $H^+$ for spanwise vorticity, as shown in figure 26(c,d). The width of the near-wall spanwise vortices at
 $y^+=30$ is approximately
 $15$–
 $20\nu /u_\tau$, which is coincident with a previous study (Cantwell Reference Cantwell1981). However, the average height in the centre region decreases to some extent, which means that the near-wall spanwise convection to the centre region is limited. The streak width at
 $y^+=5$ is studied and compared in regions I and II using the autocorrelation method on the streamwise velocity fluctuations. In the initial turbulence region, the width of the streak is
 $100\nu /u_\tau$, which does not differ much from that in a regular diameter channel. The high-speed streak width in the quasilaminar region is approximately
 $150$–
 $160\nu /u_\tau$, bigger than that of the initial turbulence flow. This is attributed to the new perturbance mode induced by the distorted velocity profiles as discussed in § 3.5.
The scale effect on the coherent structures in the figures further influences the underlying mechanism of the burst events. The burst events occurring in the near-wall region are the dominant processes producing turbulent fluctuations and Reynolds stress. As seen in the quadrant analysis of Reynolds stress and the comparison of burst event strengths, the velocity fluctuations in the radial direction are very different from those in conventional tubes, which is where the effect of wall curvature takes effect. More specifically, observations of  $-\overline {u'v'}$ Reynolds stress events of quadrant Q4 (sweep,
 $u' > 0$;
 $v' < 0$) make more contributions to Reynolds stress than the quadrant Q2 (eject,
 $u' < 0$;
 $v'> 0$). The Reynolds stress events of quadrant Q4 contributed 60 % of the magnitude of the Reynolds stress. That is opposite in the normal-scale tubes, where at
 $y^+=30$ the Q2 events are expected to contribute 70 % of the magnitude of the Reynolds stress while the Q4 events are expected to contribute approximately 30 %. The results indicate the prominent role of the specific turbulence generation mechanism in accelerating turbulence in micron tubes and suggest promising robust control of drag and heat transfer considering the same conditions.
3.6.2. Mean pressure gradients
According to the prior analysis, the effects of mean pressure gradients on turbulent dynamics could be large in micron tubes. Due to the negative density gradient along the streamwise direction ( $\textrm {d}\rho /{\text{d}\kern 0.06em x}<0$) and frictional pressure drop, the negative pressure gradient (
 $\textrm {d} P^{*(0)}/{\text{d}\kern 0.06em x}<0$) is large in the micron tubes. In engineering applications, the negative pressure gradient is favourable more often than not. For example, on the forward part of an airfoil, the negative pressure gradient contributes to the streamwise flow. The negative streamwise pressure gradients and density gradient together cause the mean streamwise velocity profile to steepen. In the constant low-viscosity region, the skin friction coefficient
 $C_f$ increases (see figure 9c), resulting in increasing pressure gradients. A sufficient negative pressure gradient can cause the boundary layer to relaminarize (Narasimha & Sreenivasan Reference Narasimha and Sreenivasan1973). As a consequence, for the cases considered in this study, turbulence relaminarization is attributed to the pressure-driven and property variation-driven contributions. For supercritical pressure cases in our simulation, the first part is considered in all cases, and the second part is considered differently, as the pressure influence on the properties is obvious in low inlet pressure cases but ignored in high inlet pressure cases. This influence is illustrated quantitatively by the isothermal compression coefficient in different cases. The effects of the flow acceleration are more significant at relatively lower pressures close to pseudocritical and lower inlet Reynolds numbers. For the second kind of case, flow acceleration is partly driven by the mean pressure drop. According to the previous discussion, the pressure drop driven flow acceleration has a stabilizing effect on the perturbation of the turbulent flow, which suppresses the turbulent mixing heat transfer process in the boundary layer; thus the heat transfer is reduced. This understanding will help in the design of better heat transfer models by considering the mean pressure gradient, such as Nusselt number relationships and turbulence models.
4. Conclusions
The characteristics of turbulent heat transfer to supercritical pressure CO $_2$ flowing in heated micron tubes were investigated with DNS in this study. Due to the very large temperature and pressure gradients along the flow direction, significant flow acceleration and variable thermophysical properties were induced in micron tubes, which influenced the corresponding turbulent dynamics as well as the heat transfer performance. Comparing the cases with the pressure drop and constant pressure, the worst deteriorated point of flow heat transfer moved downstream, and the peak wall temperature was higher. Considering the change of pressure, the deviation on temperature distribution because of physical properties was more than 10 K. The physical mechanism of the heat transfer deterioration phenomena under the effects of flow acceleration and variable thermophysical properties was investigated. Unlike the well-known buoyancy-caused heat transfer deterioration, the maximum deterioration of heat transfer was found to occur in a region of reduced turbulence regardless of the flow direction. Farther downstream where the highly accelerated turbulence generation mechanism was restored in the low-viscosity region, turbulent heat transfer was gradually recovered.
To reveal the underlying association between turbulence intensities and heat transfer characteristics, flow development under continuous flow acceleration was divided into four regions. The shear stress at the near-wall region had a the prominent influence on production of turbulence. The mean strain rate  $\partial \overline {u_x}/\partial r$ increased in the highly accelerated flow in the low-viscosity region near the wall but decreased upstream due to the high dynamic viscosity. And the developing profile of the streamwise velocity influenced the Reynolds shear stress indirectly through the production
 $-\overline {\rho {u}_{x}''{u}_{r}''}{\partial \widetilde {{{u}_{x}}}}/{\partial {{x}_{r}}}$, which led to decreased production of turbulent kinetic energy and structures in regions II and III. In region IV, the recovered generations of mean shear and perturbation vorticity contributed to retransition in the high Reynolds flow. Flow acceleration accompanied more significant positive streamwise velocity fluctuations. Since the formation of streamwise vortices and near-wall streaks as well as their instabilities were an integral part of the self-regenerating process of near-wall turbulence, the generation of turbulent structures generation scenario was further studied to explain the attenuated turbulence.
Notably, in the bulk accelerating flow, we observed a different change in the structures of the steaks. However, in the most deteriorated stages, the streak structures did not decrease uniformly in the near-wall region, and instead appeared intermittently with more significant large-scale structure. The high-speed streak width in the quasilaminar region was approximately  $150$–
 $160\nu /u_\tau$. The high-speed fluid was transformed from the centre to the wall, contributing to a new disturbance scenario of the flow with a larger spanwise wavenumber superimposed on existing perturbations. In the region where the streak disturbances were normal in the original turbulence and the spanwise wavenumber was large and successive, the generation of vorticity perturbations also occurred in the normal mode. As the velocity profiles were distorted, the original streak perturbations decayed fast, forming a new perturbation mode that enabled the generation of streamwise vorticity due to tangential shear and the attenuation of other vortices. The initial
 $u_s'$ generated from the spanwise motion underwent shear deformation by the base flow shear
 $\textrm {d} U/\textrm {d} n$ maintained the generation of perturbation streamwise vorticity in the quasilaminar region. More specifically, the large-scale coherent hairpin vortex was strongly inhibited to be almost invisible due to the flow acceleration effects. There were some long finger/stick-like structures (also several spanwise prolate structures) corresponding to the mechanism of generation of streamwise vorticity in the quasilaminar region.
Further investigation of additional effects in micron tubes was conducted to support the possibilities of inhibiting the deterioration of heat transfer. The effects of mean pressure gradients on turbulence dynamics can be large in micron tubes. A sufficient negative pressure gradient caused the boundary layer to relaminarize. The scale effect inhibited the vortex advection and lifted motion to the centre region, resulting in a vortex compressed in the wall-normal direction. As a consequence, the related burst events showed a different pattern compared with turbulence in normal-scale tubes. We revealed that the Reynolds stress events of quadrant Q4 contributed 60 % of the Reynolds stress, greater than those of quadrant Q2 to the Reynolds stress due to scale effect.
Funding
This project was supported by the Key Project Fund from the National Natural Science Foundation of China (no. U21B2056).
Declaration of interests
The authors report no conflict of interest.



