Implications
Understanding the temporal trajectories of livestock systems could steer livestock systems towards sustainable development. Our approach provides information regarding the factors that have shaped the systems’ current intensification patterns, which can be used to examine how policy incentives might influence these factors to achieve desirable long-term changes. The information generated in this study is relevant to decision-makers, as it focuses on the level at which agricultural issues and natural resources are managed, and on the level at which the different livestock systems are combined.
Introduction
The global livestock sector currently faces the significant challenge of increasing production in response to a rapidly growing demand while minimising adverse environmental impacts and pressures on natural resources (Godfray et al., Reference Gerber, Uwizeye, Schulte, Opio and de Boer2012; Gerber et al., Reference Garnett and Godfray2014). In the past, increased food production was achieved by a drastic intensification of production systems, which is a trend that is likely to continue (Thornton, Reference Thornton2010). Hence, concerns regarding environmental and ethical issues have fostered the concept of sustainable production intensification (Garnett and Godfray, Reference García-Martínez, Olaizola and Bernués2012).
In Europe, changing animal feeding patterns, such as the shift from diets primarily based on fodders and food wastes in the early 20th century to diets rich in concentrates in recent decades, were followed by changes in land use and the conversion of grassland to cropland (Potter and Lobley, Reference Peyraud, Taboada and Delaby1996; Mazoyer and Roudart, Reference MacDonald, Crabtree, Wiesinger, Dax, Stamou, Fleury, Gutierrez Lazpita and Gibon2006). These changes, which characterised the intensification process (Bouwman et al., Reference Beudou, Martin and Ryschawy2005; Lassaletta et al., Reference Krausmann, Haberl, Schulz, Erb, Darge and Gaube2014), also decreased the amounts of nutrients that were recycled within the livestock production system and increased the imports of protein feed concentrate. The factors underlying these changes have been identified including the economic influences (the rising demand for livestock products), technological considerations (advances in breeding and genetics, nutrition and disease; Thornton, Reference Thornton2010), and changes in land use (Alexander et al., Reference Alexander, Rounsevell, Dislich, Dodson, Engström and Moran2015). Their respective roles have likewise been qualitatively addressed, but they have not been hierarchised or simultaneously analysed to gain insight on intensification patterns. Thus, a broader, more comprehensive understanding of these patterns is needed to unravel the interplay between the driving factors, to rank their respective contributions and to explain the current configuration of the livestock sector. Understanding prior change patterns is useful in acquiring region-specific information that takes the particular regional context, history and the inertia of current trends into account, which could foster sustainable intensification strategies.
Previous studies of agricultural dynamics provided information on the drivers of agricultural change from different perspectives including the types of farming activities, time periods, geographical locations and levels of analysis. Mottet et al. (Reference Mazoyer and Roudart2006) studied changes in agricultural land use in the French Pyrenees from 1950 to 2003 and its drivers from a landscape perspective, whereas García-Martínez et al. (Reference Gambino2009) studied changes in cattle farming that occurred in the Spanish Pyrenees between 1990 and 2004. More recently, Ryschawy et al. (Reference Rosset and Altieri2013) identified pathways that enabled the survival of mixed crop-livestock systems in the French Coteaux de Gascogne region. Hazell and Wood (Reference Godfray, Beddington, Crute, Haddad, Lawrence, Muir, Pretty, Robinson, Thomas and Toulmin2007) reviewed the main drivers of change at the global, national, and local levels and listed the drivers by level, degree of importance and rate of change. These prior reports succeeded in presenting a detailed view of the changes that occurred in a specific area, mostly at the farm level. However, no prior studies account for the interplay of the multiple factors that drive the dynamics of livestock systems or the resulting consequences on intensification on large gradients.
Intensification can be seen as a process that increases land productivity by expanding input use per unit area (Shriar, Reference Shriar2000), or as the set of possible combinations of labour-, capital- and technology-related parameters that achieve a higher production per unit area. Therefore, intensification can be measured by the quantity of production per area or per animal as well as by the quantity of inputs per unit area or animal or by a quantity of input per unit product (Herzog et al., Reference Hazell and Wood2006; Temme and Verburg, Reference Temme and Verburg2011; Teillard et al., Reference Teillard, Allaire, Cahuzac, Léger, Maigné and Tichit2012). Changes in land can be classified into two types: (a) changes in land cover that alter the biophysical characteristics of the land via the expansion or contraction of a given land use type, such as the encroachment of cultivated crops into permanent grassland areas, or (b) changes in land use intensity accompanied by changes in the levels of socioeconomic inputs to the land (e.g. labour, feed resources or capital) and/or altered outputs per unit area and time, such as increased animal stocking rates (Erb, Reference Dolédec and Chessel2012).
Prior changes in livestock production were associated with technological progress related to animal nutrition, breeding and health (Thornton, Reference Thornton2010). Not only have these contributed to the intensification of the livestock sector, but also to high-yielding crop varieties and increased reliance on fertilisers, irrigation and agro-chemicals (Hazell and Wood, Reference Godfray, Beddington, Crute, Haddad, Lawrence, Muir, Pretty, Robinson, Thomas and Toulmin2007). Another important change was the specialisation of the livestock sector, with livestock populations growing or shrinking in certain regions (Neumann et al., Reference Mottet, Ladet, Coqué and Gibon2009). The combination of improved technology and socioeconomic and land use changes were important determinants of intensification and were directly reflected by productivity levels or stocking rates. However, the exact roles of these determinants in a variety of biophysical contexts over a period that is sufficient to capture significant changes remain unclear.
The objective of this study was to determine the effects of technical, land use and socioeconomic factors by analysing the intensification trajectories undertaken by the French livestock sector between 1938 and 2010. France is an interesting case study, because the French livestock sector strongly influences land use, occupying roughly 50% of the utilised agricultural area (UAA) in 2010 for fodder production and 14% for feed concentrate (Agreste, 2015). In terms of reared species, level of intensity, combination of production factors (land, labour and capital) and edaphoclimatic conditions, France has one of the European Union’s (EU) most diversified livestock sectors. We adapted the methods used to analyse farm dynamics and applied them to the department (a French administrative entity), which is a higher aggregation level, to gain insight into the factors that are driving the intensification process. Our analysis is based on quantitative data obtained for 88 French departments over nearly the past century, with the goal of identifying important changes in intensification and the drivers affecting the noted change.
Material and methods
Methodological approach main feature
To study changes in livestock production over time, we utilised the within-class principal component analysis (PCA) method developed by Dolédec and Chessel (Reference Darnhofer, Bellon, Dedieu and Milestad1987), which was designed to analyse the spatiotemporal changes in a given system and had previously been used to analyse changes in livestock farms (García-Martínez et al., Reference Gambino2009; Ryschawy et al., Reference Rosset and Altieri2013). The within-class PCA method enables a distinction to be made between the effects due to structural factors and the effects of time in change trajectories. Trajectory analyses emphasise changes over a long period, rather than the analysis of a select instant in time, which could yield a simplified view of reality. Our analysis was dynamic, and included a diverse set of variables (technical, land use and socioeconomic), which enabled us to capture important factors in the process of livestock production intensification.
Thus, French livestock systems serve as representative examples of the variety observed in Europe. A detailed description of the data compilation and the statistical analysis is provided in the following section.
Data series, sources and indicator selection
A large French livestock database was available at the department level (Territorial Units for Statistics 3 level NUTS3) (Cavailhes et al., Reference Bouwman, Van der Hoek, Eickhout and Soenario1987), which provided the unique opportunity to trace changes in the departments over long periods (years 1938, 1955, 1970 and 1980). A collation of more recent data from the agricultural census allowed us to extend the series through to 1988, 2000 and 2010 (Agreste, 2015). This extensive period ranging from 1938 to 2010 made it possible to capture major changes related to farm modernisation and the European Common Agricultural Policy (CAP) that occurred after WWII (Fearne, Reference Erb1997; Isoni, 2015). The initial database (Cavailhes et al. Reference Bouwman, Van der Hoek, Eickhout and Soenario1987) did not provide any estimates of pig or poultry production, which were mainly associated with subsistence farming from 1938 until the 1970s, reflecting the reduced importance of trade and the lack of statistics regarding the production of monogastrics. Nevertheless, we considered data on the population of monogastrics, which were available since 1938.
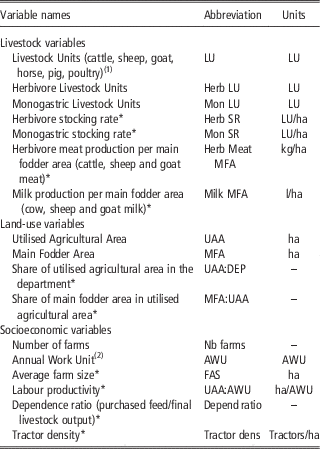
Data were organised into three categories of variables: land use, socioeconomic and livestock (Table 1). The land use variables characterised the relative importance of fodder and arable land in the departments and were used to rank the lands according to the area allocated to fodder production for livestock. The socioeconomic variables involved labour workforce availability, mechanisation, farm size and dependence on purchased feed. The livestock variables included population size and the stocking rate of herbivores (cattle, sheep, goats and horses) or monogastrics (pigs and poultry), as well as herbivore meat and milk production. Data were assembled in a table (D), composed of v continuous variables (v=10), d departments (d=88) and y years (y=7), so that each data point in D refers to a specific variable v, for year y and department d (Table 1). The table D was not shown in this paper because it is a long table, with 616 rows (88 departments×7 years) and 10 columns (10 variables).
Variables considered in the analysis of trajectories

* Variables used in the principal component analysis; (1), complying with Eurostat standard; (2), before 1970 accounts only for male workers, but after 1980 accounts for the work performed by one person on an agricultural holding on a full-time basis.
Statistical analysis of trajectories
The statistical analysis of the department trajectories included four major steps: PCA, between-class analysis, within-class analysis and a hierarchical cluster analysis (HCA).
First, PCA was performed on all data in table D to reduce the number of variables while maintaining the largest possible variance. We used the Kaiser criterion to select four factors with eigenvalues >1, which explained 80.9% of the total variance, and resulted in the generation of a new table (DN). Second, a between-class analysis and a within-class analysis were performed on table DN. The between-class analysis enabled the identification of the variables that had undergone the greatest change between the years, removing the effects of time, whereas the within-class analysis enabled the identification of the variables that had undergone similar changes within the years, which accounted for the effects of time. Third, we analysed the results of the within-class analysis using the Kaiser criterion to select three factors that explained 73.6% of the total variance between the departments’ trajectories. Fourth, a HCA based on the squared Euclidean distance and Ward’s aggregation method was performed on the three factors of within-class analysis and the typology of departments was generated based on their change trajectories. An ANOVA followed by the Tukey’s test was performed on HCA results to compare trajectory’s means for significant statistic difference at P<0.05. All statistical procedures, including the PCA, between-class analysis, within-class analysis, HCA, ANOVA and Tukey’s test, were performed using the R software package (R Core Team, Reference Potter and Lobley2015).
Results
General change trends
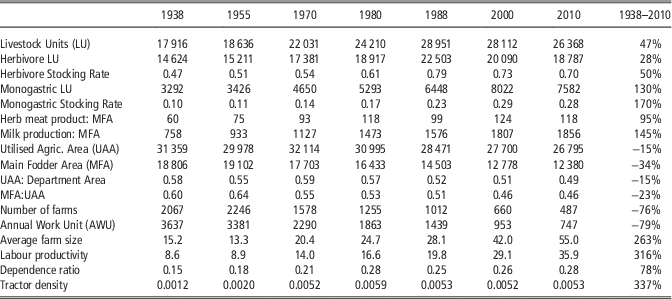
At the national level, the between-class analysis results reflected the major changes over study period. The most important changes in the livestock intensification process were observed in the socioeconomic variables, with a 4-fold increase in the indicators of mechanisation and labour productivity between 1938 and 2010 (Table 2). Further, tractor density rose from 0.0012 tractors/ha in 1938 to 0.0053 in 2010, and labour productivity increased from 8.6 ha per annual work unit (AWU) in 1938 to 35.9 ha in 2010. Table 2 also indicates a significant reduction in the number of farms, from two million in 1938 to 0.5 million in 2010, which contributed to farm enlargement.
National changes in livestock production, land use and socioeconomic variables in France’s 88 departments

See Table 1 for variable units.
Important gains were also detected in the livestock variables. The stocking rate of monogastrics increased ~170%, due to the rising population of monogastrics (+130%), which was concurrent with a slight reduction in the UAA (−15%). Conversely, the apparent increase in the herbivore stocking rate was much smaller (+50%). Milk production per unit of main fodder area (MFA) increased by a factor of 2.4, from 758 kg/ha to 1856 kg/ha over the period studied. Herbivore meat production per MFA roughly doubled, from 60 kg/ha in 1938 to 118 kg/ha in 2010, reaching peak production in 2000 (124 kg/ha) and returning to the 1980 level (118 kg/ha) by 2010. Increases in milk and meat production were mainly due to improved livestock performance in terms of meat and milk yield per animal, which was aided by a smaller but intensified MFA. The livestock sector relied more on external inputs in 2010 than in 1938, with the dependence ratio increasing by 78% over the period. This was partly due to a higher share of monogastrics in the total livestock population, rising from 18% to 28%, as monogastrics relied more on purchased feed concentrate than herbivores.
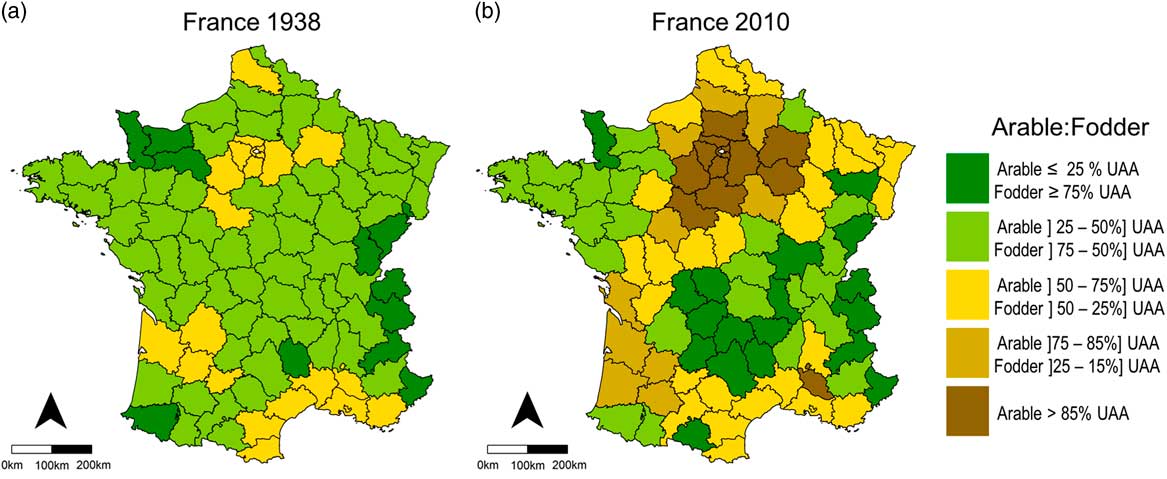
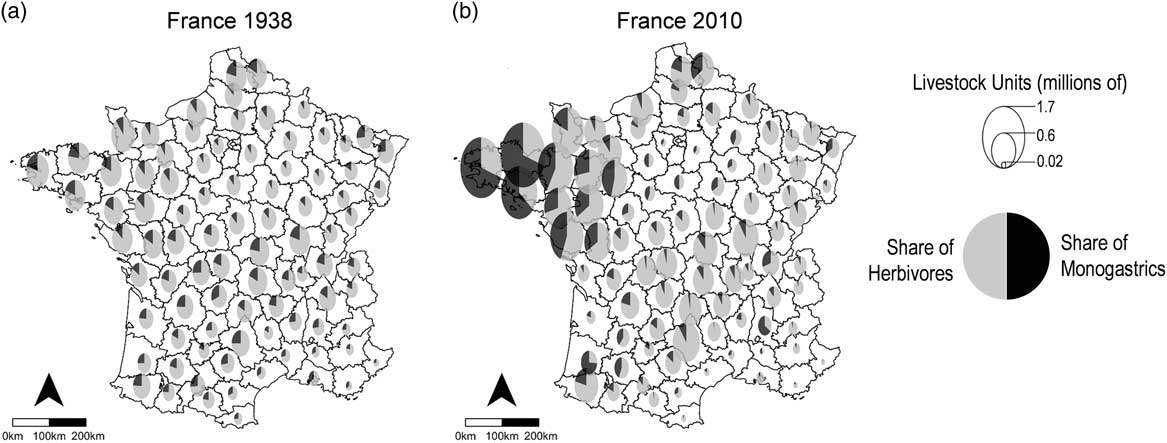
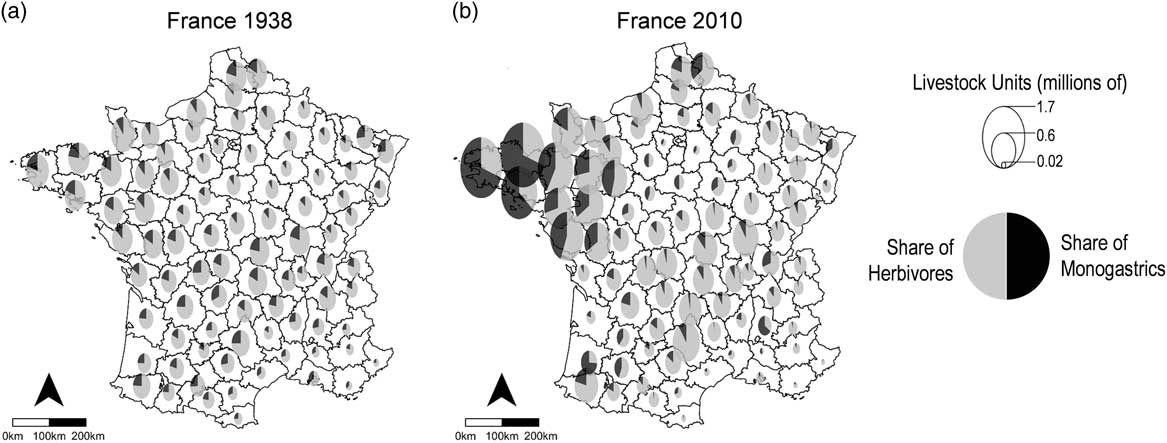
The results at the department level differed. In 1938, there was a close and local linkage between livestock and land use across the country, as 80% of the departments had allocated at least 50% of the UAA to fodder production (Figure 1), and livestock was present in all departments (Figure 2). In 2010, a more specialised pattern of land use was observed, with formerly dominant fodder land being cleared for cropland. Only 50% of the departments had allocated at least 50% of the UAA to fodder production (Figure 1), and the livestock population was concentrated in a limited number of departments located in the Western and Central areas of France (Figure 2). Combined, the two areas hosted ~80% of the national livestock population in 2010.
The evolution of land use in France at the department level from 1938 (a) to 2010 (b) in terms of arable crop and main fodder area in utilised agricultural area (UAA).

The changes in the livestock population of herbivores (cattle, sheep, goat, horse) and monogastrics (pig, poultry) and in the species composition over time in France at the department level from 1938 (a) to 2010 (b).
Trajectories of change at the department level
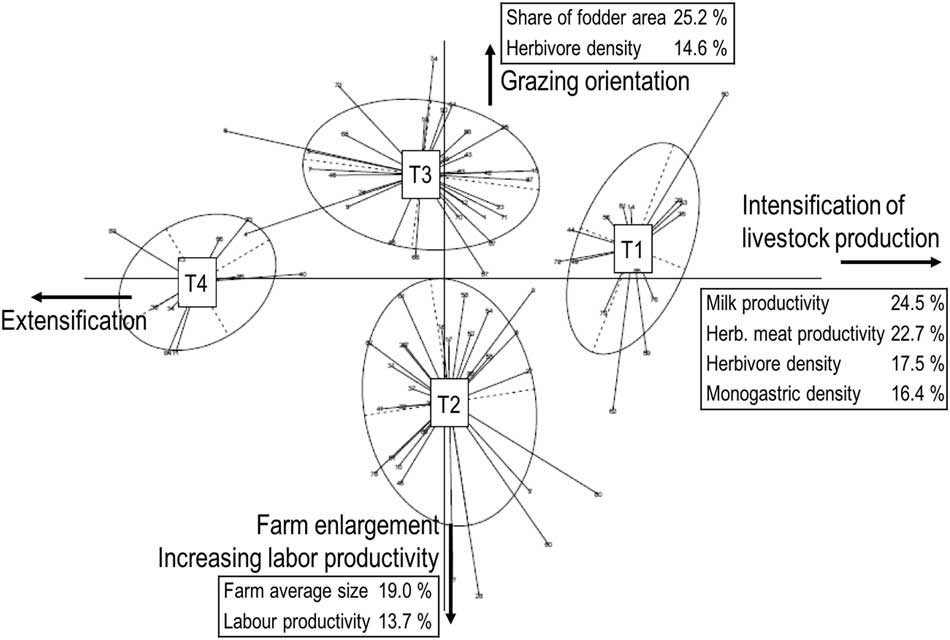
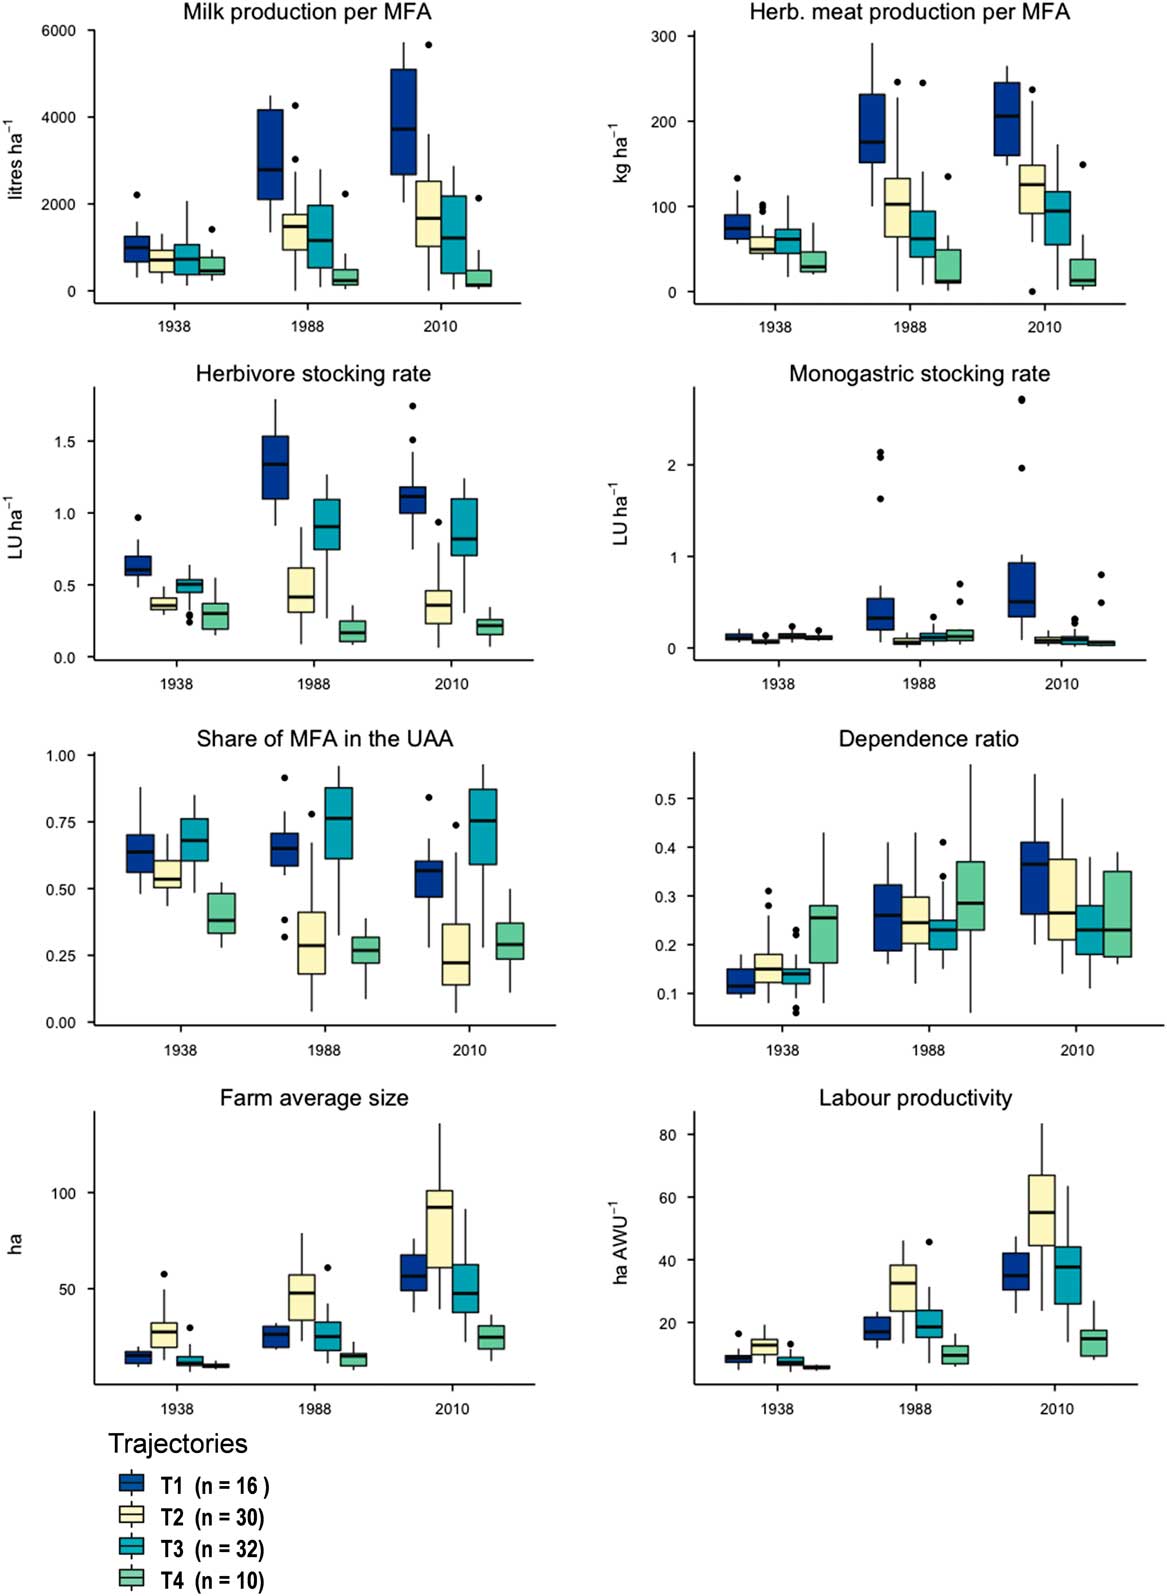
The within-class analysis conducted on data from the entire set of departments resulted in the identification of three factors with an eigenvalue >1. These factors explained 30.6%, 22.1% and 20.1% of the total variance, respectively. Factor 1 was primarily related to the combination of herbivore milk and meat production and the stocking rates of herbivores and monogastrics, and corresponded to a gradient in livestock production intensification, ranging from departments with high productivity and stocking rates to departments with a limited number of livestock. Factor 2 was generally positively related to the share of MFA and herbivore stocking rate, and negatively related to the average farm size and labour productivity, ranging from departments that emphasised grazing to departments that specialised in cropland. Factor 3 was mainly positively related to the dependence ratio and the monogastric stocking rate and negatively related to the share of MFA and herbivore stocking rate, ranging from a greater dependence on purchased feed and an increased monogastric population to a reduced dependence on purchased feed and a larger number of herbivores. The HCA carried out on these three factors identified four trajectories within the departments. Figure 3 shows the projection of these four trajectories on the first and second components of the within-class analysis. Figure 4 shows the projection of the trajectories on a NUTS3 level map of France. Figure 5 shows the quantitative changes in the selected variables for each trajectory. A table listing the quantitative changes in all variables is available in the Supplementary Table S1.
Projection of the four types of trajectories on the first and second components of the within-analysis after the hierarchical cluster analysis. Each trajectory is formed by individual departments with similar intensification trends. The main variables and their contribution to the component variance is presented for each trajectory. Component 1 explained 30.6% of the variance between the departments. Component 2 explained 22.1% of the variance.

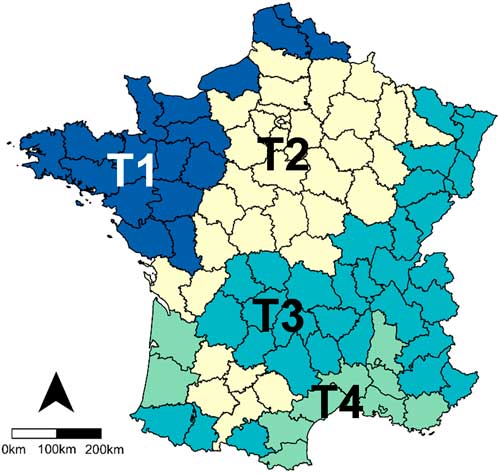
Location of the four intensification trajectories in France at the department level. T1, 2, 3, and 4 correspond to ‘high intensification of livestock production’, ‘crop orientation and intermediate intensification of livestock’, ‘grazing orientation of livestock production’ and ‘non-livestock dominated’ departments, respectively.

Trends of change observed in the French departments per type of trajectory. T1, 2, 3, and 4 correspond to ‘high intensification of livestock production’, ‘crop orientation and intermediate intensification of livestock’, ‘grazing orientation of livestock production’ and ‘non-livestock dominated’ departments, respectively.

The type 1 trajectory (T1; n=16) included the departments located in Western France that were characterised by the most intensive livestock production systems. The type 1 trajectory also exhibited the most significant increases in livestock numbers and productivity indicators, with the inherent animal populations and productivity more than doubling. Further, the most marked characteristic of this trajectory was the size of its population of monogastrics, which increased 6-fold from an average of 58 000 livestock units (LU) in 1938 to 344 000 LU in 2010. In 2010, T1 hosted 72% of the monogastric population in the country. The 7-fold increase in the monogastric stocking rate, from 0.12 LU/ha in 1938 to 0.84 LU/ha in 2010, was higher than the population growth due to the concurrent 15% decrease in the UAA. Important gains in productivity were achieved, with milk production per ha of MFA rising from 990 litres in 1939 to 3773 l in 2010. This productivity gain was nevertheless realised at the expense of the dependence ratio, which almost tripled and was the highest among all trajectories in 2010. The higher dependence ratio reflected a characteristic of very intensive systems such as in landless monogastric or dairy production that relied heavily on purchased feed. As well, a 9-fold increase in mechanisation was necessary to sustain the livestock demand for feed (maize cropping and haymaking). Such gains in mechanisation contributed to the 4-fold gain in labour productivity, which increased from 8.8 ha/AWU in 1938 to 35.6 ha/AWU in 2010.
The type 2 trajectory (T2; n=30) included departments located in the core and surrounding Parisian Basin that were characterised by crop or mixed crop-livestock systems. The T2 departments were primarily distinguished by the highest total increase in the average farm size and in labour productivity. Farm enlargement was followed by arable crop expansion over the MFA. There was a small decline in livestock units (−4%) over the period between 1938 and 2010, with a slight decrease in herbivores (−6%) and a concurrent small increase in monogastrics (+8%). In 2010, herbivore meat and milk production equalled 126 kg and 1736 kg/ha of fodder area, respectively, which corresponded to increases of 117% and 138% over the period, respectively.
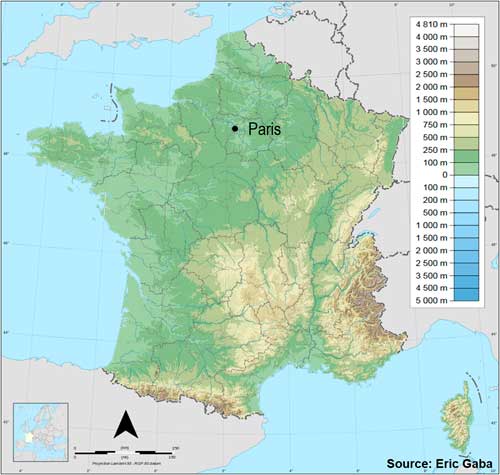
The type 3 trajectory (T3; n=32) included departments located in the East and central mountainous areas with an emphasis on grazing systems (Figure 6). Although trajectories T1, T2, and T4 lost MFA to crop land, T3 was the only trajectory that displayed a slight increase in MFA in the UAA (+5%). On average, MFA accounted for 73% of the UAA in 2010. The herbivore population underwent a 50% increase between 1938 and 2010, whereas the population of monogastrics declined by 35%. The emphasis on grazing relied predominantly on local fodder resources and was associated with a moderate increase in the ‘dependence ratio’ of 64% during the period compared with its 300% increase in T1.
Topographical map of France with an altitude gradient from light green for the plains to brown for the mountainous areas.

The type 4 trajectory (T4; n=10) included departments located in the Mediterranean and South-West regions, which experienced the highest UAA (−28%) loss rate, dropping from 226 000 ha in 1938 to 162 000 ha in 2010. In 2010, UAA accounted for 26% of the department areas, which was far below the country average of 49%, indicating the minor importance of agriculture in this trajectory. A 48% reduction in MFA, from 91 800 to 47 600 ha, was observed along with a halving of the herbivore population from 67 000 in 1938 to 34 100 LU in 2010. As well, the T4 trajectory had no significant emphasis on livestock production compared with the other trajectories. Livestock productivity was low and tended to decline between 1938 and 2010 with meat and milk production per ha of MFA falling from 39 to 32 kg and from 616 to 444 l, respectively.
Discussion
The interplay of biophysical and socioeconomic drivers in the intensification patterns
Our analysis revealed that the intensification of the French livestock sector was spatially differentiated and based on four different trajectories. The types 1 and 3 trajectories were characterised by a gradient in the intensification and specialisation ranging from intensive monogastric/herbivore stocking rates to extensive herbivore livestock production. The type 2 trajectory represented a specialisation towards crop production while maintaining a limited number of herbivores at an intermediate meat and milk production level. The type 4 trajectory exhibited the lowest livestock population and productivity levels.
Our work confirms prior studies from Peyraud et al. (Reference Neumann, Elbersen, Verburg, Staritsky, Perez-Soba, de Vries and Rienks2014), which indicated that biophysical factors emerged as the predominant drivers of intensification patterns in particular parts of France. We found that regions with marginal or mountainous land offered greater opportunities for developing grasslands and herbivore production (T3) compared with food crops, which were not profitable on this type of land. The regions containing better quality soils fostered the development of food crops (T2) as well as livestock diets based on arable crops (cereals and oil-protein crops). The abundance of crop products also enabled the development of monogastrics (T1). The apparent trend was in accord with patterns observed in Austria between 1950 and 1955 (Krausmann et al., Reference Kastner, Rivas, Koch and Nonhebel2003), with a concentration of cropland areas in the fertile lowlands and the predominance of livestock production in the lower alpine regions. Peyraud et al. (Reference Neumann, Elbersen, Verburg, Staritsky, Perez-Soba, de Vries and Rienks2014) also highlighted the interplay between agronomic potential and socioeconomic factors such as farm size, and reported the significant development of the livestock sector in Western France (Brittany), followed by a specialisation, which corresponds to our T1 trajectory, and a decrease in permanent grasslands giving way to annual crop production in the Northern France (Paris basin), which corresponds to our T2 trajectory.
The evolution of socioeconomic factors involved changes in the availability of labour in rural areas that occurred with the advent of mechanisation and the replacement of labour force by tractors, which played a critical role in determining farming orientation (crop v. livestock). The development of intensive livestock farming in Western France (Brittany) that began in the mid-20th century was made possible by a historically high rural population density, which provided the manpower for animal farming (Gambino, Reference Fearne2014). Another fundamental aspect includes the structural changes related to the labour opportunity costs due to competition with other sectors for labour force, which ultimately resulted in land abandonment (García-Martínez et al., Reference Gambino2009).
Our findings likewise support the trends reported by Veysset et al. (Reference Veysset, Bebin and Lherm2005) regarding farmer’s land cover choices in response to the economic and political environment. The EU CAP allowances and global markets favoured the development of arable crops, which ultimately encroached on the grasslands in departments with appropriate pedoclimate conditions (MacDonald et al., Reference Lassaletta, Billen, Grizzetti, Garnier, Leach and Galloway2000). In our study, similar trends were observed in trajectory T2 in which cropland replaced more than half of the initial area allocated to fodder. In the department trajectories located in marginal land, such as T3, the topography was mainly characterised by mountainous areas that were unsuitable for the development of arable crops (Figure 6). Hence, farmers maintained extensive grassland systems due to the lack of more rewarding opportunities. Xiao et al. (Reference Xiao, Mignolet, Mari and Benoît2015) also observed a reduction in grassland areas in France as a result of grassland-to-cropland conversion and the competition for land between agriculture and other activities, although the study covered a more abbreviated timeframe (1992–2010).
Interactions between department and country level
The way each department’s trajectory influenced the national trends depended on the type of variable considered (whether related to livestock, socioeconomic aspects or land use). These variables differed in magnitude and even changed in opposite directions from department to country level. The overall increase in livestock-related variables at the national level emerged as a result of heterogeneous patterns of change at the department level. Most of the increases in livestock production and productivity at the national level arose in departments that followed type T1 and T3 trajectories, and in which 80% of the livestock population in the country was concentrated in 2010. Socioeconomic variables exhibited the highest quantitative growth during the study period and the directions of change were similar at both the national and department levels. Land use variables also displayed a similar direction of change, with the exception of the share of MFA. The national declining trend on the share of MFA concealed various levels of decline among trajectories of departments and even the increase apparent in the T3 trajectory.
Hierarchisation of factors
French livestock production doubled between 1938 and 2010 due to important gains in farm size, mechanisation, labour productivity and the development of the monogastrics population; however, the contributing factors differed at the national and department levels.
At the national level, important gains were achieved due to socioeconomic factors (farm size, mechanisation and labour productivity) across the country. The apparent increases in farm size and labour productivity were in accord with prior reports by García-Martínez et al. (Reference Gambino2009) of the most important changes in the Spanish Pyrenees. The increased production was also dependent on escalating feed imports; thus, the land requirements for feed production were externalised (Chatzimpiros and Barles, Reference Chantre and Cardona2010). This was in accord with the trends observed in the livestock sector in Spain between 1900 and 2008 (Soto et al., Reference Soto, Infante-Amate, Guzman, Cid, Aguilera, Garcia and Gonzalez de Molina2016). Drivers, such as increased per capita income (Hazell and Wood Reference Godfray, Beddington, Crute, Haddad, Lawrence, Muir, Pretty, Robinson, Thomas and Toulmin2007), raised the associated labour costs and forced farmers to become more competitive. Thus, larger farms prevailed over small farms, which lead some farmers to abandon agriculture as a means of financial support. The trend in farm enlargement and increased labour productivity was observed in all trajectories, reflecting the substitution of labour by farm machinery, a development that was also noted by Rosset and Altieri (Reference Roguet, Gaigne, Chatellier, Cariou, Carlier, Chenut and Perrot1997) in North America. Our study might have overlooked important economic or policy drivers related to either markets or the political environment (e.g. farm structure, financial conditions, fertiliser-to-crop price ratio and policy support measures), which are also very important in the intensification and specialisation process (Veysset et al., Reference Veysset, Bebin and Lherm2005; Roguet et al., 2015; Zhang et al., Reference Zhang, Eric, Denise, Timothy, Patrice and Ye2015). An improved economic data set would be necessary to develop a predictive model to gain insight into the drivers of intensification and to determine their relative importance to global agriculture as proposed by Kastner et al. (Reference Isoni2012).
At the department level, the spatial differentiation of intensification trajectories was driven by the initial livestock population and the suitability of the land to the growth of arable crops based on topographic conditions. Previous studies also identified the importance of the initial production emphasis of farms (Mottet et al., Reference Mazoyer and Roudart2006; García-Martínez et al., Reference Gambino2009). Several land use change studies suggest the importance of land suitability (e.g. Nisar Ahamed et al., Reference Nisar Ahamed, Gopal Rao and Murthy2000; International Institute for Applied Systems Analysis (IIASA)/Food and Agriculture Organization (FAO), Reference Herzog, Steiner, Bailey, Baudry, Billeter, Bukácek and Bugter2012; van Zanten et al., Reference van Zanten, Mollenhorst, Klootwijk, van Middelaar and de Boer2016), which is an important indicator that measures the extent to which climatic, soil and topographic conditions determine whether and how land is used for agriculture. Future research on intensification trajectories should take into account land suitability for agriculture as it might continue to change due to changing climate (Zabel et al., Reference Zabel, Putzenlechner and Mauser2014).
Added-value and limitations of the proposed methodology
In this study, the choice of the department level and the use of an extended period of time spanning 72 years enabled a dynamic view of the intensification process and patterns of change within the livestock sector in France. Nonetheless, a finer-level analysis might reveal additional heterogeneity within the department level (Teillard et al. Reference Teillard, Allaire, Cahuzac, Léger, Maigné and Tichit2012). There is clearly a trade-off between assessing the process of intensification at a more aggregated level or at a finer resolution. On one hand, opting for the department level offered the advantage of a significant body of available data, and enabled a macro analysis covering a very large mixture of biophysical conditions. Conversely, a farm level analysis could provide a deeper understanding of the intensification process (Chantre and Cardona, Reference Cavailhes, Bonnemaire, Raichon and Delamarche2014), although the area would be limited, the process would be more time and resource-consuming, the costs would be higher (time and money) and the accuracy would be both questionable and limited, as indicated by retrospective interviews conducted by Ryschawy et al. (Reference Rosset and Altieri2013).
The statistical method we adopted provided additional insight into the dynamics of intensification and the interplay of factors leading to the current specialisation patterns apparent in the French livestock sector. This was clearly a methodological advance compared with prior studies, as it could capture the main changes in livestock production while providing a dynamic view and a long-term perspective over a period in which the socioeconomic context drastically changed. This knowledge and vision is essential to managing livestock farming systems, whether to maintain desirable aspects of intensification or to mitigate potentially negative impacts (Darnhofer et al., Reference Chatzimpiros and Barles2010).
This typology could also be used to support decision-making at the regional level as it provides a spatially differentiated assessment of intensification and highlights the technical, land use and socioeconomic variables that occur during the intensification of livestock production. This typology would likewise be valuable for studying the impacts of CAP reforms on livestock concentration and species balance (herbivores: monogastrics) and on the land use ratio (crop: grassland), as reported by Veysset et al. (Reference Veysset, Bebin and Lherm2005).
From a policy-making perspective, this typology could shed light on the transition of livestock farming systems. Based on quantitative data of changes that occurred over the past 70 years, the different trajectories revealed that intensification was a spatially differentiated phenomenon, suggesting that transitions will not occur in a homogeneous fashion. Further, our typology could serve as a tool for choosing differing regions in terms of livestock intensification (Beudou et al. Reference Ryschawy, Choisis, Choisis and Gibon2017). Finally, the different trajectories suggest the need for several strategies tailored to different contexts in the agroecological transition of livestock production.
Acknowledgements
The authors would like to thank the CAPES Foundation of the Ministry of Higher Education, Brazil, for the financial support provided to the first author for PhD training. We are also thankful to François Léger (AgroParisTech, Paris) for his invaluable insights on the history of livestock development in France.
Supplementary material
To view supplementary material for this article, please visit https://doi.org/10.1017/S1751731117003123