1. Introduction
The term ‘pseudotachylite’ refers to a dark-coloured, aphanitic rock similar in appearance to a glassy basaltic rock (tachylyte), but having a distinct tectonic origin (Shand, Reference Shand1916; Philpotts, Reference Philpotts1964; Francis, Reference Francis1972; Magloughlin & Spray, Reference Magloughlin and Spray1992). Although pseudotachylite is sometimes associated with fractures generated by large meteorite impact events (Reimold & Gibson, Reference Reimold, Gibson, Koeberl and Henkel2005; Melosh, Reference Melosh, Koeberl and Henkel2005) and during large landslides (Legros, Cantagrel & Devouerd, Reference Legros, Cantagrel and Devouerd2000), it mostly occurs as veins within rocks associated with fault and fracture zones and almost unfailingly indicates past seismic activity on these faults (Sibson, Reference Sibson1975; Shimamoto, Reference Shimamoto1989). This is why this somewhat unusual rock is of particular interest to geologists, geophysicists and seismologists, and has been extensively studied in the last few decades (Magloughlin & Spray, Reference Magloughlin and Spray1992; Ferré, Allen & Lin, Reference Ferré, Allen and Lin2005).
Pseudotachylite generation processes have been hotly debated for a long time. Although a majority of researchers agree that it is produced by frictional heat-induced melting of host rocks during rapid, seismic slip on a fault plane (McKenzie & Brune, Reference McKenzie and Brune1972; Sibson, Reference Sibson1975; Allen, Reference Allen1979; Maddock, Reference Maddock1983; Spray, Reference Spray1987; Magloughlin & Spray, Reference Magloughlin and Spray1992), some advocate a possible origin by ‘ultracataclasis’ without the involvement of a melt phase at any stage (Wenk, Reference Wenk1978; Wenk & Weiss, Reference Wenk and Weiss1982), while others suggest runaway ‘plastic instabilities’ as the source of melting (Hobbs, Ord & Teyssier, Reference Hobbs, Ord and Teyssier1986; White, Reference White1996). Magloughlin (Reference Magloughlin1992) and Spray (Reference Spray1995) have indicated that melting on a fault plane may be preceded by a phase of localized cataclasis, so that these two processes are not necessarily mutually exclusive. The frequent preservation of glass, vesicles and amygdules in pseudotachylite matrix led to initial suggestions that pseudotachylites are typically generated by melting during unstable frictional slip in a shallow crustal ‘elastico-frictional’ regime (Sibson, Reference Sibson1977), where pressure-sensitive frictional sliding is dominant. However, pseudotachylite layers intimately associated with deep-seated ‘plastic’ shear zone rocks (mylonite–ultramylonite) have subsequently been described from many locations around the world (Sibson, Reference Sibson1980; Passchier, Reference Passchier1982; Hobbs, Ord & Teyssier, Reference Hobbs, Ord and Teyssier1986; Koch & Masch, Reference Koch and Masch1992; Swanson, Reference Swanson1992; McNulty, Reference McNulty1995; Lin, Sun & Yang, Reference Lin, Sun and Yang2003), where there is unequivocal evidence that the pseudotachylite layers have undergone plastic deformation along with the host rocks and have sometimes been converted to ultramylonite. This has effectively extended the possible depth range for pseudotachylite generation, and has significant implications for our understanding of the seismic structure of the crust. Research on the ‘brittle-plastic’ transition in rocks at depth (Hobbs, Ord & Teyssier, Reference Hobbs, Ord and Teyssier1986; Strehlau, Reference Strehlau, Das, Boatwright and Scholz1986; Tse & Rice, Reference Tse and Rice1986; Scholz, Reference Scholz1988) has clearly demonstrated that there exists a zone of mixed ‘brittle’ and ‘plastic’ behaviour under constant strain rate (‘semi-brittle zone’, sensu Scholz, Reference Scholz1988) within the upper continental crust where rocks undergo lower greenschist-facies metamorphism (300–400 °C temperature; approx. 11–16 km depth) and may exhibit a velocity-strengthening, stable frictional behaviour (fig. 4 of Scholz, Reference Scholz1988). Within this region, shear zone rocks like mylonites can be generated by slow, aseismic ductile shearing, only to be occasionally perturbed by intermittent rapid seismic slip, producing pseudotachylite layers, which are then further deformed by subsequent interseismic creep (Swanson, Reference Swanson1992). The recording, description and interpretation of the structures within plastically deformed, mylonite-hosted pseudotachylite layers, and their spatial and temporal relationship with typical brittle (cataclastic) pseudotachylite, have therefore gained importance in the geological and geophysical literature. In recent years, research work on pseudotachylites has mostly attempted to unravel the dynamics of seismic fracturing and slip (Di Toro, Goldsby & Tullis, Reference Di Toro, Goldsby and Tullis2004; Di Toro, Nielsen & Pennacchioni, Reference Di Toro, Nielsen and Pennacchioni2005; Di Toro et al. Reference Di Toro, Hirose, Nielsen, Pennacchioni and Shimamoto2006; Lin et al. Reference Lin, Maruyama, Aaron, Michibayashi, Camacho and Kano2005), to estimate earthquake source parameters (Allen, Reference Allen2005; Di Toro, Pennacchioni & Teza, Reference Di Toro, Pennacchioni and Teza2005), and to delineate the exhumation history of the associated fault zone rocks (Zechmeister et al. Reference Zechmeister, Ferre, Cosca and Geissman2007).
In the present contribution we describe the occurrence of two different types of pseudotachylite layers hosted in the sheared granitoids of the Gavilgarh–Tan Shear Zone, central India. These include pseudotachylite layers that are ductilely deformed after formation and a later set of pseudotachylite veins associated with cataclastic deformation of the host rock that have not experienced further ductile deformation.
2. Geology of the Gavilgarh–Tan Shear Zone
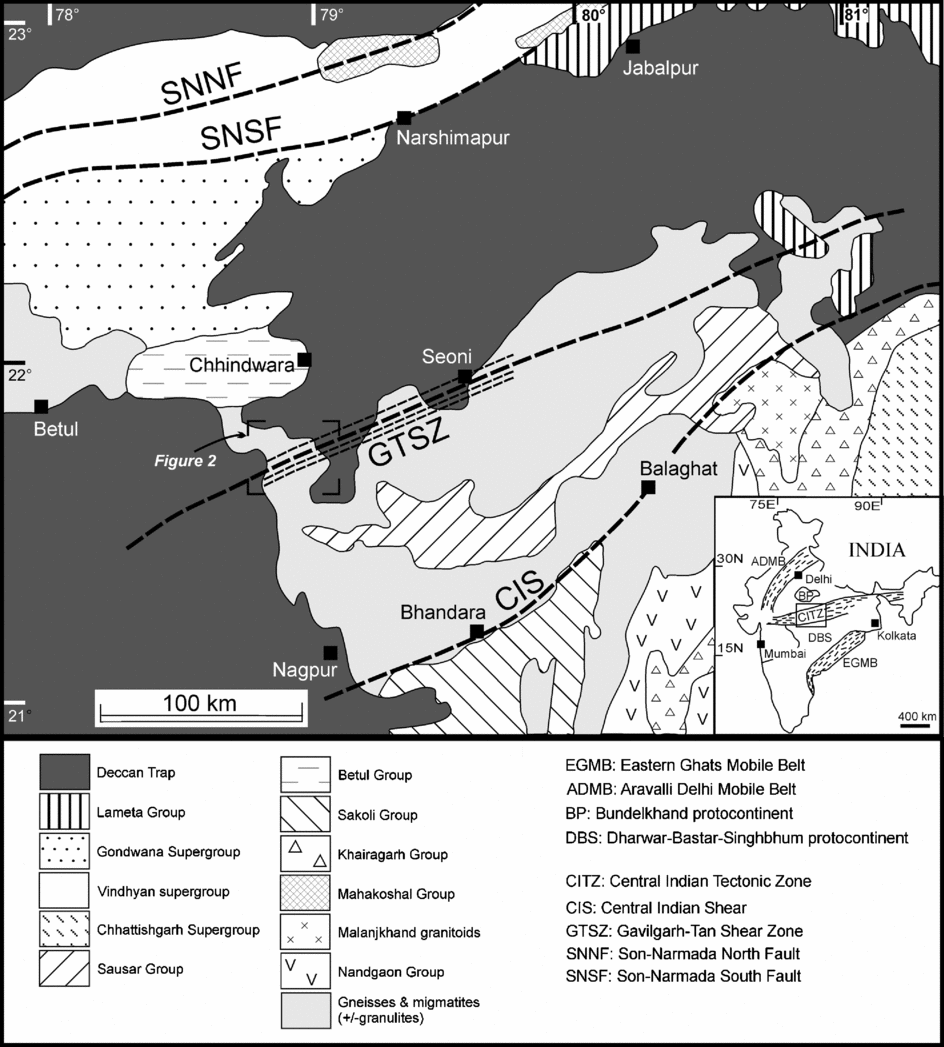
The Precambrian peninsular shield of India is made up of several Archaean cratonic nuclei, for example, the Bastar, Dharwar, Singhbhum and Bundelkhand cratons, skirted by Archaean–Proterozoic-age mobile belts. By the end of the Archaean, the Dharwar, Bastar and Singhbhum cratons accreted to form a composite southern continent (Rodgers, Reference Rogers1996; Roy & Prasad, Reference Roy and Prasad2003). This was followed by the multi-stage amalgamation and suturing of the northern (Bundelkhand) and the southern (Bastar–Dharwar–Singhbhum) continents along the E–W-trending, crustal-scale mobile belt known as the Central Indian Tectonic Zone (CITZ). This crustal-scale structure records tectonothermal events occurring over a wide geological time span: from Palaeo- through Meso- to Neoproterozoic (Radhakrishna & Naqvi, Reference Radhakrishna and Naqvi1986; Bandyopadhyay et al. Reference Bandyopadhyay, Chattopadhyay, Khan, Huin, Santosh, Biju-sekhar and Shabeer2001; Roy & Prasad, Reference Roy and Prasad2003) (Fig. 1, inset). Along-strike extensions of the Central Indian Tectonic Zone have been proposed in Madagascar (Katz & Promoly, Reference Katz and Promoly1979), Western Australia (Harris, Reference Harris, Findley, Unrug, Banks and Veerers1993) and even North America (Yoshida et al. Reference Yoshida, Bindu, Kagami, Rajesham, Santosh and Shirahata1996), making it an important tectonic component in the palaeogeographic reconstruction of Rodinia.
Geological map of part of the central Indian shield, showing the geology of the Central Indian Tectonic Zone (CITZ) and position of the Gavilgarh–Tan Shear Zone (GTSZ) (after Roy & Prasad, Reference Roy and Prasad2003). Box shows area of Figure 2. Inset: position of CITZ and other major Proterozoic mobile belts in India. Box in the inset shows the approximate area of Figure 1.

The E–W-trending Gavilgarh–Tan Shear Zone (GTSZ) runs through the southern part of the Central Indian Tectonic Zone and separates the Betul and Sausar supracrustal belts (Fig. 1). It is mainly defined by a ductile shear zone in the Precambrian gneisses and granitoids exposed in the Kanhan River valley and adjoining area south of Chhindwara, extending to the east up to Seoni, in Madhya Pradesh (Fig. 1). Evidence of large-scale brittle reactivation of the ductile shear zone is recognized, especially in the western part, where the Precambrian ductile shear zone has been disrupted by large-scale brittle faulting that also affected Palaeozoic (Gondwana Supergroup) and Mesozoic (Deccan Trap basalt flow) rocks (Golani, Bandyopadhyay & Gupta, Reference Golani, Bandyopadhyay and Gupta2001). Although there is no recorded seismicity on these faults, other lineaments within the Central Indian Tectonic Zone (e.g. Son-Narmada Faults to the north of Gavilgarh–Tan Shear Zone; see Fig. 1) are seismogenic and have caused major earthquakes in the last decade.
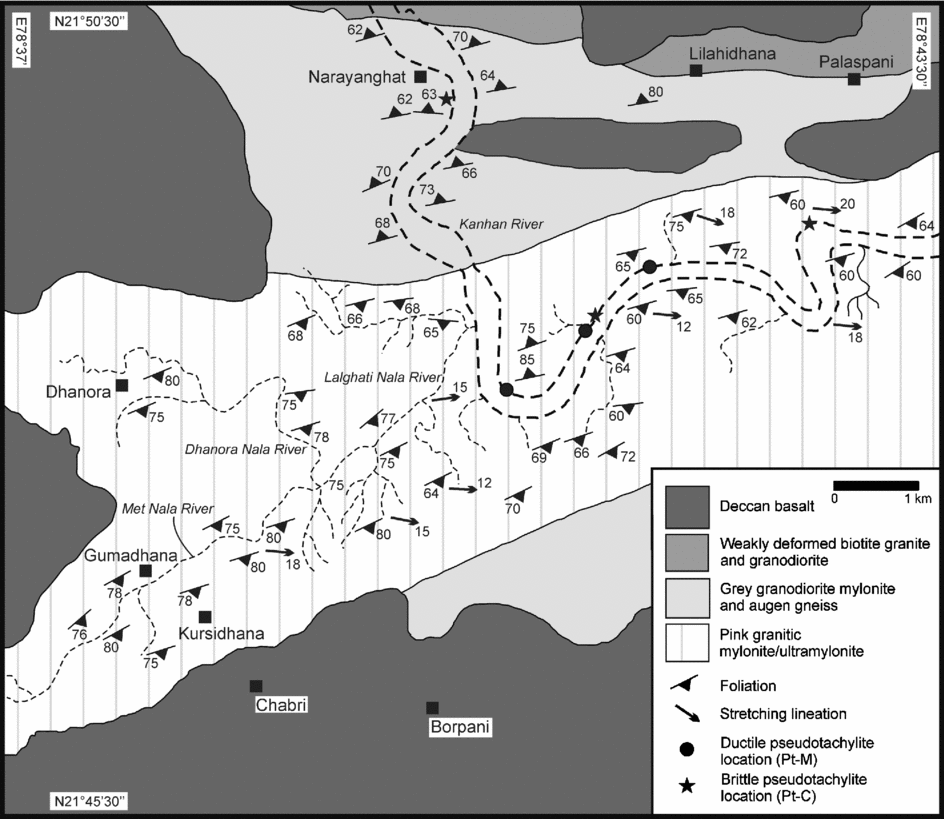
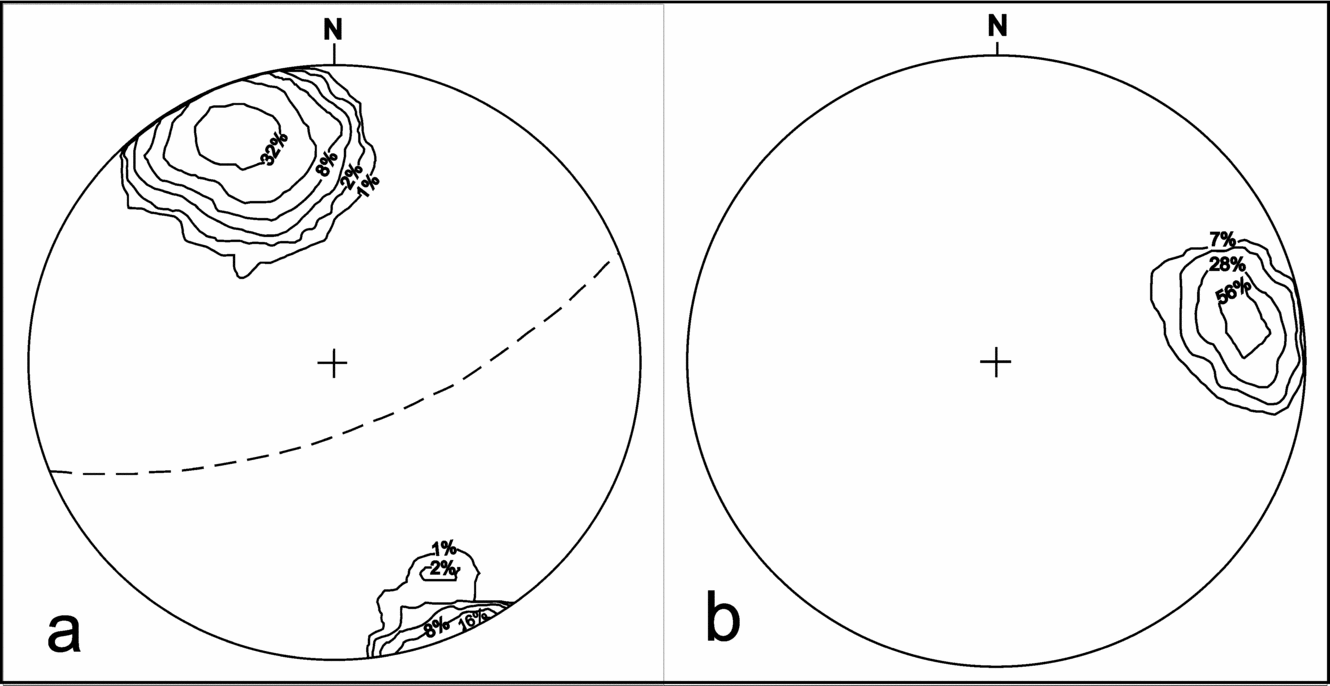
The present study was carried out in the Kanhan River valley between Khursidhana and Palaspani, where excellent ductile shear zone rocks are exposed in the riverbeds of the Kanhan River and its smaller tributaries. Coarse-grained porphyritic granite, medium- to coarse-grained granodiorite and medium- to fine-grained pink granite-aplite are the major lithological constituents of this zone (Fig. 2). All these rocks are sheared and mylonitized to varying degrees. Finite strain across the shear zone is strongly heterogeneous, generally increasing towards the central part from both north and south, producing a more or less continuous series of protomylonite, mylonite and ultramylonite. The mylonitic foliation in the shear zone is consistently very steeply dipping to subvertical (Fig. 3a) and a prominent stretching/mineral lineation on the foliation shows consistent, low easterly pitch (Fig. 3b). The structural features indicate that the Gavilgarh–Tan Shear Zone is a sinistral, strike-slip (slightly oblique-slip) fault zone deformed dominantly by non-coaxial flow (Golani, Bandyopadhyay & Gupta, Reference Golani, Bandyopadhyay and Gupta2001). There is a general scarcity of radiometric age data from the Gavilgarh–Tan Shear Zone, but one Rb–Sr whole rock date (1147 ± 16 Ma) of the deformed granitic rocks from its eastern part has been interpreted as indicating the timing of ductile shearing (Roy & Prasad, Reference Roy and Prasad2001). However, the reliability of such Rb–Sr age dating in these deformed rocks is open to question, and we presently do not place any great importance on this age data for tectonic interpretation. From available geological criteria, the Gavilgarh–Tan Shear Zone is presently considered as a Proterozoic shear zone, which has subsequently been reactivated as a brittle fault zone, possibly during the Palaeozoic and the Mesozoic (Golani, Bandyopadhyay & Gupta, Reference Golani, Bandyopadhyay and Gupta2001).
Geological map of the Gavilgarh–Tan Shear Zone (GTSZ) in the Kanhan River sector, showing lithology and structural elements of the shear zone.

(a) Equal-area stereographic projections of mylonitic foliation (n = 185). (b) Equal area stereographic projection of stretching lineation (n = 45) orientation data from the mapped area.

3. Fault rocks of the Gavilgarh–Tan Shear Zone
3.a. Mylonite and ultramylonite
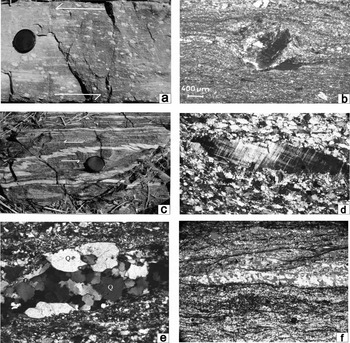
Throughout the Gavilgarh–Tan Shear Zone, granitic rocks have been mylonitized to varying degrees and show heterogeneous partitioning of strain at outcrop to grain scales. Mylonitic rocks show monoclinic structures such as asymmetric tails of winged porphyroclasts in outcrop (Fig. 4a) and at thin-section scales (Fig. 4b), and more or less consistently show a sinistral shear sense viewed in XZ sections (e.g. perpendicular to the mylonitic foliation and parallel to the stretching lineation). Asymmetric (S-shaped) folds of the mylonitic foliation with steeply plunging axes are common, indicating sub-horizontal sinistral shearing (Fig. 4c). The transition from gneiss to mylonite is characterized by grain refinement, mostly through dynamic recrystallization. K-feldspar grains recrystallize around the grain margin, forming core-and-mantle type microstructures (Fig. 4d). Lobes of myrmekite are also formed along the high-stress (compressional) margins of K-feldspar grains (Fig. 4d). These microstructural features indicate temperature in excess of 450–500 °C during mylonitization (Fitz Gerald & Stunitz, Reference Fitz Gerald and Stunitz1993). Quartz shows widespread recrystallization, mostly by high-temperature grain-boundary migration (‘Regime 3 GBM’ of Hirth & Tullis, Reference Hirth and Tullis1992) (Fig. 4e). A strong oblique (sinistral sense) foliation, defined by coarse, elongate quartz grains with mutually inter-penetrative and serrated boundaries, is developed in some quartz ribbons (Fig. 4f). The development of oblique internal foliations and the onset of high-temperature grain boundary migration in quartz indicate temperatures approaching 500 °C during mylonitization (Hirth & Tullis, Reference Hirth and Tullis1992; Stipp et al. Reference Stipp, Stünitz, Heilbronner and Schmid2002). The ductile deformation and mylonitization of the granitoids in the Gavilgarh–Tan Shear Zone therefore took place under amphibolite-facies conditions.
(a) Winged (σ-type) porphyroclasts of feldspar in mylonite showing sinistral shear sense. Diameter of the lens cap: 5 cm. (b) Asymmetric δ-type tail of recrystallized grains around a feldspar porphyroclast in thin-section, showing sinistral shear sense. Crossed polars view. (c) S-shaped asymmetric folds in granite mylonite, indicating sub-horizontal sinistral shearing. The fold axes are sub-vertical (orthogonal to the slip direction). Diameter of the lens cap: 5 cm. (d) Core-and-mantle type recrystallization microstructure around K-feldspar. Note the development of myrmekite lobes along two longer faces of the feldspar grain (white arrows). Crossed polars view. Horizontal length of the photograph: 4 mm. (e) High-temperature grain boundary migration recrystallization (GBMR) in quartz grains. Coarse grain size and strongly interlobate grain boundaries are characteristic of Regime 3 (> 500 °C) GBMR (Hirth & Tullis, Reference Hirth and Tullis1992). Q – quartz. Crossed polars view. Horizontal length of the photograph: 2 mm. (f) Oblique foliation within a quartz ribbon in granite mylonite, with sinistral shear sense. The quartz microstructure indicates high-temperature grain boundary migration recrystallization. Crossed polars view. Gypsum plate inserted for highlighting the quartz-rich oblique foliation. Horizontal length of the photograph: 4 mm.

3.b. Pseudotachylite
Dark-coloured layers of pseudotachylite, containing fragments of the host rock, are frequently observed in the mylonitized granitic rocks of the intensely deformed central portion of the shear zone exposed in the Kanhan riverbed south of Lilahidhana and Palaspani (see Fig. 2 for locations). Pseudotachylite layers found here are generally concordant with the mylonitic foliation, but also rarely cross-cut at a low angle in the dip section. Based on the morphology and deformational characteristics, we have divided the pseudotachylite layers of this area into two types:
(1) ‘Pt-M’: pseudotachylite layers which are ductilely deformed subsequent to their generation, along with the host mylonites;
(2) ‘Pt-C’: pseudotachylite layers that show clear evidence of coeval cataclasis of the host rock mylonites, and exhibit no post-emplacement plastic deformation.
Pt-C layers appear overall to be more abundant than the Pt-M type. The Pt-M layers typically occur in pink, K-feldspar-rich granite mylonites in the central, most intensely deformed part of the shear zone, whereas the Pt-C type layers occur in both K-feldspar-rich granitic and granodioritic mylonites in the central and northern parts of the Gavilgarh–Tan Shear Zone. The development of both Pt-M and Pt-C in K-feldspar-rich granitic mylonites suggests that the lithology of the host rock is not a primary control on the formation of Pt-M or Pt-C. The two types of pseudotachylite have not been found together in a single outcrop.
3.b.1. Field relationships
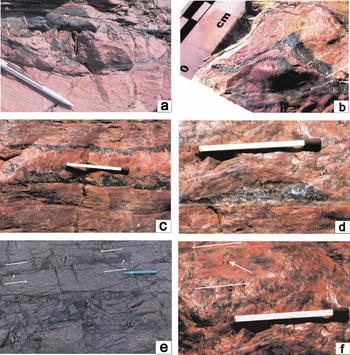
Pt-M type. These are typically 20–50 mm thick pseudotachylite layers concordant with the mylonitic foliation, from which a few discordant ‘injection’ veins emanate, cutting across the foliation in the host rock (Fig. 5a). At a few places, these concordant ‘fault-veins’ are folded together with the mylonitic foliation at the mesocopic scale (Fig. 5b). There is no significant cataclasis of the host rock observed in the vicinity of these Pt-M layers, although they often contain highly flattened and folded fragments of the host rock and commonly show an incipient foliation defined by the flattened clasts.
Field photographs of Pt-M and Pt-C layers in Kanhan riverbed. (a) Pseudotachylite zone in pink granite mylonite. Foliation-parallel ‘fault veins’ and small, discordant injection veins are seen. Diameter of the pencil: 1 cm. (b) Close-up view of a folded Pt-M layer, in hand-specimen, showing co-folding of the host mylonite layering. Each black/white rectangle in the scale is 1 cm long. (c) ‘Paired shear’ planes associated with a Pt-C layer. Note the fractured and rotated blocks of foliated host rock between the slip planes. Length of the matchstick: 4 cm. (d) Plano-convex lens of clast-laden melt along a slip plane. Length of the matchstick: 4 cm. (e) Pseudotachylite breccia (central layer of the photograph) in granodiorite mylonite. White arrows indicate stepped fractures that opened in a sinistral sense. Length of the pencil: 14 cm. (f) Close-up of (d) showing anticlockwise rotation of a mylonite fragment and dextral slip on R* shear fracture (arrow). This is consistent with brittle sinistral slip on the host mylonite foliation. Length of the matchstick: 4 cm. Map locations: (a, b, c, d, f) are from the Kanhan River bed south of Lilahidhana, (e) is located on the riverbank near Narayanghat.
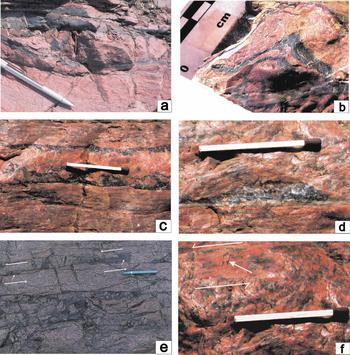
Pt-C type. In the Kanhan riverbed south of Palaspani, numerous layers of pseudotachylite are seen within the pink granite mylonite. The majority of these layers are concordant with the mylonitic foliation. However, they show clear evidence of cataclasis of the host rock, a feature not observed in the Pt-M type. The Pt-C layers generally occur associated with two parallel slip planes or ‘paired shears’ (Grocott, Reference Grocott1981), which possibly acted as the generation zone of pseudotachylite melt (Fig. 5c). Fracturing of the host mylonitic foliation and rotation of fractured blocks are observed between these paired shear surfaces. Clast-laden melt has occasionally concentrated in plano-convex lenses (Magloughlin, Reference Magloughlin1989) along the shear planes (Fig. 5d). Lithic fragments within the Pt-C layers are angular and do not show any evidence of ductile deformation at any scale. Rarely, rotated and fractured fragments of the host rocks are engulfed in dark pseudotachylite matrix, forming a zone of pseudotachylite breccia (Fig. 5e). There are few reliable shear-sense criteria associated with Pt-C layers. However, some stepped fractures observed on sub-horizontal river-bed outcrops (Fig. 5e) indicate a sinistral sense of opening. Fragments of the host rock have rotated in a sinistral sense between the paired slip planes (Fig. 5f), suggesting a possible sinistral brittle slip on the foliation-parallel slip surfaces.
3.b.2. Microstructure
Oriented thin-sections of pseudotachylite samples were studied under the optical microscope for textural and microstructural details. All sections were cut parallel to the XZ section (perpendicular to foliation and parallel to lineation). Where foliation and lineation were not clear at hand-specimen scale (a common situation with Pt-C type), thin-sections were oriented along the XZ section of the host mylonite, although a few YZ sections were also made. Microscopy was performed using a Leica Image Analyzer microscope fitted with a digital camera. Optical microscopy was not always sufficient to resolve the texture/microstructure of very fine-grained pseudotachylite, therefore a few samples were chosen for Scanning Electron Microscopy. These samples were coated with carbon film and studied under a Karl-Zeiss S440 SEM (operating voltage: 20 kV, sample current: 5 nA) at the Geological Survey of India SEM Laboratory at Kolkata. Microstructural features were recorded using Back-Scattered Electron (BSE) images. Where necessary, grain composition was determined using the EDAX facility fitted to the SEM.
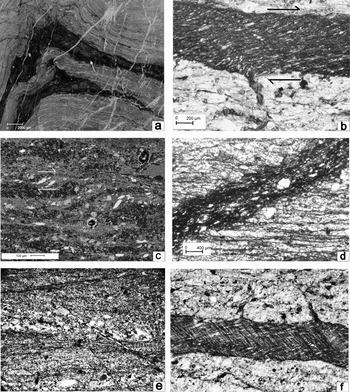
Pt-M type. Thin-sections of the disharmonic folding of Pt-M pseudotachylite layers and mylonitic host rock (shown in Fig. 5b) preserve coherent folds both within mylonite and pseudotachylite layers (e.g. Fig. 6a, arrowed). The pseudotachylite layer exhibits a cuspate–lobate pattern, indicating that, at the time of folding, the pseudotachylite layer had a lower viscosity (less competence) relative to the mylonite (e.g. Ramsay & Huber, Reference Ramsay and Huber1983, p. 395).
Microstructures of the Pt-M layers. (a) Folding of pseudotachylite and mylonite in thin-section scale. Note the cuspate–lobate nature of folding. A mylonitic fragment in pseudotachylite layer (near white arrow) is showing asymmetric (S-shaped) folding consistent with the general geometry of a buckling fold. Later quartz-filled fractures cross-cut the fold. Crossed polars view. (b) Photomicrograph of a Pt-M layer with a strong internal oblique foliation, indicating dextral shear. The small injection vein, discordant to the mylonitic foliation in the host rocks, has also developed the internal foliation. PPL view. (c) BSE image of Pt-M layer shown in (b) showing ‘mineral fish’ of titanite indicating dextral shear sense. (d) Strong planar fabric defined by the preferred orientation of mica grains and flattened clasts in a Pt-M vein discordant to the host rock foliation. PPL view. (e) Quartz ribbon with sinistral-sense oblique foliation displaced by later brittle–ductile dextral shear bands in the mylonite hosting the dextrally sheared pseudotachylite (Pt-M) layers. Horizontal length of the photograph: 10 mm. Crossed polar view. (f) A Pt-M vein (horizontal) showing the development of a set of kink-type crenulation folds (hingelines oriented top left to bottom right) on the strong dextral-sense internal foliation (top right to bottom left) indicating later (post-dextral) sinistral shearing on the Pt-M vein. This shearing event was possibly related to the generation of Pt-C layers elsewhere in the granitoids. PPL view. Horizontal length of the photograph: 4 mm.
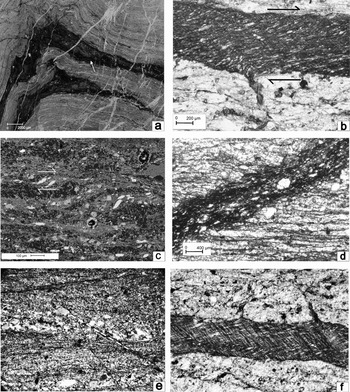
Some concordant Pt-M layers (cf. ‘fault veins’ of Sibson, Reference Sibson1980) show well-developed oblique foliations defined by aligned mica and flattened lithic clasts (Fig. 6b), indicating a layer-parallel dextral shear sense. A BSE image of this ‘fault-vein’ reveals the development of titanite ‘mineral fish’, with a clear dextral sense of asymmetry (Fig. 6c). Internal foliations defined by strongly flattened clasts and preferred orientations of micas (mostly biotite) are observed in some pseudotachylite veins that are discordant to the host mylonitic foliation (Fig. 6d). In the same thin-section, a quartz ribbon in the host mylonite with a strong internal oblique foliation (sinistral shear sense) is displaced by a set of brittle–ductile shear bands in a dextral sense (Fig. 6e). The host rock (mylonitic granite) in some of these thin-sections shows enrichment in chlorite and also characteristically shows brittle fracturing and dextral-sense displacement of feldspar grains, whereas the quartz grains exhibit ductile deformation. In one thin-section, a sinistral-sense, kink-type crenulation fabric overprints the dextral-sense mica-rich internal foliation of a deformed Pt-M layer (Fig. 6f).
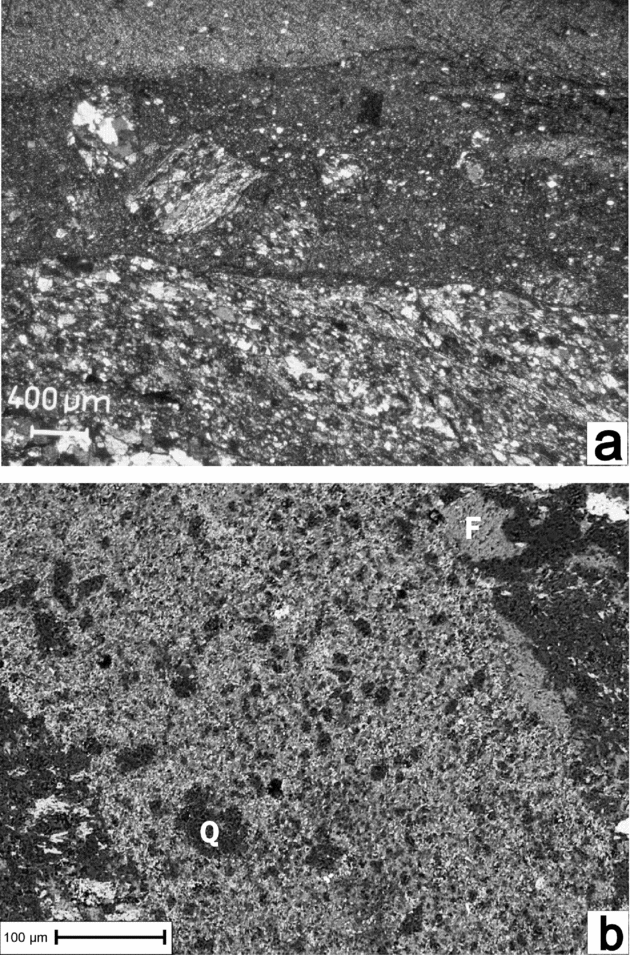
Pt-C type. Pt-C layers show clear evidence of cataclastic deformation of the host rock at microscopic scale. Angular fragments of mylonitic rock and of quartz are found floating in the extremely fine-grained matrix of the pseudotachylite layer that cuts the host mylonitic rock at an angle with a very sharp contact (Fig. 7a). The matrix constituents could not be identified by optical microscopy. Under SEM, the matrix is observed to comprise very fine, angular fragments of quartz and mylonitic rock set in a still finer aggregate of quartz, feldspar and a few mica microlites (Fig. 7b). In general, the Pt-C layers show very angular lithic clasts set in microlite-rich, extremely fine-grained matrix that exhibits no evidence of ductile deformation and/or development of internal foliation. Round droplets of sulphide (identified as chalcopyrite by EDAX) are occasionally found in the matrix, indicating the presence of a melt phase in the pseudotachylite matrix (e.g. Magloughlin, Reference Magloughlin1992).
Microstructures of Pt-C layers. (a) Pt-C layer cutting mylonite foliation at a low angle and with sharp boundary. Note fragments of mylonite within pseudotachylite matrix. Crossed polars view. (b) BSE image of the matrix of a Pt-C layer showing ultrafine feldspar (F) microlites (grey) and larger quartz (Q) fragments (black). No internal foliation has developed in the matrix, indicating negligible later deformation of the pseudotachylite.

4. Discussion
Both the Pt-M and Pt-C type pseudotachylite layers are characterized by slip planes (generation zones) that are generally parallel to the host gneissic/mylonitic foliation. It appears that frictional slip, either in the semi-brittle or brittle regimes, has preferentially occurred along the pre-existing mylonitic fabric. Reactivation of mechanically weaker surfaces in continental fault zones has been widely demonstrated and is a common criterion of reactivation in shear zones (Holdsworth, Butler & Roberts, Reference Holdsworth, Butler and Roberts1997). In the present study it was observed that shear sense in the mylonites/ultramylonites of the Gavilgarh–Tan Shear Zone is consistently sinistral (Fig. 4b, c), whereas the shear sense within the Pt-M layers, whenever found, is consistently dextral (Fig. 6b, c). A localized set of brittle–ductile shear bands with dextral shear sense has also been observed microscopically and in one sample of Pt-M, these dextral shear bands in the host mylonite clearly cross-cut and displace a quartz ribbon with a distinct sinistral asymmetry (an oblique internal foliation; Fig. 6e). The slip kinematics of the Pt-C layers is less well constrained, but is thought to be sinistral, based on the geometry of some stepped fractures filled with pseudotachylite developed in mylonitic granodiorite (Fig. 5e, arrowed; cf. ‘domino structure’ of Gammond, Reference Gammond1983). Similarly, fragments of fractured host rock are rotated in a sinistral sense adjacent to a slip plane (Fig. 5f). The sinistral-sense crenulation overprinting the dextral oblique foliation of a Pt-M layer in one sample (Fig. 6f) may also be related to the sinistral shearing overprinting the mica-rich Pt-M fabric during the generation of Pt-C.
The core-and-mantle type recrystallization microstructures of K-feldspar, development of myrmekite lobes (‘quarter’ structure) around K-feldspar grains, and high-temperature grain-boundary migration in quartz indicate that sinistral ductile shearing and mylonitization of these granitoids occurred at temperatures in excess of 450 to 500 °C, that is, in the ‘plastic’ zone in the upper crust (Fitz Gerald & Stunitz, Reference Fitz Gerald and Stunitz1993; Stipp et al. Reference Stipp, Stünitz, Heilbronner and Schmid2002). The mylonites are overprinted by localized dextral shear bands and Pt-M layers with a dextral-sense internal oblique foliation (e.g. Fig. 6e). These dextral structures are characteristically associated with brittle deformation of feldspars and ductile deformation of quartz grains, indicating greenschist-facies metamorphic conditions (300 °C < T < 450 °C) within the brittle–plastic transition (semi-brittle) zone. The matrix of Pt-C, on the other hand, consists of fractured fragments of both quartz and feldspar (Fig. 7a, b) along with host rock fragments, indicating low temperature (< 300 °C), ‘brittle’ deformation during this final phase of sinistral faulting. Despite this good evidence for repeated reactivation along the Gavilgarh–Tan Shear Zone, we have not observed any evidence for large-scale fluid infiltration that might be associated with long-term fault zone weakening (cf. Imber, Holdsworth & Butler, Reference Imber, Holdsworth and Butler2001; Holdsworth, Reference Holdsworth2004).
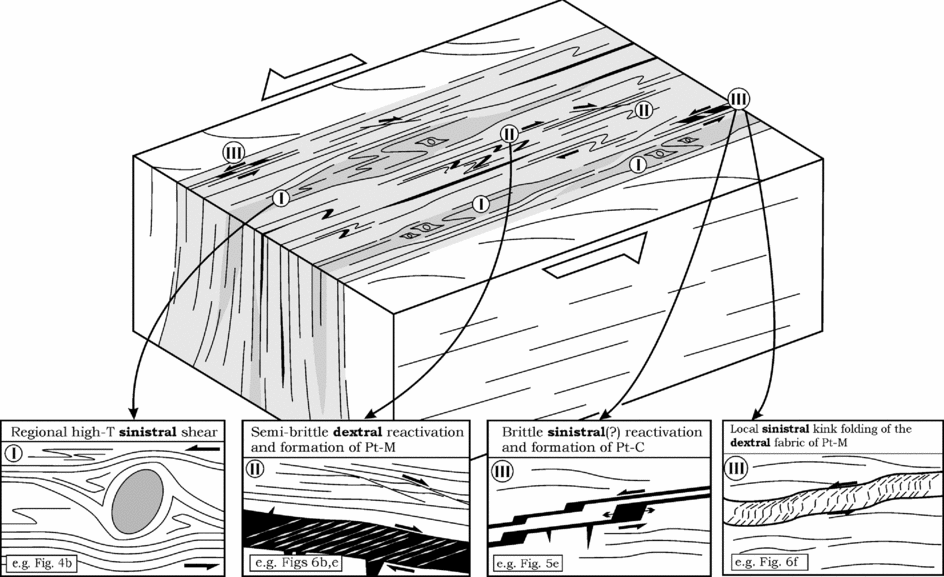
Based on the above observations, we suggest that mylonites exhibiting strong ductile deformation of quartz and feldspars were initially produced in sheared granitic rocks under amphibolite-facies conditions at depth (T > 450–500 °C). The shear zone was then exhumed to a depth approximately corresponding to the semi-brittle (brittle–plastic transition) zone. Further deformation localized along the pre-existing shear zone foliations under greenschist-facies conditions, producing dextral-sense frictional slip along the foliation surfaces which led to the formation of inter-layered pseudotachylite (Pt-M) bands within the mylonite. This was followed almost immediately by localized folding and dextral-sense ductile deformation of the Pt-M layers. The cuspate–lobate morphology of the folded pseudotachylite layers, with cusps pointing towards the quartzofeldspathic mylonite layers, suggests that the Pt-M layer was rheologically softer than the host mylonite during folding. This suggests that folding possibly occurred before complete solidification of the melt–clast system. The time gap between the ductile sinistral shearing event and the later brittle–ductile dextral deformation is difficult to ascertain in the absence of data on the absolute ages of deformation. Wholly brittle sinistral-sense deformation, cataclasis and pseudotachylite generation (Pt-C) occurred still later at shallower depth, although the kinematics of this deformation event is less well constrained. Figure 8 summarizes the interpreted deformational history of the Gavilgarh–Tan Shear Zone.
Summary diagram showing the interpreted deformational history of Gavilgarh–Tan Shear Zone (GTSZ). Typical examples of the different events are shown in the boxes with reference to the relevant photographs.

It could be argued that the Pt-M layers were generated in the plastic/ductile crust, at a depth similar to the mylonites, due to transient increases in the strain-rate. Similarly, it might be argued that the brittle (Pt-C) pseudotachylites were generated at a similar depth as the brittle–plastic (Pt-M) pseudotachylites after the cessation of regional-scale ductile shearing. Our interpretation of the three different rock types (e.g. mylonite, Pt-M and Pt-C) being generated at different crustal depths hinges on the observation that the host gneisses show distinctly different metamorphic signatures associated with each of these three fault rocks, indicating a gradual shallowing of depth, as discussed in the preceding paragraph. Moreover, the kinematics (e.g. shear sense) of deformation associated with each type seems to differ, and deformation structures with contrasting shear senses are seen overprinting one another (e.g. Figs 6e, f, 8). This cannot be explained by continuous ductile deformation with high strain-rate pulses.
In the absence of radiometric age data, it is difficult to constrain the absolute timing of Pt-M and Pt-C generation, and therefore the history of exhumation of the shear zone. However, some of the Pt-C bands in the shear zone (e.g. Fig. 5e) occur along a fault line that can be laterally traced into the overlying Deccan Trap basalts. Brittle reactivation of the shear zone (and at least one episode of frictional slip and/or melting along the foliations) therefore may have occurred in the Cretaceous or later. The timing of Pt-M generation remains uncertain. Ar/Ar laser-probe dating of contiguous mylonites and pseudotachylites from Møre–Trøndelag fault zone, central Norway (Sherlock et al. Reference Sherlock, Watts, Holdsworth and Roberts2004), has clearly demonstrated that time gaps exist between associated mylonite and pseudotachylite assemblages in reactivated fault zones, even in cases where they are indistinguishable on kinematic grounds, that is, where they are associated with similar shear-sense indicators. In the Gavilgarh–Tan Shear Zone, the pseudotachylites and mylonites were generated at different depths and under different kinematic environments, as discussed above. The problem lies with the absolute timing. In situ radiometric dating, similar to the work referred to above, of the Pt-M, Pt-C and their host rocks, will hopefully resolve the absolute chronology of events, but we emphasize the importance of having carefully documented field and microstructural observations in place before such a study is attempted.
The presence of pseudotachylite of different generations and types in this fault zone, possibly spanning a considerable time period, indicates the seismogenic nature of this fault over a protracted period in the geological past. As mentioned earlier, parts of the so-called Indian peninsular ‘shield’ area have experienced strong earthquakes in the past two/three decades. Of these, the 1997 ‘Jabbalpur earthquake’ (magnitude: 6.0) has been attributed to the reactivated tectonic movements on Son-Narmada Fault zone, a major structure parallel to the Gavilgarh–Tan Shear Zone and lying about 100 km to the north of it (Acharyya & Roy, Reference Acharyya and Roy2000). Similarly, another earthquake near Balaghat (occurring in 1957) has been correlated to the Central Indian Shear (CIS), south of the Gavilgarh–Tan Shear Zone (Fig. 1) (Acharyya & Roy, Reference Acharyya and Roy2000). There has not been any systematic geophysical/seismological study on the Gavilgarh–Tan Shear Zone to date, although this fault/shear zone exhibits ubiquitous evidence for reactivation (e.g. Golani, Bandyopadhyay & Gupta, Reference Golani, Bandyopadhyay and Gupta2001). The present study confirms this view and shows that pseudotachylite was generated under different geological conditions, possibly related to different phases of movement on this continental-scale structure. Geodetic GPS surveys presently being conducted in parts of the Central Indian Tectonic Zone have primarily indicated active crustal movements along the major lineaments in this area (P. Banerjee, pers. comm.). Study of these pseudotachylites in the context of the history of repeated reactivation of the Gavilgarh–Tan Shear Zone is therefore very significant for understanding the tectonics and seismicity of a large part of the central Indian Shield.
5. Conclusions
(1) Pseudotachylite layers intimately associated with mylonites in the Gavilgarh–Tan Shear Zone, Central India, are of two types: those interlayered with mylonite and ultramylonite, and themselves deformed ductilely along with the host rock (Pt-M), and those associated with cataclasis of the host rock and with no subsequent ductile deformation (Pt-C).
(2) Pt-M layers show strong flattening of lithic fragments, internal foliation development and buckle folding along with the host rocks, and possibly formed in the semi-brittle zone of the crust. Pt-C layers show sharp truncation of host foliation, angular clasts with little strain, paired slip planes, plano-convex lenses of clast-laden melt and widespread cataclasis of the host rock. They have formed at a shallower depth, at a lower (< 300 °C) temperature where typical brittle deformation predominates.
(3) Contrasting, but consistent, shear-sense criteria in host mylonites (sinistral) and in the Pt-M layers (dextral) indicates that Pt-M was generated by ‘geometric’ (and not ‘kinematic’) reactivation (sensu Holdsworth, Butler & Roberts, Reference Holdsworth, Butler and Roberts1997) of the shear zone foliations within the semi-brittle zone of the upper crust (10–15 km depth). Cataclasis of the host rock and generation of Pt-C layers took place at a shallower depth associated with renewed sinistral movements, possibly much later than the Pt-M.
(4) The absolute ages of the repeated reactivation events along the Gavilgarh–Tan Shear Zone and the repeated episodes of frictional melting can be attempted if these pseudotachylites can be directly ‘dated’. Understanding the history of pseudotachylite formation and fault reactivation in the Gavilgarh–Tan Shear Zone will likely have important implications for our understanding of the tectonic history of the central Indian shield.
Acknowledgements
The present work was funded by the Department of Science and Technology, Government of India (DST grant no. SR/S4/ES-69/2003). Delhi University provided the infrastructure for laboratory studies. AC thanks B. K. Bandyopadhyay of the Geological Survey of India (GSI), for introducing him to the pseudotachylites of Gavilgarh–Tan Shear Zone. SEM work was carried out at GSI, Kolkata, for which we thank S. Shome. John Spray, J. C. White and an anonymous reviewer are thanked for their critical comments on different earlier versions of the manuscript, which have immensely helped in writing the present paper. Part of the work has been carried out at Durham University during a visit by AC, funded by the Royal Society international visiting fellowship.