1. INTRODUCTION
The movement of vessels in the maritime domain is of considerable interest for both safety and security reasons (Creech and Ryan, Reference Creech and Ryan2003). From the perspective of a national authority, safety of the state's citizens and vessel crew requires knowledge of the cargo, ports of call, vessel position, and the vessel's immediate situation including the local natural environment (wave state, water depth, etc.), and the local manmade environment (other vessels, bridges, etc.). National authorities are also mindful of security issues which again require knowledge of the approaching vessel traffic. As a result, enforcement and jurisdictional authorities are tasked with maintaining an awareness of the vessel traffic within their area of authority (Kearney and Millar, Reference Kearney and Millar2004). The awareness of vessel traffic in the maritime domain is considered a component of Maritime Domain Awareness (MDA) (Transport Canada, 2012).
Beyond the awareness of the current situation, security and defence authorities often have an interest in the history of a vessel, vessel traffic patterns, and the use of such information for the prediction of vessel movement. For these interests, historic data provides valuable positional information and metadata that often supports the safety or security requirement. However, managing this historic archive is a non-trivial task (Pan and Deng, Reference Pan and Deng2009).
This paper explores the management of vessel positional data and supporting vessel metadata. From an information science perspective, the management of these data present challenges related to collection, storage, retrieval, dissemination and use of the data. In large part, these challenges are a result of the incoming data characteristics. In particular, the problematic characteristics include the large data volume, high rate of incoming data (i.e., data velocity), and to a lesser extent, the variety of data.
These data characteristics place certain pressures on the management system. The system must be capable of maintaining the acquisition of incoming data while processing and storing the data values when received. Maintenance of the system must be permitted during data acquisition and user access must be permitted for querying the database to obtain data for analyses.
The desire to manage and make accessible the vessel data raises several questions regarding the methods used, and the information structure within which those data are managed. For example, modified open source Database Management Systems (DBMSs) have been reported to deal with extremely large data sets (Lai, Reference Lai2008). However, the question as to whether or not non-modified open source DBMSs are capable of managing and making accessible data volumes on this scale remains open. In large data volume situations the traditional DBMSs are now being replaced with object-centric systems referred to as Not-Only Structured Query Language (NoSQL). NoSQL database systems do improve scalability at the expense or relaxation of the basic principles governing traditional DBMSs (Pokorny, Reference Pokorny2013).
There is also the question of what form the information structure should take. For example, should data attributes be explicitly or implicitly included in the data model? In this context, explicit inclusion means the physical database would have tables containing column names that are explicitly named for the attribute. Often the explicit attributes will be defined by the requirements of the system, or restating this, the questions to be posed of the data. However, in some cases, the variability in data content will imply certain design decisions, such as the use of implicit or abstract storage through techniques such as the use of attribute-value pairs (Dinua and Nadkarnia, Reference Dinua and Nadkarnia2007). The identification of which data attributes to explicitly include can be a challenge.
The organisation of maritime data and products in an affordable research-oriented infrastructure is the focus of this paper and specifically how the system is designed using a combination of open-source products. There are several objectives to this work including:
-
• Design the information structures required for a data and product management infrastructure to support research into maritime domain awareness.
-
• Lessen development and maintenance costs through the use of open-source solutions where applicable.
-
• Test the infrastructure by incorporating maritime-relevant data sets and provide the data to the user community for research activities.
The infrastructure design presented here brings together a variety of open-source and commercial products to develop an information management solution that supports maritime domain awareness research. The resulting infrastructure supports geospatial investigations of vessel positional data in a timely manner, with affordable start-up and long-term costs.
The remainder of this paper is structured as follows: Section 2 provides an overview of the problem being addressed. Section 3 introduces the physical system, and the conceptual and physical data models. Section 4 discusses how the system may be used to generate maritime products, while Section 5 provides concluding remarks.
2. OVERVIEW
The management of a global, high velocity data source such as the Automatic Identification System (AIS) is a challenge for those interested in maritime traffic. This is primarily due to the fact that AIS introduces data volumes that are not common to the user community. For example, prior to the introduction of AIS the only available global data source for vessel tracking was based on weather reporting provided as part of the voluntary observing ship programme, this being part of the World Meteorological Organization World Weather Watch. A summary report (Intergovernmental Oceanographic Commission of UNESCO, 2002) indicates a global report volume of 181,000 for August 2000 from an estimated 6,700 vessels. Using this value, an estimate of 2·1 million reports per year would be generated. This represents about one report per day per vessel.
With the introduction of AIS, volumes of maritime positional data increased dramatically. For example, the AIS specification calls for a reporting rate of 10 seconds for vessels moving at 0-14 knots. At this frequency of reporting, a single vessel would generate the above mentioned 2·1 million reports in about two thirds of a year. Considering the number of vessels worldwide is about 165,000Footnote 1 , the 2·1 million reports could in fact be generated in approximately two minutes.
There has been some work describing the information structures used in the management of the data generated by AIS sources. An information structure that grouped all the vessel's attribute data into a single AIS Targets table held in a commercial DBMS was used to store AIS data received by an air platform (Ou and Zhu, Reference Ou and Zhu2008). In other work, the European Union PASTE MARE project (Eiden and Goldsmith, Reference Eiden and Goldsmith2010) stored and then used space-based AIS in the monitoring of maritime traffic. Unlike the Maritime Situational Awareness Research Infrastructure (MSARI) described here, the previous efforts utilised database table structures that were not highly normalised. The PASTE MARE database was similar to MSARI in that the database and supporting system utilised daily bulk data loads to minimise the time required for data ingest. However, MSARI differs considerably from these other efforts in data volumes. The PASTE MARE project only considered space-based AIS data for a period of three months (European Commission, 2010) with AIS received from a terrestrial antenna on the Finnish-Swedish coast for a period of seven days, while the air platform collection appears to cover a period of two months. MSARI is designed for storage of continuous, global real-time data volumes.
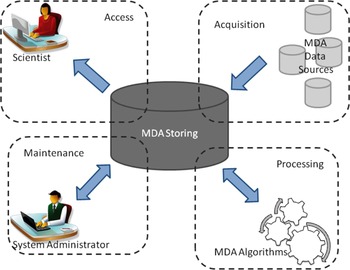
The spatial-temporal region addressed by MSARI covers both a larger area and greater time period. As an infrastructure (see Figure 1) that supports research into MDA, MSARI supports:
-
• The acquisition of information from a variety of data sources: MSARI provides a means to receive and parse data from several different data sources via a variety of connectors, including diverse AIS providers such as directly from antenna, AIS aggregation systems such as the Maritime Safety and Security Information System (MSSIS) (Glynn, Reference Glynn2010), providers of space-based AIS, etc. MSARI also provides a mechanism to manage other MDA-relevant data sources such as ice field databases, Automatic Dependent Surveillance-Broadcast (ADS-B), and electronic charting systems.
-
• The storage and management of those data: MSARI is capable of storing MDA data of multiple types. These data include ship positional and attribute data from the inputs noted above, related ship and source metadata, and data products. Here, a product is considered the result of applying data to an algorithm. MSARI must also maintain storage for the original data as received, in addition to any parsed data.
-
• A maintenance mechanism: To maintain the quality of data stored by MSARI, the system provides a means to modify, retrieve and delete data in the MSARI database as well as typical maintenance tasks such as monitoring capabilities, backups, tune-up/optimisation, integrity checks, etc. MSARI also provides a state board showing which feeds are active, data throughput, trends over time, users connected to MSARI, etc.
-
• A processing mechanism to add data and applications: MSARI is also extensible while minimising the level of effort required to implement these extensions. This extensibility includes the capability to add new data sources (e.g. the same type of data but from a different provider), the addition of new data types and the capability to add processing algorithms (Hadzagic et al., Reference Hadzagic, St-Hilaire and Webb2013; Isenor et al., Reference Isenor, Cross, Webb and Lapinski2013; Lapinski and Isenor, Reference Lapinski and Isenor2011).
-
• User access to data: MSARI provides the user with a standard means to access data based on SQL query language (Digital Equipment Corporation, 1992) and database Application Program Interface (API). MSARI can also provide ongoing streaming of the incoming data before being processed and stored in the database.
MSARI's functional units. The boxes depicted with dashed lines represent the units while the arrows represent data flow.

3. METHODOLOGY
3.1 Physical System
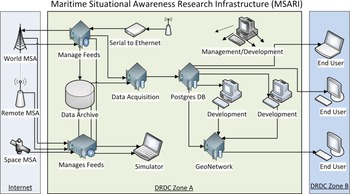
MSARI represents an assembly of technologies and hardware that accepts data inputs and makes data accessible to users and applications. The infrastructure shown in Figure 2 is depicted as three components: the internet, Defence Research and Development Canada (DRDC) Zone A, and DRDC Zone B.
The physical components of MSARI. Data feeds are depicted in the left panel. The MSARI hardware and software components are depicted in the middle panel. The right panel indicates user access.

The internet component represents the data inputs. The uppermost input in Figure 2 corresponds to the world-wide data feed from the MSSIS (Glynn, Reference Glynn2010). MSSIS is a global aggregator of vessel traffic information with a substantial portion of the feed being AIS data. The middle input (see Figure 2) is the Remote Data Collector. This corresponds to research specific remote collection sites, fixed or moving. The lowermost input is space-based AIS. This data feed is purchased from the commercial provider exactEarth (eE) (exactEarth, 2015). Relative data volumes from the three feeds is approximately 70% MSSIS; <1% remote collection, and 30% eE.
DRDC Zone A represents the core of MSARI and is composed of about nine servers and one disk farm. All incoming data are immediately split into two identical streams, one directed to the data archive (i.e., the disk farm) and another directed to the data acquisition server. The data archive stores all incoming data in its natural format. The data acquisition server parses the incoming stream according to stream-specific rules and then stores parsed and original data. Other servers in DRDC Zone A are dedicated to application development and testing, as well as product management.
DRDC Zone B corresponds to the scientific users. These users access the data either through standard SQL queries using an application such as PgAdminFootnote 2 or through user-developed applications. These user-developed applications are typically specialised to execute custom queries that address the requirements of the MDA research topic.
There are two MSARI databases in DRDC Zone A. Physically, the databases have identical structures. The first database, named MSARI buffer, manages the incoming data stream on a daily basis. Once per day, the data contained in the MSARI buffer are transferred to the second database known as the MSARI archive.
Both databases are built from the DBMS PostgreSQL (PostgreSQL, 2011), an open source object relational DBMS. PostgreSQL serves as the basis for PostGIS (PostGIS, 2009), an add-on that spatially enables the PostgreSQL database. Spatially enabling the DBMS means that constructed databases will be able to store geographic geometry types such as points, lines and areas. As a result, the database may be used by a Geographic Information System (GIS) application that provides visualisation and computation possibilities (Isenor and Spears, Reference Isenor and Spears2014).
PostgreSQL was chosen over other potential DBMSs (e.g. NoSQL) because of the very powerful GIS capabilities in PostGIS. Although NoSQL DBMSs provide flexibility in accepting different data sources with different data structures, at the time of the decision the geospatial support was very limited (e.g. 2D flat plane and only a fraction of the geospatial functions as compared to PostGIS). As well, since PostGIS follows OpenGIS® standards, numerous commercial and open-source developments can interface with the PostGIS geometry types. For example, QGIS (QGIS, 2014) is one such open-source tool used by several MSARI users.
The hardware for the core of MSARI was updated in January 2015 to increase capacity and processing capability. The core consists of two rack-mounted machines–an Acquisition Server containing the MSARI buffer database and a Main Server containing the MSARI Archive. The Acquisition Server has an ASUS motherboard with Intel Xeon E5-2650 processor (Eight Core, 2·6 GHz, 20 MB L3 Cache each), 128 GB RAM (DDR3, 1600 MHz), and 2 X 4 TB SATA Hard Drives (6 Gb/s, 7200 rpm) for storage. The Main Server is similar to the Acquisition Server, but with dual processors, 256 GB RAM (DDR3, 1600 MHz), and 24 X 4 TB SATA Hard Drives with Software RAID 6 for storage. The Main Server also uses a Highpoint Rocket 750 40-Channel SATA 6 Gb/s PCI-Express 2·0 card to connect the 24 SATA drives to the ASUS motherboard.
3.2. Conceptual Data Model
At the centre of the functional (Figure 1) and physical (Figure 2) depiction are the two databases, MSARI buffer and MSARI archive. As noted, these two databases have an identical data model.
To understand the data model, first consider the conceptual model (Simsion, Reference Simsion2007). A conceptual data model presents the concepts and relationships that are to be accounted for in the database. A conceptual model does not define the details as to how these entities and relationships are stored; that information is contained in the physical model. However, decisions made in the conceptual model influence the information structure that results in the physical model.
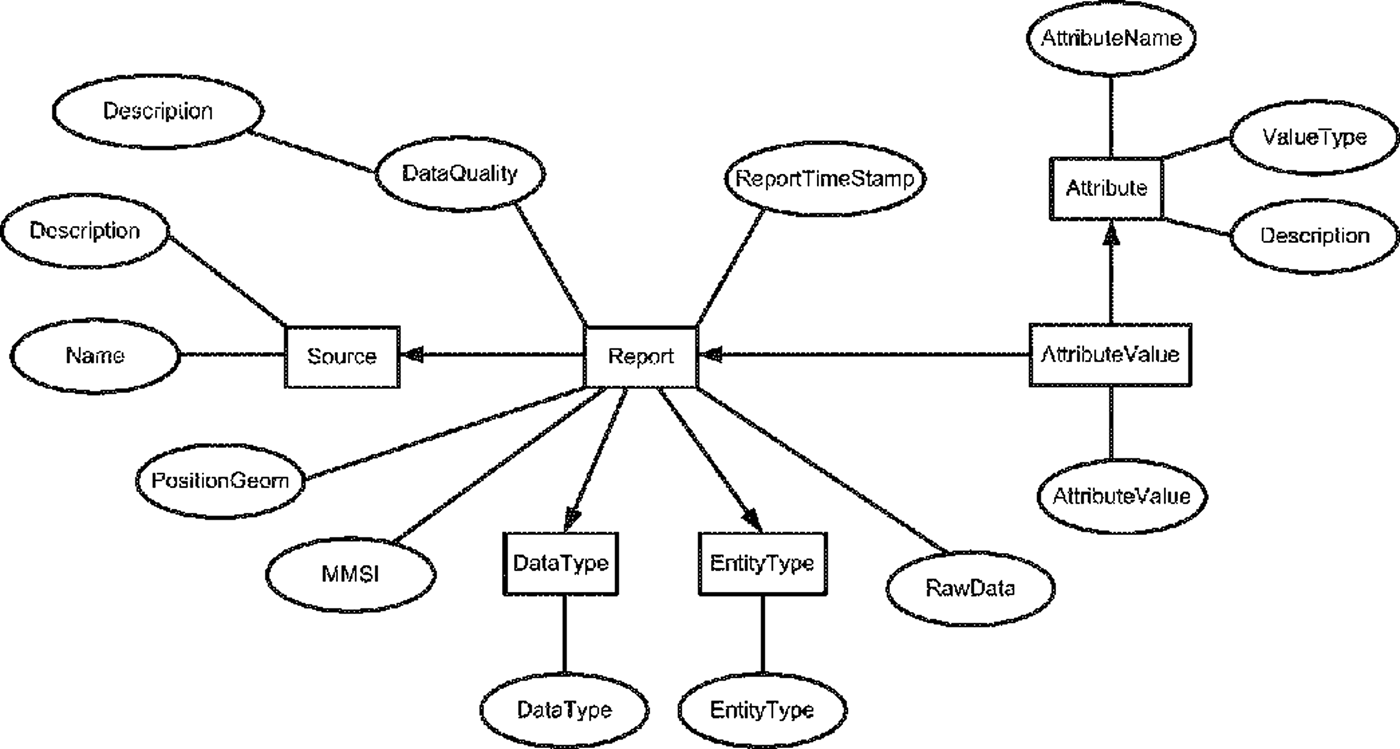
Figure 3 shows the MSARI conceptual model. In this figure, rectangles represent the entities while the ovals represent the entity properties. Relationships are indicated with connecting lines.
The MSARI conceptual data model. Rectangles indicate entity types, while ovals indicate properties of the entity.

At the centre of the model is the Report entity. The Report entity contains reports (e.g. an AIS message), with each report supported by both entities and properties. Supporting entities include RawData, which captures the incoming message in its original form. Each report also describes a specific object in EntityType, and also provides data that describe the object in DataType. The report's many attributes are described in AttributeValue, while the originating source of the report is described using Source.
Attributes contained within the report are defined in two different ways in the conceptual model. Primary attributes are defined explicitly and shown in Figure 3 using properties such as the position associated with the vessel report (i.e., PositionGeom), the vessel's Maritime Mobile Service Identity (i.e., MMSI), and the time of the report (i.e., ReportTimeStamp). These attributes are specifically separated and named due to their importance in typical database queries.
Secondary attributes are stored in the AttributeValue structure. This structure is flexible, allowing the definition of new attributes as new reporting structures are included in MSARI. The diversity in attributes results in the conceptual model depicting attributes as illustrated in Figure 3. This type of attribute modelling is known as entity-attribute-value design (Dinua and Nadkarnia, Reference Dinua and Nadkarnia2007). This design is particularly relevant when the number of potential attributes is large, but the number of attributes that will accompany a given report is small. This is the case with the reports entering MSARI, where for example, a specific AIS report has a small set of attributes, but the diversity of AIS reports results in a large attribute set.
A conceptual data model that specifically labelled each attribute would result in a physical model that had a column named after each attribute. This would in turn create a database table that contained many NULL (or blank) values, as numerous reports would not contain the particular attribute value. Only those reports providing the specific attribute value would result in a non-NULL entry. A data model that contains a column named for each incoming data attribute would mean the incorporation of new data attributes would require changes to the data model.
3.3. Physical Data Model
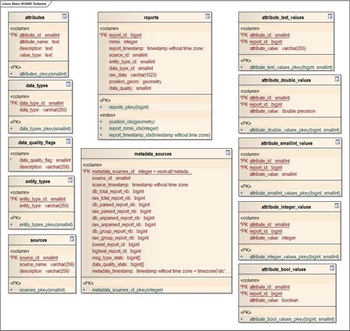
The physical representation of the conceptual model is shown in Figure 4. This figure indicates the structure of the database as shown by the table and column names, column data types, and primary keys.
The physical representation of the data model. Tables (shown as named rectangles) contain the fields (names within the rectangles). Primary keys are identified with leading text PK on the field names.

Given the volume of AIS data that is entering MSARI, the size of the physical database is also an issue that impacts scalability. The storage of the raw (non-decoded) AIS message produces a minimal requirement on storage space. However, the parsed and stored content, which is critical to enable the temporal-spatial querying of the database and the use of GIS tools, increases the storage requirement by approximately ten times over and above what is required to store the raw AIS message. Physical scalability is therefore impacted by the amount of stored parsed data. As a means to minimise storage requirements while providing parsed data to the user, a method of categorisation based on attribute type was implemented.
The conceptual model component for attributes shows that an attribute consists of a name, description, and value. Implicit in this is that the attribute also has a type (e.g., Boolean, integer, real, text) and this type greatly impacts the physical storage required for the attribute value. For example, all attribute values could be stored in a single data type, that being a text string. In this implementation, a numeric attribute value such as 538003407 could be stored as text, along with other more traditional text fields (e.g., the destination of a vessel). However, the implementation decision greatly impacts the physical space used by the database. As an example, an attribute value for a MMSI number stored as a text string (e.g.,`538003407`) occupies 13 bytes on disk, while the same value stored as an integer only requires 4 bytes (i.e., a disk space saving of ~70%).
The volume of attribute values combined with the potential space saving when using different attribute types, resulted in the MSARI physical design containing an AttributeValue that was partitioned into five tables. These five tables are based on the attribute value data type; those types being integer, small integer, boolean, text, and double. This implementation for attribute values results in an approximate disk space saving of 85% as compared to storing all attribute values as text strings.
A time partitioning was also implemented to speed up queries and database maintenance. Report and AttributeValue tables were split using inheritance into smaller physical units each containing one month of data. This technique results in child tables being created based on the structure of a single parent table. Once the partitions are established, a query optimisation technique known as constraint exclusion can be implemented to improve performance of queries against the partitioned tables. This allows the query planner to exclude any child tables with date ranges outside the query parameters, thus speeding up the query. This results in improvements for bulk data loads, deletes and queries at the expense of a more complex data structure to create and maintain.
Table metadata_sources completes Figure 4. This table maintains a status of individual data sources and provides information to the monitoring capability described in Section 2.
4. RESULTS
The current implementation of MSARI has been operating for one year, obtaining data from three primary data sources:
-
• MSSIS world feed decimated to a five minute update interval;
-
• MSSIS un-decimated data for three selected areas of the world; and
-
• exactEarth space-based AIS world feed.
Although the data volumes vary at any given time, an approximate incoming volume is two billion reports per month, or about 66 million reports per day. For comparison to the reporting value given in Section 2, the current incoming volume equates to 2·1 million reports in approximately 45 minutes.
The large managed volume of data means that global vessel-related products can be generated from the MSARI. Consider the data set from 1 November 2013 to 30 April 2014 with only the global feeds included (i.e., decimated MSSIS and exactEarth). During this six month period, the decimated MSSIS and exactEarth world feeds provided 1,056·7 and 425·8 million positional reports, respectively. Sub-selecting only positional reports that have concurrent Speed-Over-Ground (SOG) and Course-Over-Ground (COG), results in a total data set of 1,434·9 million positional reports.
A quality control process is applied to the data. The process is made up of the following quality control conditions, applied in the order indicated below:
-
a) omit reports containing positions where longitude is reported as either >180°E or <−180°E, or latitude is reported as >90°N or <−90°N,
-
b) omit reports containing SOG values >100 knots,
-
c) omit reports containing COG values >360°, and
-
d) omit reports when a grid cell contains only a single value for SOG or COG.
Table 1 summarises the impacts of the quality control on the data. Grid cells of 1° x 1° were used in the analysis.
Summary of data points used in the investigation. Refer to the text for quality control conditions. Note the percentage of removed data points is consistently less than 1%.

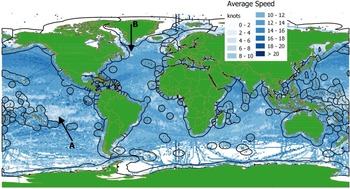
Using the SOG values, the average speed in the 1° x 1° grid cells is computed (Figure 5). Also included in Figure 5 is an overlaid land mask (i.e., green region) and the world Exclusive Economic Zones (EEZ) (Claus et al., Reference Claus, Hauwere, Vanhoorne, Dias, Hernandez and Mees2015) (i.e., polygons around land mask). It should be noted that overlaying the land mask does hide AIS reception in areas such as major rivers and spurious receptions along the prime meridian. It should also be noted that the computed mean speed does not apply to the vessel mean speed. This is because a single mean for a vessel is not computed, but rather all received SOG values are included in the mean. Thus, the slower vessels will contribute more positional reports to a grid cell as compared to the fast vessels, thereby skewing the results.
Average speed based on AIS SOG values for the globe, over the period 1 November 2013 to 30 April 2014. Land mask and Exclusive Economic Zones (bold line polygons) are included. The figure represents a composite of 1·4 billion SOG reports.

The addition of the EEZ provides contextual information that may be relevant to patterns noted in the figure. For example, low speed cells are evident in numerous areas that appear adjacent to the EEZ. Examples of this include the ~1,000 km diameter area of low speed cells in the South Pacific Basin directly west of Peru (i.e., denoted with letter A); and the area of Flemish Cap directly east of Newfoundland, Canada (i.e., denoted with letter B). These low speed areas are thought to be the result of fishing activityFootnote 3 .
The COG values were also used to obtain an indication of vessel direction. COG values could have been vector averaged, but this tended to produce a cancelling effect in areas with bidirectional traffic. Rather than computing the vector average using the COG values, we consider the predominant direction of vessel traffic in each grid cell.
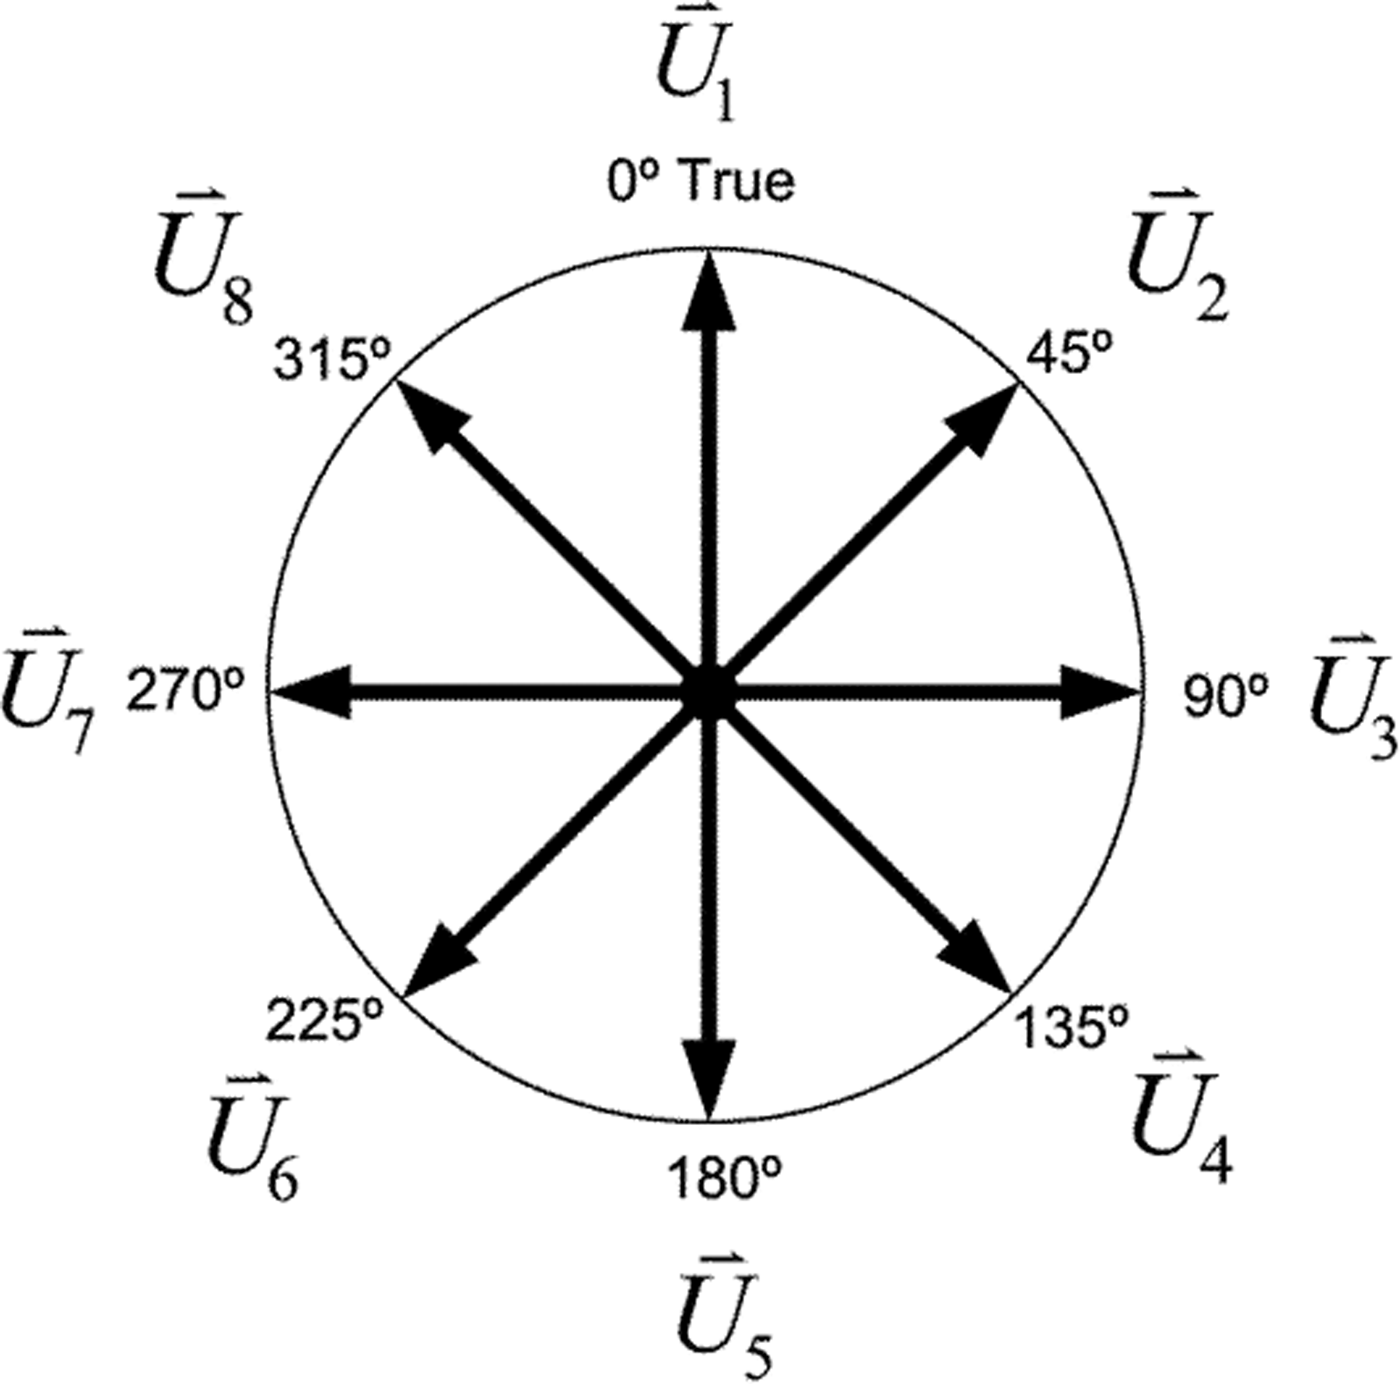
For the following, the COG values within the cell are used to define predominant direction as follows: using each COG, define a vector of length one as
 $\; {\mathop{COG}\limits^{-\!\!-\!\!\rightharpoonup}}_q$
, where q
max
represents the total number of vectors within a particular cell. Next, form the dot product between an individual
 ${\mathop{COG}\limits^{-\!\!-\!\!\rightharpoonup}}_q$
vector and each of the unit vectors shown in Figure 6 (Equation (1)).
 $$f\left( n \right) = \; {\mathop{COG}\limits^{-\!\!-\!\!\rightharpoonup}}_{q} \cdot \; {{\mathop{U}\limits^{\rightharpoonup}}_n}:\; n = 1,\;.., \; 8$$
A rosette of unit vectors used to identify the predominant direction of COG values for each grid cell.

The maximum dot product (Equation (2)) is then determined, thereby defining the index of the unit vector, m q , most closely aligned with the COG vector.
 $$f\left( {m_q} \right) = \max \left( {f\left( n \right)} \right):\; m_q \in n$$
Considering the set of
 ${\mathop{COG}\limits^{-\!\!-\!\!\rightharpoonup}}_q:q = 1, \ldots, \; q_{max}$
vectors within the cell, sum the occurrences (Equation (3)) of a particular unit vector being selected as the vector most closely aligned with the
 ${\mathop{COG}\limits^{-\!\!-\!\!\rightharpoonup}}_q$
vector.
 $$C\left( n \right) = \; \mathop \sum \limits_{q = 1}^{q_{max}} \delta _{n,\; m_q}$$
Define the maximum count of occurrences, C(p) (Equation (4)). The index p then indicates the unit vector
 ${\mathop{U}\limits^{\rightharpoonup}}_p$
that defines the predominant direction of traffic for that grid cell.
 $$C\left( p \right) = \; max\left( {C\left( n \right)} \right)\; :\; p \in \; n\; $$
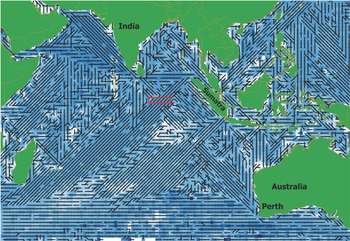
Figure 7 shows the Indian Ocean portion of the world predominant direction fieldFootnote 4 . Recall that there is no meaning to the length of the vector while the direction indicates a predominant number of COG values in approximately that direction.
Predominate direction vectors formed from AIS COG values for the Indian Ocean. Underlying colour represents mean SOG values using the same colour scale as indicated in Figure 6.

Several patterns emerge in Figure 7 including the tendency of AIS COG to indicate traffic movement from northern Sumatra toward the south west; while at the southern end of Sumatra the AIS COG direction is reversed. The AIS COG values also indicate a traffic pattern from Perth Australia towards India. However, this pattern is visually dominated by the vectors to/from Sumatra. This is indicated by the patterns to/from Sumatra dominating those areas that intersect the pattern from Perth.
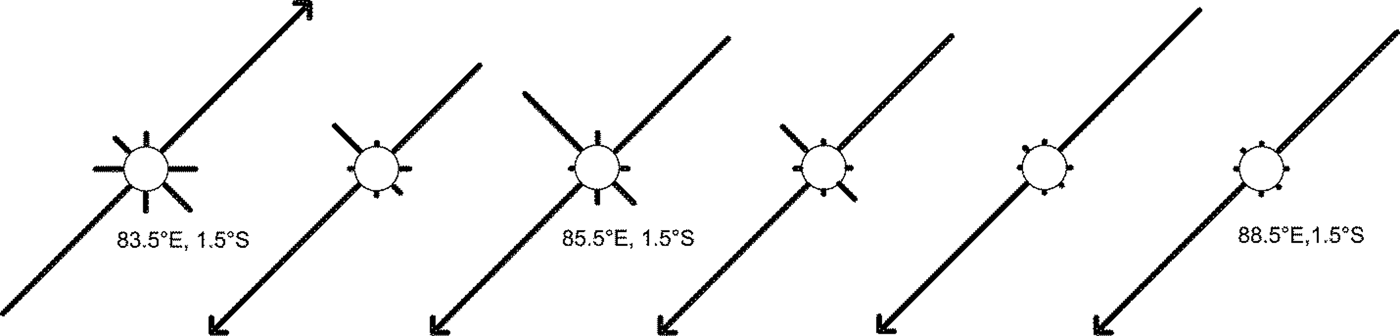
The intersection of the vessel traffic patterns is further exemplified in Figure 8. This figure shows the eight direction vectors contained in each grid cell, for the area indicated by the red box in Figure 7. A total of six grid cells are shown, with the vector lengths indicating relative scale as compared to the maximum (i.e. predominant direction). Figure 8 indicates how the traffic in cell 83·5°E, 1·5°S is primarily bi-directional but in cell 85·5°E, 1·5°S the influence of the Perth to India COG values begins to show a substantive vector at 315°T.
All eight directional vectors for the region indicated in Figure 7 in the red box. Vectors have been scaled according to the maximum number of occurrences of the predominant unit vector for the particular cell. Predominant direction shown as the vector with an arrow head.

5. CONCLUSIONS
Given modern day maritime data sources, research in MDA now requires considerable attention be paid to information management. In the past, data volumes of 181,000 reports per month were available from global sources while present day conditions result in the accumulation of comparable volumes in minutes. This paper has shown that suitable information structures, in combination with open-source software solutions, can handle the data volume associated with present day MDA sources. The Maritime Situational Awareness Research Infrastructure (MSARI) was designed based on a data model that relies on the use of data types specific to the incoming vessel attributes and on inheritance functionality built into the database management system. MSARI has been tested under conditions involving data volumes of about 66 million reports per day while continuing to support a research team involved in the exploitation of MDA-relevant data. The data volume being amassed within MSARI allows the researcher to explore global traffic patterns that may be of use to communities interested in the maritime domain.