Introduction
During the second half of the 19th century, railway passenger traffic began, and there were few major injury incidents because of limited traffic and low speeds.Reference Brandsjö1 The railroad system underwent further technical and safety development during the 20th century, especially during the second half of the century. Over the last decades, train speeds have increased2 in many countries, and new high-speed lines (>250 km/h; 155 mph) are inaugurated frequently throughout the world.3,4 Currently, several trains operate at 300 km/h (186 mph).5 The Maglev (magnetic levitation) Transrapid train in Shanghai operates in regular traffic at speeds up to 430 km/h (267mph).6
Because of today’s high speeds, severe damage and injuries are to be expected in a crash.Reference Hambeck and Pueschel7–Reference Weyman, O'Hara and Jackson20 Further complications can arise because crashes may happen in remote areas without access to roads and with limited rescue resources. Unprepared/untrained personnel may experience difficulties while managing these events. Some studies have shown that such shortcomings have caused a number of “avoidable deaths”.Reference Hambeck and Pueschel7,Reference Robinson21 Rail passenger traffic will continue to increase along with higher speeds and more passengers. The complex nature of responding to such events makes pre-event planning and training essential. As a basis for planning and training in different continents and countries, this study aims to shed light on the magnitude and development of passenger rail crashes over the years in various continents and countries.
Methods
A 100-year dataset, from 1910–2009 was made available from the Centre for Research on the Epidemiology of Disasters (CRED), which maintains the Emergency Events Database (EM-DAT), a worldwide database on disasters. Disasters included in this study were selected on two of CRED’s criteria defining a disaster:22 10 or more people reported killed and/or; ≥100) or more people reported affected.
Events caused by intentional acts were excluded from the database. Within the criterion “affected”, a further sample specification was made to include only events resulting in ≥100 non-fatally injured victims. A total of 529 railway crashes were included. Of these 529 incidents, six were subway disasters and one was a Maglev disaster. Supplementary data also have been collected via different scientific and Internet sources using suitable keywords. Additionally, transport literature and media, including films and documentaries, were analyzed.
The EM-DAT categorizes the world into five continents (Europe, Asia, Africa, Americas, and Oceania). Because of socio-demographic reasons, the American continents were divided into “North” (USA and Canada) and “South and Central America”, respectively.
EM-DAT Data Inclusion Methodology
The EM-DAT database is compiled from various sources, including United Nations (UN) agencies, non-governmental organizations insurance companies, research institutes, and press agencies. The CRED has established a method of ranking these sources according to their ability to provide trustworthy and complete data. The disaster occurrence, in terms of fatalities, injuries, or affected only is entered into the EM-DAT if at least two sources report exact values. Priority is given to data from UN agencies, followed by the Office of Foreign Disaster Assistance governments, the International Federation of Red Cross and Red Crescent Societies. This prioritization is not only a reflection of the quality or value, of the data, but also reflects the fact that most reporting sources do not cover all disasters, or may have political limitations that may affect the figures. The record is validated before final figures and relevant information is available to the public three months later. Annual revisions are also made one, two, and sometimes three years after the event.23
Results
100 Years
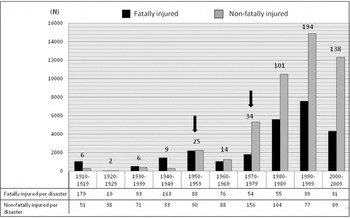
Railway disasters were relatively infrequent (23/529; 4%) during 1910–1949. During the following two decades (1950–1969), the rate began to increase, 39 of the 529 (7%) disasters occurred during these two decades (Figure 1). Since the 1970s, the number of railway disasters (n = 467; 88%), as well as the number of fatally and non-fatally injured, has increased. The highest rates are found during the last three decades (1980–2009). The average number of passengers killed per railway disaster was 135 during 1910–1949; 84 during 1950–1969; and 41 between 1970–2009. The number of non-fatally injured people per disaster during the different time periods has been 48, 89, and 92, respectively. During 1910–1949, the number of non-fatally injured was only 0.4 times the number of deaths, but during the 1950s and 1960s, the number of non-fatally injured was about the same (1.1) as the number of deaths. From the 1970s, the number of non-fatally injured has averaged 2.2 times the number of deaths (Figure 1). The variation in total number of fatally and non-fatally injured per disaster has shown a slight decreasing trend; 184, 173, and 133, respectively for the three time periods.
Number of fatally and non-fatally injured per disaster during 1910–2009 and the number of railway disasters (figure above the columns). The arrows indicate important shifts in train constructions and safety implementations.

Distribution by Continents and Countries 1970–2009
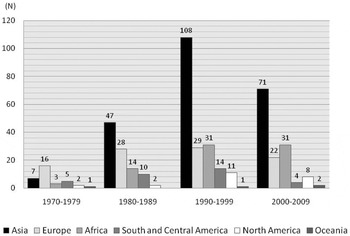
Disasters in Different Continents—Of 467 railway disasters during the last four decades (1970–2009), the highest reported number (n = 233; 50%) occurred in Asia, followed by Europe (n = 95; 20%), Africa (n = 79; 17%), South and Central America (n = 33; 7%), North America (n = 23; 5%), and Oceania (n = 4; 1%). In the 1970s, Europe reported the highest frequency, but since the 1980s, Asia has had the highest number per decade. During the 1990s, Africa has surpassed Europe and ranked in the last two decades (Figure 2).
Number of railway disasters during 1970–2009 classified by continent

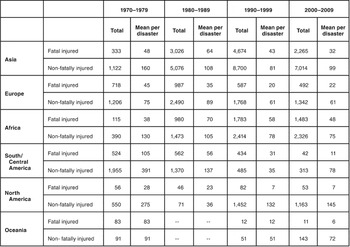
The highest number of fatalities from 1970–2009 (10,298 of 19,348; 53%) occurred in Asia, followed by Africa (4,361; 23%), Europe (2,784; 14%), South and Central America (1,562; 8%), North America (237; 1%), and Oceania (106; 1%). In terms of fatally and non-fatally injured (losses), Asia, Africa, and Europe reported the highest losses, but the development in different continents were different during the period 1970–2009. Asia, Africa, and North America had an increase in losses (except for the last decade in which the upward trend declined slightly), and South and Central America reported a decrease in losses. Europe and Oceania showed only minor changes (Table 1).
Number of fatal and non-fatally injured classified by decade and continent

In terms of number of people killed, Africa experienced an increase of 198% (1,095 vs. 3,266) between the first and second half of the period, 1970–2009, Asia had an increase of 107% (3,359 vs. 6,939), and North America 32% (102 vs. 135). On the contrary, South and Central America had a decrease of 56% (1,086/= vs. 476) and Europe had a 37% reduction in the number of killed (1,705 vs. 1,079). The average fatality rate per event was highest in Africa (55), followed by South and Central America (47) and Asia (44), while it was only 29 in Europe, 27 in Oceania, and 10 in North America.
In terms of non-fatally injured, the increase for the years 1970–1989, compared with 1990–2009, was 321% (621 vs. 2,615) in North America, 154% (1,863 vs. 4,740) in Africa and 154% (6,198 vs. 15,714) in Asia. A decrease of 76% (3,325 vs. 798) was reported from South and Central America and 16% (3,696 vs. 3,110) from Europe.
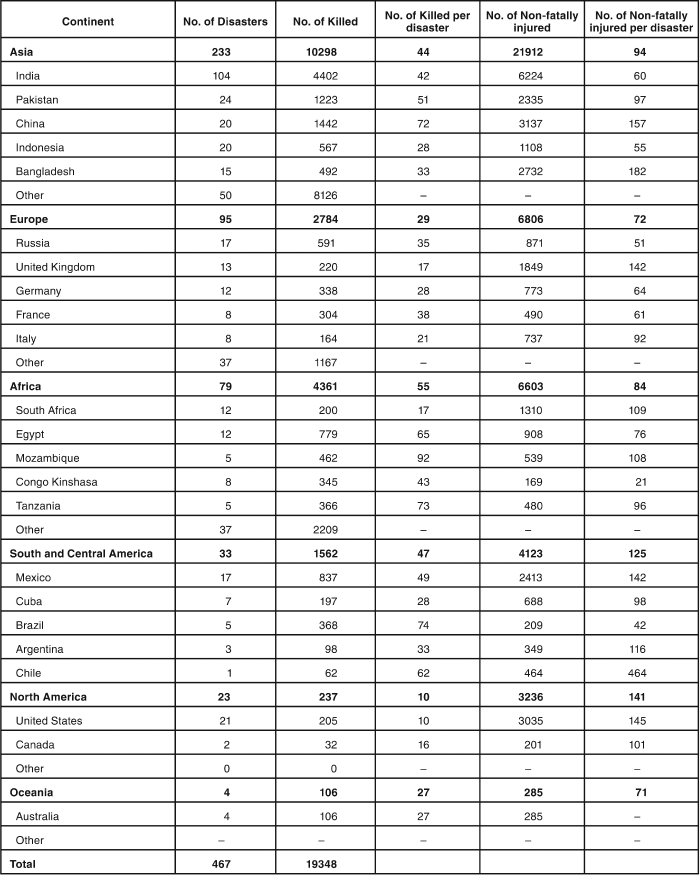
Disasters in Different Countries—On the Asian continent, India reported the most railway disasters (104 of 233; 45%) followed by Pakistan (24; 10%). On the African continent, most disasters were reported from South Africa (12 of 79; 15%) and Egypt (12; 15%). In Europe, Russia reported most railway disasters (17 of 95; 18%) followed by the United Kingdom (13; 14%). In South and Central America, Mexico reported more than half of all disasters (17 of 33; 52%) followed by Cuba (7; 21%). In North America, 21 (91%) of the 23 disasters happened in the US (Table 2).
Number of railway disasters “top five” in different continents and countries during the last decade (1970–2009)
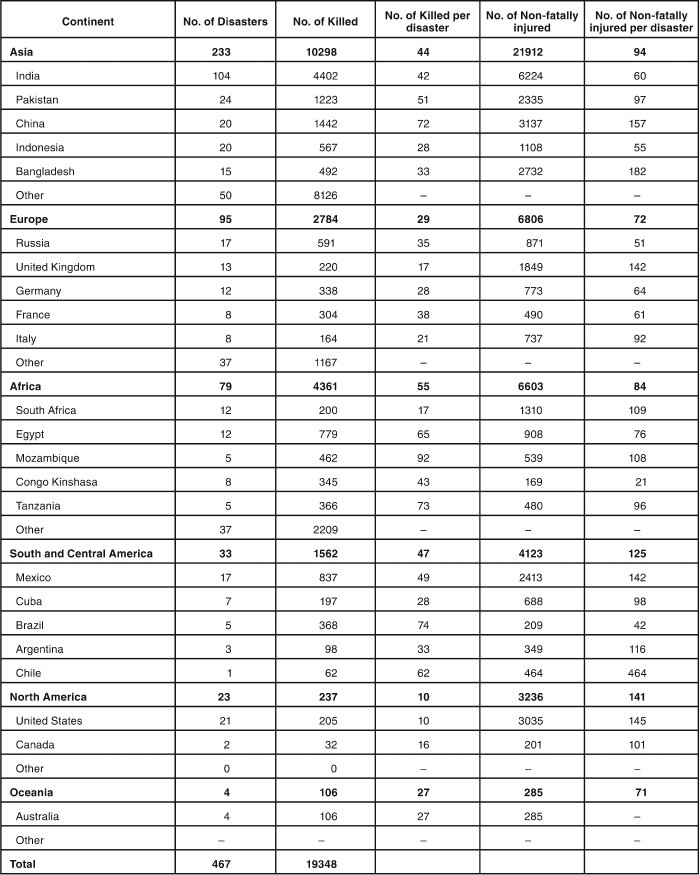
Within the Asian continent, India had the highest number of people killed (4,402 of 10,298; 43%). In Africa, it was Egypt (779; 18%), in Europe, it was Russia (591; 21%), in South and Central America, it was Mexico (837; 54%) and for North America, it was the US (205; 86%). The fatality rate per disaster, nonetheless, differs within the continents. South Africa had the highest number of reported railway disasters (n = 12) tied with Egypt (n = 12) in Africa, but South Africa had a notably lower rate of average number of people killed per disaster (n = 17) compared to Angola (n = 300) and Ethiopia (n = 131). Azerbaijan (n = 337), and North Korea (n = 121) had the highest number killed per disaster within the Asian continent. Japan had 33 killed per disaster, close to the average for Asia. In Europe, it was Austria (n = 80) and Portugal (n = 70). Within the South and Central American continent, Brazil (n = 74) and Chile (n = 62) had the highest average killed. In North America, Canada and the US had 16 and 10, respectively (Table 1).
Discussion
The safety measures and systems introduced, especially during the last 3–4 decades, have not reduced the number of railway disasters, even though Fothergill et al Reference Fothergill, Ebbs, Reese, Partridge, Mowbray, Southcott and Hashemi9 have noted the crash-reducing effects of better signaling and other safety systems. In countries with rail traffic, it seems wise to plan and train for the needed complex responses and to prepare efficient cooperation with all other involved agencies; implementing what Oestern et al Reference Oestern, Huels, Quirini and Pohlemann12 recommended after the 1998 high-speed train crash in Eschede.
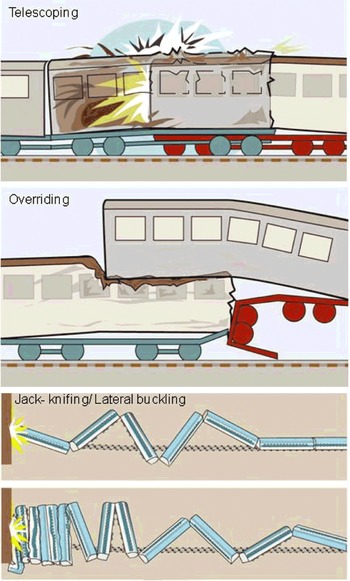
Railway disasters were relatively rare before 1970, as only 12% of the disasters occurred during the first six decades of the study period. This was probably due to lower speeds and less passenger-kilometers traveled. Those passengers involved, however, more often suffered fatal injuries, as the rail carriages were made of wood. In a crash, the wooden carriages disintegrated in a manner called “telescoping” (Figure 3). Additionally, the crashes were more commonly complicated by fireReference Kichenside24,25 and rescue techniques and resources may have been limited. The number of deaths per disaster was highest prior to 1950 (135), but decreased to 41 after 1970, indicating an improvement in safety, crashworthiness, and rescue efficiency.
(Color online) Different crash-phenomena: Telescoping, overriding, and jack-knifing/lateral buckling. (Illustrator: Gunilla Guldbrand)

During the 1950s, metal carriages replaced most wooden carriages. Metal carriages absorbed the kinetic energy better than those made of wood, and therefore, emerged from a crash relatively intact. After the 1950s, the ratio of non-fatally injured to the number of fatalities started to increase. Although metal carriage design minimized the telescoping problem, it inadvertently created another dangerous phenomenon called “overriding” (Figure 3). This is when one carriage overrides another and crashes down on the passengers below. Corrugated metal plates known as “anti-climb” devices and crash-zones later were introduced to minimize this risk. However, a new phenomenon called “jack-knifing”, or lateral buckling (Figure 3), developed. Upon impact, the train carriages derail and collide into each other’s sides, resulting in the carriage sidewalls collapsing inward, injuring the passengers.Reference Björnstig, Forsberg, Koenig and Schultz26
Because the last two crash phenomena currently are the most common worldwide, they would be the basis for developing a suitable tactical approach to overcome the special rescue and evacuation complications.Reference Oestern, Huels, Quirini and Pohlemann12,Reference Stevens and Partridge19,Reference Braden27Reference Cooksey28 The lack of heavy rescue equipment also has been as a significant problem, as emphasized by several authors.Reference Nagata, Rosborough, VanRooyen, Kozawa, Ukai and Nakayama13,Reference Weyman, O'Hara and Jackson20 Further, Nagata et al emphasized the need for training in confined-space-medicine, since this was a lifesaving tactic used for trapped victims in the 2005 crash in Amagasaki, Japan.Reference Nagata, Rosborough, VanRooyen, Kozawa, Ukai and Nakayama13 Moreover, Hambeck et al Reference Hambeck and Pueschel7 and RobinsonReference Robinson21 demonstrated the need for rapid extrication of the injured. They found that a number of victims might have survived if they had been extricated more quickly. Additionally, interior design and baggage stowage have been reported to interfere with injury panoramaReference Fothergill, Ebbs, Reese, Partridge, Mowbray, Southcott and Hashemi9,Reference Madsen15,Reference Braden18,Reference Braden27,Reference Cugnoni, Fincham and Skinner29–Reference Eriksson, Ericsson, m and Thorson31 and rescue procedures.Reference Braden18,Reference Weyman, O'Hara and Jackson20
Examining the last four decades (1970–2009) more closely, the number of railway disasters, as well as the number of fatalities and non-fatal injuries, has increased despite all safety measures implemented. (cf. air traffic—the number of fatalities has decreased to 1/5 during the same time period). Factors related to this increase may be more passenger-kilometers traveled, more passengers inside each train carriage, and higher speeds. Improvements in crash safety probably contributed to the relation between fatal and non-fatal injuries shifting after 1970 to 1:2.2. Even when the number of fatalities per disaster consistently decreased, the number of non-fatal injuries per disaster has not decreased.
Older trains were engine-powered and oversized; they did not have passengers in the first carriage (engine). In contrast, modern interchanged multiple-unit trains carry passengers in the first carriage, exposing them to greater risks.Reference Hambeck and Pueschel7,Reference Prabhakar and Sharma10,Reference Weyman, O'Hara and Jackson2032 Moreover, they are built of stainless steel or aluminum, making them less robust. On the other hand, these newer trains include deformation zones providing an added element of safety that did not exist on older trains.
It was noted that Asia (2010 billion passenger-kilometers), especially India (838 billion passenger-kilometers), reported the most rail passenger-kilometers traveled in 2009 as well as prior years.33 This partially may explain why most railway disasters, nowadays, happen in this region. Compared with other regions, the lower safety standards and train crashworthiness of several countries in Asia, Africa, and Central and South America are important factors resulting in high rates of fatalities per disaster to which overcrowded trains carrying passengers on the roofs and hanging out through windows contribute. Passengers riding in these manners may be predisposed to major injuries. Window bars and locked doors, as used in some regions, can be factors aggravating an incident especially when there is fire involved. The bars and locks not only make it difficult to exit the carriages, but may also hamper rescue operations.
Limitations
Information systems have improved immensely over the last decades and data are now more easily assessable and reliable.Reference Guha-Sapir, Below and Hoyois34 Because only severe railway incidents (≥10 killed and/or ≥100 people non-fatally injured) are included in this study, the number of missed disasters is probably low.
Train disasters caused by intentional antagonistic acts such as terrorist attacks and warfare are not included in this database. Even so, in a few cases of the selection procedure, it might have been difficult to ascertain whether the disaster was intentionally caused or not.
Changes in national boundaries can cause ambiguities; most notably, the break-up of the former Soviet Union and the former Republic of Yugoslavia, and the reunification of Germany.Reference Guha-Sapir, Below and Hoyois34 Therefore, up-to-date boundaries have been used.
Comparison of passenger-kilometers traveled in different continents and regions is made with the knowledge that only International Union of Railways (UIC) members are represented in the statistics. Therefore, the number of kilometers traveled should be considered as approximate.
Conclusions
The trends identified indicate that the crash avoidance and safety measures worldwide have not been able to reduce the number of railway disasters, making this a reality requiring planning and training in many countries. High-speed rail constructions will place new demands on the tactics, techniques, and equipment used by rescue personnel. These elements are the basis for good disaster preparedness. Measures to facilitate rescue and escape routes, especially in overturned carriages, would be valuable. Furthermore, safer interior design and safer baggage stowage would have a potential to reduce injuries and to facilitate rescue and evacuation.
Acknowledgements
The authors thank CRED for providing the data, the Swedish National Board of Health and Welfare, the European Regional Development Fund (ERDF), and the Swedish Civil Contingencies Agency (MSB) Sweden for financial support and valuable information about railway safety issues. We also express our appreciation to the language revisers, Loren Gill and Michael Haney for reviewing the manuscript.
Abbreviations:
CRED = Centre for the Research on the Epidemiology of Disasters
EM-DAT = Emergency Events Database