Implications
There is a lack of information about the concerted changes related with muscle remodeling during recovery weight gain observed in ‘realimentation’ after undernutrition, which may be limited in old animals such as cull cows under grazing. The results showed changes during recovery gain with impact on few important genes involved in regulatory pathways of muscle growth, without affecting the major genes related to connective tissue when compared with fat animals. The latter presented upregulation of genes related to adipose tissue deposition. This is a contribution to scientific knowledge about muscle remodeling during recovery gain in mature animals. However, the transcriptome for proteases and related to collagen and other major extracellular matrix components was not affected during the recovery growth.
Introduction
There is growing interest in studying gene expression associated with muscle structural remodeling due to nutritional challenges (Byrne et al., Reference Byrne, Wang, Lehnert, Harper, Mcwilliam, Bruce and Reverter2005; Lee et al., Reference Lee, Engle and Hossner2002) to improve our understanding of the impact of these genes on the phenotypic characteristics of animals. Although animals from different breeds, including early- and late-maturing biological types, differ in tissue growth, carcass composition and marbling (Cuvelier et al., Reference Cuvelier, Cabaraux, Dufrasne, Clinquart, Hocquette, Istasse and Hornick2006), the changes in gene expression reported in the literature point to the possibility of modifying structures that are part of the muscle physiological pathways. These are ultimately involved in meat tenderization, regulating genes from the intermediary metabolism as well as those involved in connective tissue turnover, which may be compromised by caloric restriction (Byrne et al., Reference Byrne, Wang, Lehnert, Harper, Mcwilliam, Bruce and Reverter2005).
Compensatory growth alters the response of cells based on endocrine status and nutrient availability. These integrated signals are reflected in one of the key hormones related to growth rate, IGF-I, which plays a role in protein synthesis (Ellenberger et al., Reference Ellenberger, Johnson, Carstens, Hossner, Holland, Nett and Nockels1989) and satellite cell proliferation and differentiation (Barton-Davis et al., Reference Barton-Davis, Shoturma and Sweeney1999). The IGF-I action mode involves its binding proteins (IGFBP), which transport it in the blood and are also altered during feed restriction (Lee et al., Reference Lee, Hidari, Kang, Hong, Xu, Kim, Seo, Yoon and Choi2005). The IGFBPs protect IGFs against proteolysis and potentiate or inhibit its biological actions (Clemmons, Reference Clemmons1998) or function through IGF-independent mechanisms (Xi et al., Reference Xi, Kamanga-Sollo, Hathaway, Dayton and White2006). Moreover, before muscle tissue renewal starts, an inflammatory response is stimulated, with invasion of macrophages followed by the formation of new myofibers and then remodeling (Ciciliot and Schiaffino, Reference Ciciliot and Schiaffino2010). If these events are not coordinated, an accumulation of extracellular matrix occurs, causing fibrosis (Mann et al., Reference Mann, Perdiguero, Kharraz, Aguilar, Pessina, Serrano and Muñoz-Cánoves2011); this is more significant in adult animals. The remodeling is likely muscle-dependent as muscles respond differently to compensatory growth, with changes in collagen properties according to muscle responses to restricted feeding levels (Cassar-Malek et al., Reference Cassar-Malek, Hocquette, Jurie, Listrat, Jailler, Bauchart, Briand and Picard2004).
In theory, diets that promote rapid growth can lead to increased rates of protein turnover, including turnover of collagen molecules (Archile-Contreras et al., Reference Archile-Contreras, Mandell and PURSLOW2010). This increase in collagen turnover has been observed during recovery gain after a period of BW loss. Our hypothesis was that a moderate growth rate during body condition recovery is sufficient to elicit changes in gene expression that are related to muscle extracellular matrix (ECM) renewal. The aim of this study was to evaluate transcriptome changes in the muscle of Nellore cull cows subjected to recovery weight gain under grazing conditions.
Material and methods
Treatments
All experimental procedures were approved by the environmental (CEAP; protocol no. 66) and animal (CEUA) ethical committees of the Luiz de Queiroz College of Agriculture, University of São Paulo. The experiment took place at the Brazilian Beef Cattle Research Center with 38 Nellore cull cows, aged 4 to 12 years, that were kept under grazing condition on pasture of Brachiaria decumbens grass, randomly divided into two groups based on body condition score (BCS): (1) Maintenance group (MA) – cows (age=6.68 years ± 0.42; initial live weight=490 kg ± 7.80) maintained at high BCS (initial=8.42±0.05) under grazing with high forage availability during the entire experimental period; and (2) Recovery gain group (RG) – cows (age=7.28±0.48; lLW=411.42±4.22) with low BCS (initial 5.05±0.14) due to weight loss at overgrazed pasture during 129 days (pre-experimental period) followed by weight gain and BCS recovery under high forage availability. All the animals were given mineral supplementation.
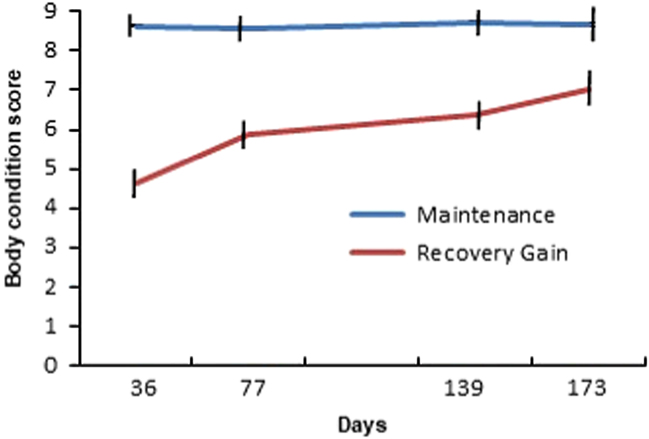
The animals were serially slaughtered at the Meat Laboratory of the Beef Cattle Research Center/EMBRAPA in Campo Grande/MS – Brazil, starting after 36 days (n=10; MA=5 v. RG=5) days into experimental conditions (grazing on pasture with high forage availability), followed by slaughters at 77 (n=10; MA=5 v. RG=5), 139 (n=10; MA=5 v. RG=5) and 173 (n=8; MA=4 v. RG=4) days of high forage availability. The slaughter intervals were set to ~35 days, but also considered noticeable increment in BCS in the RG group (Figure 1). Immediately after slaughter, samples of Longissimus thoracis muscle were collected and frozen in liquid nitrogen (−80°C). They were kept frozen at −80°C until sequencing analysis could be performed. The differences between groups used the gene expression data of all the animals from each treatment, not considering the slaughter time. Our approach was to identify genes that consistently changed in the growth curve during the recovery gain.
Body condition score (BCS) from mature Nellore cull cows under maintenance of high body score v. recovery gain at grazing conditions. Maintenance group: cows maintained at high body condition score (BCS>8; 1 – being extremely thin, 4 – bone structure no longer noticeable and 9 – very fat) under grazing with high forage (Brachiaria decumbens) availability. Recovery gain group: cows with low body condition score (BCS~5) due to weight loss under overgrazed pasture, followed by BCS recovery under high forage (B. decumbens) availability. The slaughters started after 36 days into experimental conditions (grazing on pasture with high forage availability). Bars indicate standard error.

RNA extraction, library and sequencing
Extraction of RNA from L. thoracis muscle samples (100 mg) from each animal (n=38) was performed using 1 ml of Trizol reagent (Life Technologies, Carlsbad, CA, USA). The extracted RNA was quantified using a spectrophotometer (NanoDrop 200; Thermo Scientific, Wilmington, DE, USA). The integrity of the material was verified using 1% agarose gel and a 2100 Bioanalyzer (Agilent Technologies, Santa Clara, CA, USA) (RIN: RNA Integrity Number). Only samples with RINs >7 were used for the next steps. After this stage, 2 µg of total RNA from each sample was purified and fragmented using a TruSeq RNA Sample Prep Kit v2. RNA messenger molecules (2% to 4% of the total RNA) were split from the remaining RNA by connecting them to poly-T tails adhered to magnetic beads. After being purified and fragmented, the first complementary DNA (cDNA) tape was synthesized using random primers (hexamers) and reverse transcriptase enzyme; once synthesized, it was passed to the messenger RNA removal step for synthesis of the second cDNA tapes, which were purified using magnetic beads (Agencourt® Ampure XP; Brea, California, United States).
The double cDNA tapes were repaired to stand ‘blunt end,’ followed by adenylation of the 3’ extremities and the correct connection of the adapters, which are necessary for correct hybridization in the flow cell and allow molecule sequencing. Next, the DNA fragments were enriched via PCR; only the fragments with adapters were selected and amplified using specific primers that connected themselves to the end of the adapters. This library was then purified and validated in a Bioanalyzer, which measured the quantity and size of the fragments present in the sample. All samples were diluted to 10 nM as in this stage, it is possible to multiplex the samples through specific index usage (7 bp oligonucleotides). After the preparation phase, the samples were clustered in flow cell cBot (Illumina, San Diego, CA, USA). After clustering, the flow cell with 38 libraries was sequenced in HiScanSQ (Illumina) at the Genomics Center, University of Sao Paulo/ESALQ, Piracicaba, São Paulo, Brazil. A read was defined as a 100 bp cDNA fragment sequenced from a paired end.
Mapping and counting reads
The sequencing data quality was evaluated with FastQC (http://www.bioinformatics.bbsrc.ac.uk/projects/fastqc/). Seqclean software (https://bitbucket.org/izhbannikov/seqyclean/downloads) was used with 24 Phred quality parameters for maximum average error. Vector and adaptor sequences from the UniVec database (https://www.ncbi.nlm.nih.gov/tools/vecscreen/univec/) were used as a guide to remove possible contaminants from the quality filter. The reads were mapped using TopHat 2.0.10 (Trapnell et al., Reference Trapnell, Pachter and Salzberg2009) and Bowtie2 v2.1.0 (Langmead et al., Reference Langmead, Trapnell, Pop and Salzberg2009) against the UMD3.1 Bos taurus taurus masked genome available at Ensembl (http://www.ensembl.org/Bos_taurus/Info/Index/), with a maximum of one mismatch allowed. To quantify the read counts, the HTSeq v0.5.4p2 program (Anders and Huber, Reference Anders and Huber2010) was used with the model nonempty intersection; reads that aligned on more than one gene were considered ambiguous and were not counted. Normalization of the expression analysis data was performed by the R differential gene expression analysis package (DESeq2) (Love et al., Reference Love, Huber and Anders2014).
Statistics
Differentially expressed genes between treatments (MA×RG) were identified using the DESeq2 package from R/Bioconductor (Love et al., Reference Love, Huber and Anders2014). The -in function ‘estimate Size Factors’ was used to obtain the normalized counts, that is, baseMean values, which are the number of reads divided by the size factor or normalization constant. Transcripts with baseMean<5 considering all samples were removed to avoid artifacts due to low coverage. The method used to test for differential expression was the negative binomial distribution, followed by false discovery rate (Benjamini and Hochberg, Reference Benjamini and Hochberg1995). A multifactor design was performed where the growth rate was the variable of interest, and the age was accounted as the controlled variable that might contribute to the changes on the treatment (the type variable in a design=~type+condition).
Enrichment analysis
The Functional Annotation Clustering function of the Database for Annotation, Visualization and Integrated Discovery (DAVID) v. 6.7 (Huang et al., Reference Huang, Sherman and Lempicki2009) used the GOTERM, Sp_Pir_KEYWORDS and KEGG_PATHWAY analyses to create clusters that showed decreasing values of enrichment scores for the genes. The Benjamini and Hochberg correction applied to the DAVID enrichments was the P-value adjusted to ≤ 0.09. Only genes that were differentially expressed (P-value ≤0.001 and P-value adjusted ≤0.2) were submitted to enrichment analysis.
Uncharacterized proteins, microRNA targets, and Ingenuity Pathway Analysis
The uncharacterized differentially expressed genes were annotated by comparison with orthologous genes at BioMart Ensembl (http:www.ensemble.org/biomart). Analysis of the microRNA targets was performed by the TargetScanHuman database (http://www.targetscan.org/) and miRBase (http://www.mirbase.org/). In addition, enrichment analysis was performed using QIAGEN’s Ingenuity Pathway Analysis (IPA; Qiagen Redwood City, CA, USA; www.qiagen.com/ingenuity). We used IPA to identify upstream genes in the dataset that could potentially explain the observed genes expressed in our data (target molecules).
Results
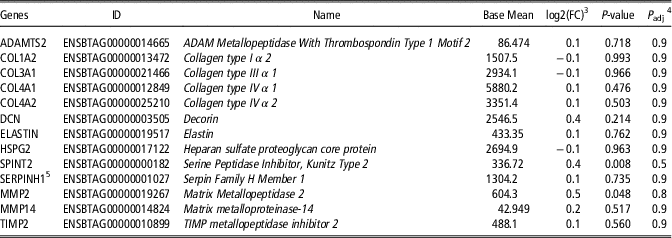
Identification of 13 145 genes in the muscle transcriptome was possible following quality filtering, alignment and normalization procedures. There were no changes in the expression of genes that have been reported playing major roles in the strength of the matrix, such as: ADAM Metallopeptidase with Thrombospondin Type 1 Motif 2, Collagen type I α 2, Collagen type III α 1, Collagen type IV α 1, Collagen type IV α 2, Decorin, Elastin, Heparan sulfate proteoglycan core protein, Serine Peptidase Inhibitor, Kunitz Type 2, Serpin Family H Member 1, Matrix Metallopeptidase 2, Matrix Metalloproteinase-14, TIMP Metallopeptidase inhibitor 2 (Table 1). Those results indicate that components related to connective tissue scaffolding maybe were not modified.
Major extracellular matrix-related candidate genes in Longissimus thoracis muscle from mature Nellore cull cows under maintenanceFootnote 1 of high body condition score (BCS) v. recoveryFootnote 2 gain at grazing conditions

1 Maintenance group: cows maintained at high BCS (BCS>8; 1 – being extremely thin, 4 – bone structure no longer noticeable and 9 – very fat) under grazing with high forage (Brachiaria decumbens) availability.
2 Recovery gain group: cows with low BCS (BCS~5) due to weight loss under overgrazed pasture, followed by BCS recovery under high forage (B. decumbens) availability.
3 log2 (FC): log2(fold change); negative values: upregulation in maintenance; positive values: upregulation in recovery gain.
4 P adj: adjusted P-value for multiple testing with the Benjamini–Hochberg procedure (false discovery rate).
5 HSP47.
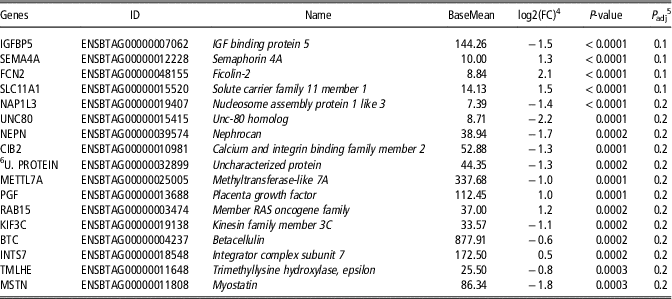
Insulin-like growth factor binding protein 5 (IGFBP5), Semaphorin 4A (SEMA4A), Ficolin-2 (FCN2), Solute carrier family 11 member 1 (SLC11A1), Nucleosome assembly protein 1 like 3, Unc-80 homolog, Nephrocan (NEPN), Calcium and integrin binding family member 2, Uncharacterized protein, Methyltransferase-like 7A (METTL7A), Placenta growth factor (PGF), Member RAS oncogene family, Kinesin family member 3C, Betacellulin, Integrator complex subunit 7, Trimethyllysine hydroxylase, epsilon and Myostatin (MSTN), totaling seventeen genes, were differentially expressed (P adjusted<0.2)(Table 2) and were grouped by biological function through functional annotation clustering analysis. The distribution of fold-change data of the genes expressed in both treatments was homogeneous. The uncharacterized protein was annotated by comparison with orthologous genes at BioMart Ensembl and identified as transcripts METTL7A.
Differentially genes expressedFootnote 1 in Longissimus thoracis muscle from mature Nellore cull cows under maintenanceFootnote 2 of high body condition score (BCS) v. recovery gainFootnote 3 at grazing conditions

1 Annotated by BioMart Ensembl.
2 Maintenance group: cows maintained at high BCS (BCS>8; 1 – being extremely thin, 4 – bone structure no longer noticeable and 9 – very fat) under grazing with high forage (Brachiaria decumbens) availability.
3 Recovery gain group: cows with low BCS (BCS ~ 5) due to weight loss under overgrazed pasture, followed by BCS recovery under high forage (B. decumbens) availability.
4 log2 (FC): log2(fold change); negative values: upregulation in maintenance group; positive values: upregulation in recovery gain group.
5 P adj: adjusted P-value for multiple testing with the Benjamini–Hochberg procedure (false discovery rate).
6 U. protein – uncharacterized protein.
In the group of differentially expressed genes annotated by Biomart Ensembl, the METTL7A gene was expressed in two transcripts in the MA group. A greater abundance of MSTN transcripts, as well as IGFBP5 (Table 2), another protein related to growth factors, were also observed in the MA group. Transcripts for SEMA4A, Slc11A1, PGF and FCN2 were more expressed in the RG group (Table 3).
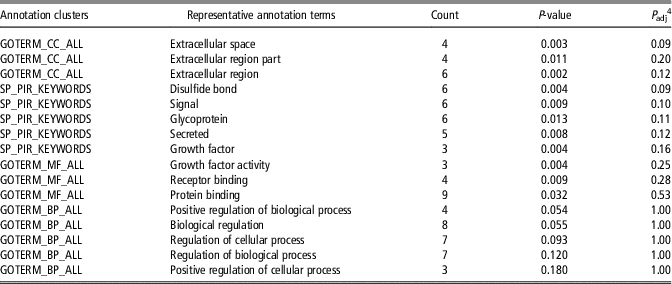
Functional Annotation ClusteringFootnote 1 of genes with main cellular, molecular and biological processes identified in Longissimus thoracis muscle from mature Nellore cull cows under maintenanceFootnote 2 of high body condition score (BCS) v. recovery gainFootnote 3 at grazing conditions

CC=cellular component; SP_PIR=single protein of protein information resource; MF=molecular function; BP=biological process.
1 Analyzed by DAVID tool (annotation clusters had a group of enrichment scores of 1.82).
2 Maintenance group: cows maintained at high BCS (BCS>8; 1 – being extremely thin, 4 – bone structure no longer noticeable and 9 – very fat) under grazing with high forage (Brachiaria decumbens) availability.
3 Recovery gain group: cows with low BCS (BCS ~ 5) due to weight loss under overgrazed pasture, followed by BCS recovery under high forage (B. decumbens) availability.
4 P adj: adjusted P-value for multiple testing with the Benjamini–Hochberg procedure (false discovery rate).
The enrichment analysis from DAVID Functional Annotation showed group functionally related to extracellular space (GOTERM_cellular component_ALL) and disulfide bond functional (Single protein of protein information resource_KEYWORDS) (Table 3). Others cluster that were not significant also appears as Signal (Single protein of protein information resource_KEYWORDS), Glycoprotein (Single protein of protein information resource_KEYWORDS), Extracellular region (GOTERM_cellular component_ALL), Secreted (Single protein of protein information resource_KEYWORDS), Growth factor (Single protein of protein information resource_KEYWORDS), Extracellular region part (GOTERM_ cellular component_ALL), Growth factor activity (GOTERM_molecular function_ALL), Receptor binding (GOTERM_molecular function_ALL), Protein binding (GOTERM_molecular function_ALL), Positive regulation of biological process (GOTERM_biological process_ALL), Biological regulation (GOTERM_biological process_ALL), Regulation of cellular process (GOTERM_biological process_ALL), Regulation of biological process (GOTERM_biological process_ALL), Positive regulation of cellular process (GOTERM_BP_ALL) (Table 3). In the RG group, FCN2 genes were clustered in the extracellular space and the disulfide bond cluster. PGF and SMA4A were also included in the disulfide bonds. From the enrichment data, it appears that NEPN was related to extracellular space (P<0.1) and MSTN to disulfide bonds (P<0.1) in the MG group.
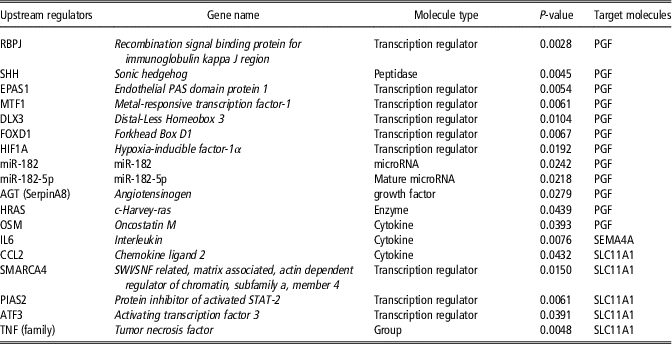
Recent advances allowed the understanding of the gene expression regulation using QIAGEN’s Ingenuity Pathway Analysis, which resulted in the identification of upstream regulators genes controlling upregulated expression in RG group as follow: Recombination signal binding protein for immunoglobulin kappa J region, Sonic hedgehog, Endothelial PAS domain protein 1, Metal-responsive transcription factor-1, Distal-Less Homeobox 3, Forkhead Box D1, Hypoxia inducible factor-1 α, miR-182, miR-182-5p, Angiotensinogen (AGT), Oncostatin M (OSM), c-Harvey-ras, SWI/SNF related, matrix associated, actin dependent regulator of chromatin, subfamily a, member 4 (SMARCA4), Tumor necrosis factor (TNF (family)), Protein inhibitor of activated STAT-2, Activating transcription factor 3, Chemokine ligand 2 (CCL2), Interleukin (IL6) (Table 4). Those genes were grouped in molecule type as a Transcription regulator, Peptidase, microRNA, Mature microRNA, Growth factor, Cytokine and Enzyme. One group of cytokines, represented by OSM, CCL2 and IL6 (Table 4), were identified as upstream regulators of SEMA4A, PGF and SLC11A1 in the RG group and the IGF-I was the upstream gene regulating the greater expression of IGFBP5 and MSTN (P=0.023) in the MA cows. This may indicate the idea that IGF-I, IGFBP5 and MSTN regulated muscle gain in those animals.
Upstream regulatorsFootnote 1 of upregulated genes expressed in Longissimus thoracis muscle from mature Nellore cull cows under maintenanceFootnote 2 of high body condition score (BCS) v. recovery gainFootnote 3 at grazing conditions

1 Genes regulators identified by Analysis by Ingenuity Pathway Analysis involved in upregulation of genes identified in the recovery gain treatment.
2 Maintenance group: cows maintained at high BCS (BCS>8; 1 – being extremely thin, 4 – bone structure no longer noticeable and 9 – very fat) under grazing with high forage (Brachiaria decumbens) availability.
3 Recovery gain group: cows with low BCS (BCS~5) due to weight loss under overgrazed pasture, followed by BCS recovery under high forage (B. decumbens) availability.
We observed two MicroRNAs (miR-182-5p and miR-182, Table 4), that are small noncoding RNA, as upstream regulator genes. The miR-182-5p (Table 4), was found as an upstream regulator of the PGF gene. This molecule has 345 predicted target transcripts with a total of 354 conserved sites and 72 poorly conserved sites. The other microRNA found (miR-182, Table 4) had 100 predicted target transcripts with sites, comprising 93 conserved sites and 112 poorly conserved sites.
Discussion
The METTL7A gene that was more expressed in the MA group is related to lipid metabolism (Brasaemle and Wolins, Reference Brasaemle and Wolins2012), specifically to lipid droplet formation (Bouchoux et al., Reference Bouchoux, Beilstein, Pauquai, Guerrera, Chateau, Ly, Alqub, Klein, Chambaz, Rousset, Lacorte, Morel and Demignot2011). This is to be expected as those animals presented high BCS associated with slight increase in LW during the experiment, which points to increased adiposity in the muscle with cessation of muscle cell growth. The latter process may be regulated by greater IGFBP5 expression in the MA cows, which would link to a decline in protein synthesis, considering that IGFBP5 is an important regulator of IGF-I local action (Jackman and Kandarian, Reference Jackman and Kandarian2004) by sequestering this growth factor and affecting protein accretion (Baxter, Reference Baxter2000). Nonetheless, IGFBP-5 may have effects that are unrelated to its IGF-regulatory role (Tripathi et al., Reference Tripathi, Salih, Drozd, Cosgrove, Cobb and Pell2009).
Moreover, MSTN transcripts (Table 2) presenting greater abundance in the MA group and is considered unique negative regulator of muscle mass (Rodgers and Garikipati Reference Rodgers and Garikipati2008). MSTN inhibits the expression of myogenic regulatory factors (Rios et al., Reference Rios, Carneiro, Arce and Devesa2002) and satellite cell proliferation (Fry et al., Reference Fry, Lee, Jackson, Kirby, Stasko, Liu, Dupont-Versteegden, Mccarthy and Peterson2014). The latter authors showed that proliferation is important in enabling muscle adaptation to hypertrophic growth in adults. Therefore, it seems plausible that cows under recovery weight gain, which are experiencing muscle hypertrophy, would present lower amounts of this negative growth regulator.
The extracellular tissue remodeling in the RG cows involved genes (SEMA4A and SLC11A1) related to immune response and defense. SEMA4A is part of a large family of extracellular proteins (Roth et al., Reference Roth, Koncina, Satkauskas, Crémel, Aunis and Bagnard2009), and is involved in the regulation of cell migration and muscle angiogenesis (Meda et al., Reference Meda, Molla, Pizzol, Regano, Maione, Capano, Locati, Mantovani, Latini, Bussolino and Giraudo2012). It has also been linked to immune response (Kumanogoh et al., Reference Kumanogoh, Shikina, Suzuki, Uematsu, Yukawa, Kashiwamura, Tsutsui, Yamamoto, Takamatsu, Komitamura, Takegahara, Marukawa, Ishida, Morishita, Prasad, Tamura, Mizui, Toyofuku, Akira, Takeda, Okabe and Kikutani2005), an important pathway related to renewal. SLC11A1 is related to immune response and defense (Ding et al., Reference Ding, Zhang, Yang, Ding, Xue, Meng, Zhu and Yin2014). Furthermore, greater PGF expression may indicate macrophage secretory and physiological function as well as stimulation of angiogenesis in the RG group. This gene was related to the inflammatory process (Claus et al., Reference Claus, Weich, Breier, Knies, Rockl, Waltenberger and Risau1996) and angiogenesis in muscle (Viita et al., Reference Viita, Markkanen, Eriksson, Nurminen, Kinnunen, Babu, Heikura, Turpeinen, Laidinen, Takalo and Ylä-Herttuala2008). In summary, those results together points to an increase in inflammatory responses during regeneration in recovery growth as a response to remodeling. Tissue remodeling of the ECM has been shown to involve an initial inflammatory process (Fielding et al., Reference Fielding, Manfredi, Ding, Fiatarone, Evans and Cannon1993) followed by interactions between fibroblasts and satellite cells that normally lead to fibrogenic processes (Murphy et al., Reference Murphy, Lawson, Mathew, Hutcheson and Kardon2011). These may present a concerted response that depends largely on macrophage secretion, which is the first stage of tissue remodeling (Ciciliot and Schiaffino, Reference Ciciliot and Schiaffino2010). For tissue renewal to occur, the migration and proliferation of myofibroblasts are important to produce current ECM (Mann et al., Reference Mann, Perdiguero, Kharraz, Aguilar, Pessina, Serrano and Muñoz-Cánoves2011).
The identified increase in FCN2 expression would be part of connective tissue remodeling program in the RG cows as this protein is related to soluble collagen-like proteins (Garred et al., Reference Garred, Honoré, Ma, Munthe-fog and Hummelshoj2009). Those molecules are identified in apoptosis of myofibroblasts, endothelial cells, and macrophages (Jensen et al., Reference Jensen, Honore, Hummelshoj, Hansen, Madsen and Garred2007), which are part of renewal process in extracellular muscle tissue.
Although we did not observe changes in the major components of connective tissue, there are indications that renewal is marked by inflammatory response while the other repair states were not present during the whole recovery period and remodeling of the regenerated muscle tissue in RG cows. Probably alterations in the extracellular components that would elicit, for instance, changes in collagen properties would be related to high extracellular matrix turnover only observed in greater growth rates at younger age as was reported in negative correlation between average daily gain and total collagen or heat soluble collagen in Longissimus muscle from pasture fed beef cattle (Archile-Contreras et al., Reference Archile-Contreras, Mandell and PURSLOW2010). Moreover, lower MSTN expression in RG cows may be related with regulation of fibroblast, as myostatin is involved in fibroblast activation and fibrosis (i.e. progressive deposition of collagen and other extracellular matrix proteins such as fibronectin and vimentin) both in vivo and in vitro (Li et al., Reference Li, Kollias and Wagner2008). Although myostatin was able to stimulate procollagen (Type I and Type III) mRNA and fibronectin protein expressions in mice skeletal muscle, MSTN expression is reduced during muscle repair from injury (Zhu et al., Reference Zhu, Li, Shen, Qiao, Ambrosio, Lavasani, Nozaki, Branca and Huard2007). Moreover, those authors showed that myostatin knockout mice had fewer fibrotic connective tissue deposits with the smaller area between regenerating myofiber in injured muscle. This could be the action of cytokines regulating gene expression in ECM connective tissue by binding to specific receptors on the surface of fibroblasts (Crombrugghe et al., Reference Crombrugghe, Vuorio and Karsenty1990).
The genes related to immune and inflammatory responses allowed the identification of cytokines (Table 4) that are upstream regulators of those genes, indicating that these cytokines may have acted at some point during recovery growth. It could be the case of observed upregulated PGF in RG group as a response to Oncostatin. This cytokine was responsible for increased levels of PGF mRNA and protein in rheumatoid arthritis synovial fibroblast (Tu et al., Reference Tu, Lin, Chiu, Tang, Yang and Fu2013). The upstream regulator gene Oncostatin is involved with the proliferation of fibroblasts (Ihn and Tamaki, Reference Ihn and Tamaki2000) and production of collagen and glycosaminoglycan Another identified upstream regulator gene, IL-6 contributes to overall inflammation and subsequently to fibrosis (Atamas and White, Reference Atamas and White2003). Tumor necrosis factor activated macrophages that appear to be key players in pathologic processes that are associated with fibrosis (Song et al., Reference Song, Ouyang, Horbelt, Antus, Wang and Exton2000) because they are activated by profibrotic factors. It demonstrates that the renewal may had favored some fibrosis, but it was not constant throughout the experiment to elicit any changes in ECM gene expression.
Although identified as upstream regulatory elements, as the cytokines discussed before, it is worth mentioning that miR-182-5p (Table 4) is involved in processes related to tissue remodeling, such as membrane protein ectodomain proteolysis, membrane protein proteolysis as well as in the cell cycle and apoptosis (Krishnan et al., Reference Krishnan, Steptoe, Martin, Wani, Nones, Waddell, Mariasegaram, Simpson, Lakhani, Gabrielli, Vlassov, Cloonan and Grimmond2013). The other microRNA identified (miR-182) as an upstream regulator of PGF, also regulates the activity of the MMP-2 and MMP-9 extracellular proteases (Sachdeva et al., Reference Sachdeva, Jeffrey, Lee, Zhang, Li, Dodd, Cason, Luo, Ma, Mater, Gladdy, Lev, Cardona and Kirsch2014).
Conclusion
We concluded that recovery gain resulted in changes in genes associated with growth factors that are involved in the control of muscle and fibroblast cell proliferation and protein synthesis. However, the transcriptome for proteases possibly involved in muscle protein turnover and related to collagen and other major extracellular matrix components were not affected during long-term moderate recovery gain in mature bovine females under grazing condition.
Acknowledgments
This work would have not been possible without the partnership of the Genomics Center at the University of Sao Paulo/ESALQ, Piracicaba, São Paulo, Brazil and the National Beef Cattle Research Center/EMBRAPA, and funding from FAPESP 13-11772-4. LLC is a recipient of CNPq research productivity scholarship.
Declaration of interest
The authors declare that they have no conflicts of interest.
Ethics statement
The environmental and animal ethics committees approved the protocols used in this work.
Software and data repository resources
The data presented here are not deposited in any official repository.