


1. Introduction
Trends in sea-ice extent as seen from satellites – rather coarse indicators of the health of the polar ice covers – have been monitored for only three decades (1978-present) (Reference Comiso, Parkinson, Gersten and StockComiso and others, 2008). Yet, these satellite estimates have served as the bellwether of climate of the Arctic and, to a certain degree, of the Antarctic. Recent availability of nearbasin-scale estimates of ice thickness (Reference Laxon, Peacock and SmithLaxon and others, 2003;Reference Giles, Laxon and WorbyGiles and others, 2008b;Reference Kwok, Cunningham, Wensnahan, Rigor, Zwally and YiKwok and others, 2009) and high-resolution estimates of ice motion (Reference KwokKwok, 2006) in the Arctic have provided a more detailed but limited picture of the variability in ice-cover response to atmosphere and ocean forcing. The variability and coupled behavior of Arctic sea-ice thickness and kinematics, at decadal timescales, remain to be quantified. However, progress in satellite monitoring of these same parameters in the Antarctic has been slow.
Observations of thickness and kinematics are essential for a more in-depth understanding and improved projections of changes of the polar sea-ice cover. Satellite estimates of these variables are challenging because sea-ice processes span a broad range of spatial and temporal scales: high elevation precision is needed to detect changes in thickness, and high spatial resolution is required to sample the details of a discontinuous motion field. As a brittle solid, the response of the ice cover to large-scale atmospheric and oceanic forcing is concentrated along fractures up to kilometers wide and lengths that can span thousands of kilometers (Reference Kwok, Dempsey and ShenKwok, 2001). Sea ice does not deform continuously throughout the ice cover (like a fluid): it moves and deforms due to fractures/cracks created by brittle failure. This nature of ice motion places significant requirements on the spatial resolution and coverage of the imaging sensors for ice motion analysis.
The mechanical response of the ice cover is coupled to ocean-atmosphere interactions. When the warm underlying ocean is exposed to the frigid winter atmosphere along these cracks, heat exchanges are large and local brine production increases as new ice grows. Closing of the pack ice forces the ice to raft or pile up into pressure ridges and to be forced down into keels, increasing the ice-ocean and ice-atmosphere drag. The thickness distribution of the ice cover (Reference Thorndike, Rothrock, Maykutand and ColonyThorndike and others, 1975), shaped by these small-scale dynamic and thermodynamic processes, has profound impacts on the strength of the ice cover and the surface heat and energy budget over a wide range of temporal and spatial scales. Accurate quantification and simulation of the relative contributions of these processes to the ice-thickness distribution are crucial for understanding the behavior and the vulnerability of the ice cover in a warming climate.
In this paper, I provide a review of our ability to retrieve and monitor sea-ice thickness and kinematics from space. Sections 2 and 3 discuss the approaches, uncertainties, sampling limitations and validation issues associated with the estimation of sea-ice thickness and motion from satellite altimetry and imagery. Review of geophysical results obtained thus far will be brief as the intent is to focus on capabilities and limitations. The importance of near-simultaneous observations of both thickness and motion is discussed in section 4. The last section summarizes the paper.
2. Sea-Ice Thickness
Owing to the importance of thickness in sea-ice mass balance and in the surface heat and energy budget, remote determination of ice thickness at almost any spatial scale has long been desired. Current spaceborne sensors, however, can see only radiation emitted or scattered from the top surface or the volume within the top few tens of centimeters of the ice and do not see the lower surface; this has been an obstacle to the direct observation of ice thickness. The current approach has been to use altimeter-derived freeboard together with the assumption of hydrostatic equilibrium to determine ice thickness. The first geophysical results of ice-freeboard/thickness estimates from radar altimetry (European Remote-sensing Satellite 1, ERS-1) were given by Reference Laxon, Peacock and SmithLaxon and others (2003). Quasi-specular radar returns from open water/thin ice provide the necessary sea- surface reference to determine freeboard; this forms the algorithm basis for derivation of freeboard estimates for the dedicated CryoSat-2 mission to monitor sea ice and ice sheets. Retrieval of freeboard and determination of ice thickness from lidar altimetry have also been employed by a number of investigators to examine changes in the Arctic ice cover (Reference Kwok, Zwally and YiKwok and others, 2004, Reference Kwok, Cunningham, Zwally and Yi2007, Reference Kwok, Cunningham, Wensnahan, Rigor, Zwally and Yi2009; Reference Forsberg and SkourupForsberg and Skourup, 2005, Reference Zwally, Yi, Kwok and ZhaoZwally and others, 2008; Reference Farrell, Laxon, McAdoo, Yi and ZwallyFarrell and others 2009). Typically, a combination of reflectivity, waveform parameters and elevation changes are used in freeboard retrieval; there are merits to the varied approaches. In the following subsections, I define the geometric relationships of the different parameters used in freeboard and thickness calculations, discuss the various issues associated with their retrieval in elevation profiles and consider the uncertainties in the determination of sea-ice thickness.
2.1. Geometric relations
Total freeboard, as defined here, is the elevation of the air- snow interface from the local sea surface (Fig. 1). For the Arctic Ocean, the total freeboard consists generally of a snow layer superimposed on the freeboard of floating sea ice. This total freeboard height, h f, above the sea surface can be written as the sum of two terms:

Geometric relationships between snow depth, sea-ice freeboard, draft and thickness.

where h fs and h fi are the thicknesses of the snow and ice layers above the sea surface, respectively; h fi is commonly referred to as sea-ice freeboard. For Antarctic sea ice, the situation is more complicated because of layering and snow- ice formation (from freezing water-soaked snow due to infiltration of rain, meltwater or sea water above the snow- ice interface) during the winter, and the efficacy of this simple two-layered model has not been demonstrated.
From an altimeter, the total freeboard, h f, is the difference between the surface elevation, h s, and the sea-surface height, h ssh

Both h s and h ssh are typically measured relative to the level of a particular reference ellipsoid. Further, the time-space varying sea-surface height is the sum of contributions from a number of physical processes. It can be decomposed into:

In this equation, h g is associated with geoid undulations, h a represents the sea-surface response to atmospheric pressure loading, h T is from tidal contributions, and h d is the dynamic topography associated with geostrophic surface currents and higher-order terms. All these terms vary in time and space and possess their own characteristic length scales. The reader is referred to Reference KwokKwok and others (2006) for a brief discussion of the various sea-surface models and the expected uncertainties of each of these terms.
Since centimeter-level knowledge of h ssh for retrieval of freeboard is lacking, a necessary step is the identification of available sea-surface references (tie points) within the ice cover. As the sea surface varies along the length of an altimeter segment, the spatial length scale over which one could assume the sea-surface height to be constant is dependent on: the acceptable freeboard uncertainty;the expected spatial variability of the sea-surface height;and the expected number of tie points within that segment. It should be noted that the spatial variability of h g deserves special attention as it is more energetic than h T, h aand h d at all length scales (Reference WagnerWagner, 1979;Reference Chelton, Cazenave, Ries, Haines, Fu, Callahan and FuChelton and others, 2001);the small- scale variability of this parameter could introduce significant errors in the retrieval process if not taken into account.
2.2. Retrieval of sea-surface heights in ice-covered seas
There are three practical considerations associated with the retrieval of sea-surface height in elevation profiles from lidar and radar altimeters: (1) likelihood of finding open water;(2) discrimination of open water and ice/mixed surfaces;and (3) precision of the altimeter elevation estimates. These are discussed below.
2.2.1. Likelihood of finding open water
When the ice cover fractures, sea surfaces are exposed along narrow leads. Inside the winter ice edge, narrow open-water leads cover only ˜1−2% of the surface area of the Arctic Ocean during the winter and somewhat higher percentages during the summer.
Unless the lead area fills the entire footprint of the lidar or radar, the retrieved sea surface will be biased by the elevation of the neighboring ice cover. The extent of these biases is dependent on the fraction of the laser or radar footprint occupied by the sea surface as well as the relative reflectivity or radar backscatter of the water and ice surfaces (see Fig. 2).
Cumulative distribution of the width of open-water spans from AIM and SCICEX ice-draft profiles. AIM dates are month/year. Ice drafts from five SCICEX submarine cruises (1993, 1996, 1997, 1998, 1999) are used to create the average cumulative distribution (solid curve). All SCICEX data, except for those from 1999, were acquired during the summer and fall. After Reference Kwok, Cunningham, Wensnahan, Rigor, Zwally and YiKwok and others (2009).

From purely geometric considerations, the availability of sea-surface samples that occupy the entire altimeter footprint is determined by the footprint size of the altimeter and the expected distribution of lead widths within the ice cover. There is a range of lead widths in the Arctic and Antarctic ice covers. Figure 2 shows the cumulative distributions of the width of these open-water spans in the Arctic based on ice draft observations from the Arctic Ice Mapping (AIM) moorings and five Scientific Ice Expeditions (SCICEX) cruises. These distributions provide the likelihood of finding a lead of given ‘width’. It is clear from the cumulative distribution that a large fraction of the leads are <100 m wide and therefore smaller footprints are more suitable for acquisitions of sea- surface tie points. While there are large openings (hundreds of meters) in the Arctic Ocean, their frequency of occurrence is quite low. Less than 20% of Arctic leads are comparable to that of the nominal footprint of Ice, Cloud and land Elevation Satellite 1 (ICESat-1) of ˜50–70m. The Synthetic Aperture Radar (SAR) Interferometric Radar Altimeter (SIRAL) on CryoSat-2 employs an along-track beam formation approach to synthesize a resolution cell of approximately 300 m × 1 km (Reference WinghamWingham and others, 2006) to improve the sampling of exposed open-water surfaces.
As for the Southern Ocean, I am not aware of lead width statistics (in the published literature) that could be used to understand our capability to sample the sea surface in ice- covered regions. Based on passive microwave ice concentration estimates, it is only possible to be certain that the ice cover is generally less compact (lower ice concentration). The use of polynyas to provide sea-surface references has not been explored and they could prove useful, especially in the Southern Ocean. Whether the sampling of the sea surface is more or less favorable compared with the Arctic, for a given footprint, is not clear.
2.2.2. Discrimination of open-water surfaces
As there are a limited number of leads, the unambiguous discrimination of the available ocean samples from ice and mixed samples is a key step in freeboard determination. For radar altimetry, differentiation between the ocean and sea ice is possible as different-shaped echoes are received from each surface (Reference Peacock and LaxonPeacock and Laxon, 2004), though mixed ice/ ocean returns are still an issue. For lidar returns, a combination of waveform characteristics, reflectivity and elevation changes have been used for selection of open-water samples (Reference Kwok, Zwally and YiKwok and others, 2004, Reference Kwok, Cunningham, Zwally and Yi2007; Reference Forsberg and SkourupForsberg and Skourup, 2005; Reference Zwally, Yi, Kwok and ZhaoZwally and others, 2008; Reference Farrell, Laxon, McAdoo, Yi and ZwallyFarrell and others 2009). In the special case, for both radar and lidar, where either the specular or quasi-specular returns from the sea surface dominate the elevation estimates, biases in elevation due to the mixtures of ice/water areas within the footprint are less of a concern. In any case, the discrimination algorithms are usually tailored to the specific character of an individual altimeter system and its wavelength.
2.2.3. Precision of altimeter profiles
Owing to the relatively small differences between ice and water densities, the nearly tenfold multiplication of freeboard uncertainties in the estimation of ice thickness is daunting and places stringent demands on the accuracy of freeboard retrieval. Since freeboard is a differential measurement, the pulse-to-pulse precision (a
p) in elevation estimates determines the sensitivity of the instrument to small changes in elevation and the uncertainty with which freeboard can be determined. The consideration here is that the pulse-to- pulse precision bears on the detection of the limited number of sea-surface samples (as discussed above) and afterwards the estimation of freeboard. ap
is ˜2 cm for ICESat-1 (Reference Kwok, Zwally and YiKwok and others, 2004) and is expected to be ˜2.6cm for CryoSat-2 (Reference WinghamWingham and others, 2006). The expected per- pulse uncertainty in differential elevation (i.e. freeboard) is  . Of course, spatial averaging can reduce these uncertainties.
2.3. Determination of ice thickness
Assuming that the floating ice is in isostatic balance, the following equations have been used to determine ice thickness (h i):


The densities of ice (ρi), snow (ρs ) and sea water (ρw) provide the appropriate scaling for hydrostatic equilibrium. The isostatic balance is written differently in Equations (4) and (5) to highlight the key observables (in bold) from lidar (h f) and radar (h fi) altimeters. For lidars, the retrieved variable is the total freeboard that represents the elevation of the air- snow interface. Because of penetration of the radar wave into the snow volume, the elevation of the scattering surface is closer to that of the ice freeboard. The equations as written here presume that there is no penetration of the lidar into the snow volume and that the radar returns are from the snow- ice interface. In practice, it should be noted that the relative penetration depth is highly variable over the range of lidar and radar wavelengths currently in use and thus an important consideration in thickness estimation. Snow depth (h fs), a crucial input required in the determination of ice thickness, is discussed in the next section.
One can examine the dependence of the thickness estimates, hi , on uncertainties in the variables in Equations (4) and (5). Following Reference GilesGiles and others (2007) and Reference Kwok and CunninghamKwok and Cunningham (2008), the equations below show how uncertainties in the estimates of elevations and densities, assuming that the variables are uncorrelated, are propagated into uncertainties in thickness estimates:


Where
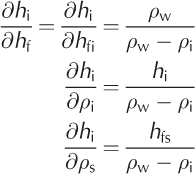


The primary error source for the lidar is the determination of freeboard. For the radar, it is the error in the retrieval of sea-ice freeboard with additional uncertainties in the location of the radar scattering surface. As mentioned above, the exact scattering center depends on radar wavelength and the properties of the snow layer near the interface;and these remain topics of investigation.
In the set of partial differentials, there is a clear difference in the relative sensitivity of thickness estimates to uncertainties in snow depth, ∂hi/∂hfs. Assuming nominal values of bulk densities of snow, ice and sea water (ρs = 300 kgm-3; ρi = 920 kg m-3; and ρw = 1024 kg m-3), lidar estimates of ice thickness are ˜2.4 times (i.e. ρs — ρw/ρs) more sensitive to uncertainties in snow depth, compared to radar retrievals. A more detailed discussion of these error sources can be found in Reference GilesGiles and others (2007) and Reference Kwok and CunninghamKwok and Cunningham (2008).
2.4. Snow depth and density
To account for snow loading in the determination of ice thickness, observations of its depth and density are required. And, as discussed above, estimates of sea-ice thickness from lidar altimetry are more sensitive to uncertainties in the snow cover. Since there are no routine measurements of these two spatially and temporally varying quantities over the Arctic Ocean, one has to resort to other means of estimating snow depth.
Potentially, one could utilize the snow climatology of the Arctic Ocean sea-ice cover by Reference WarrenWarren and others (1999). Reference Laxon, Peacock and SmithLaxon and others (2003) chose this approach. However, there are shortcomings in using this climatology: it was developed using in situ data collected between 1954 and 1991 and it is not clear how this compilation reflects present-day snow conditions. In addition, it is representative of snow depth only over relatively level multi-year ice and it does not address the snow depth over the increasing expanse of seasonal ice over the Arctic and the changes associated with later onset of freeze and snow accumulation. These same concerns apply to snow density.
Reference Kwok, Cunningham, Wensnahan, Rigor, Zwally and YiKwok and others (2009) elected to use daily snowfall estimates (as snow water equivalent, SWE) from European Centre for Medium-Range Weather Forecasts (ECMWF) meteorological fields, together with a modified climatological snow density based on that in Reference WarrenWarren and others (1999), to construct daily estimates of Arctic snow depth. The US National Centers for Environmental Prediction/US National Center for Atmospheric Research (NCEP/NCAR) products include precipitation-evaporation (P- E) estimates as well, but these fields contain unphysical spatial patterns that are associated with numerical ringing near the poles. To use the ECMWF snowfall estimates effectively, they constructed daily fields that take into account the conditions for accumulation of snow on the ice cover during the growth season, ice advection, the seasonal variability in snow density and the initial snow cover at the end of the summer. The results seem to provide a reasonable depiction of the gradients in snow depth from seasonal ice to multi-year ice, while the snow depth over multi-year ice is comparable to climatology. The spatial pattern of the basin-scale snow depth maps shows clear delineations of the seasonal and multi-year ice zones, especially in the fall (see Fig. 4 in Reference Kwok and CunninghamKwok and Cunningham, 2008). This distinct seasonal feature has a close spatial correspondence to the freeboard maps from ICESat that is not reflected in the climatology. Broadly, this contrast between the two ice zones is a better representation of the expected behavior of the snow cover: the younger seasonal ice cover that forms in the fall (October and November) has a thinner snow cover than the older ice that survived the summer.
Another important consideration is the partitioning of the estimates in mean snow depth from a larger/coarser length scale (˜100km) into the higher-resolution freeboard distributions from radar or lidar altimetry. The actual snow depth needs to be adjusted to account for the local freeboard variability (associated with new openings as well as the unmodeled redistribution of snow mass), especially when the freeboard is less than the mean snow depth. This is to ensure that there are no negative sea-ice freeboards and that there is a relative fraction of ice and snow in the total. For the lidar case, Reference Kwok and CunninghamKwok and Cunningham (2008) illustrate how the total freeboard is partitioned when the freeboard is close to, or less than, the large-scale snow depth (Fig. 3): the effective snow depth is taken to be a fraction of the total freeboard as defined by the sigmoidal curve. When the total freeboard is half that of the snow depth, one-third of the thickness of the total freeboard is partitioned into sea ice and two-thirds into snow. The choice of this function is quite arbitrary: the only basis is that there is very little negative freeboard in Arctic sea ice, there is nearly always a snow cover over sea ice and anecdotal evidence indicates that the snow layer could be quite thick even on thin ice.
Partitioning of large-scale mean snow depth into theobserved distributions of freeboard. The effective snow depth is taken to be a fraction of the total freeboard when the freeboard is close to or less than the large-scale mean snow depth. After Reference Kwok and CunninghamKwok and Cunningham (2008).

More recently, Reference KurtzKurtz and others (2009) used a combination of freeboard data from ICESat, snow depth data over first-year ice from the Advanced Microwave Scanning Radiometer on the NASA Earth Observing System (EOS) platform (AMSR-E) and snow depth over multi-year ice from climatological data to estimate snow and ice thicknesses for the Arctic basin.
Our knowledge of the snow cover of the Antarctic is limited and was summarized nicely by Reference MassomMassom and others (2001). Their analysis shows large regional and seasonal differences in snow properties and sea-ice thicknesses, a consequence of thicker snow and thinner ice in the Antarctic relative to the Arctic. Flooding and snow-ice formation, in addition to precipitation, contribute to the variability during the development of the seasonal Antarctic snow cover. At this time, there is no climatology of the snow cover on Antarctic sea ice to speak of. Reference Markus and CavalieriMarkus and Cavalieri (1998) demonstrated the potential of extracting snow depth from satellite passive microwave observations, but the usefulness of these estimates requires further verification with in situ measurements from field programs (Reference Worby, Geiger, Paget, van Woert, Ackley and DeLibertyWorby and others, 2008a).
2.5. Arctic sea-ice thickness
The ERS and Envisat satellite radar altimeters of the European Space Agency (ESA) have been useful in providing circum- Arctic observations south of 81.5° N since 1993. Envisat observations between 2002 and 2008 suggest little change in thickness until early 2007, but a large decrease (0.25 m) following the September 2007 ice extent minimum (Reference Giles, Laxon and WorbyGiles and others, 2008b). However, this decline in thickness was confined to regions of the Beaufort and Chukchi Seas, with no significant changes found in the eastern Arctic. Results from ICESat laser altimetry over the same region also show thinning between 2007 and 2008, although these data also suggest stronger interannual variability (Reference Kwok, Cunningham, Wensnahan, Rigor, Zwally and YiKwok and others, 2009). The large signal in thickness due to the record minimum in summer ice cover is clearly seen in the altimetry data.
ICESat provided a broader picture of the Arctic basin because the lidar coverage extends to 86° N. In addition, the data have been used to yield observations of seasonal variability between spring and fall. Data from ten ICESat campaigns between 2003 and 2008 show rapid thinning and volume loss of the Arctic Ocean ice cover (Reference Kwok, Cunningham, Wensnahan, Rigor, Zwally and YiKwok and others, 2009). Changes were strongest over multi-year ice regions which thinned by ˜0.6m over 4years (Fig. 4). In contrast, the average thickness of the seasonal ice in midwinter (˜2 m), which covered more than two-thirds of the Arctic Ocean in 2007, exhibited a negligible trend. With ICESat, it was possible to estimate the recent changes in Arctic ice volume associated with the 42% decline in multiyear ice coverage area since 2005 (Reference Kwok, Cunningham, Wensnahan, Rigor, Zwally and YiKwok and others, 2009; see also discussion below). The total multi-year ice volume in the winter experienced a net loss of 6300 km3 (>40%) in the 4years since 2005, while the first-year ice cover gained volume due to increased overall area coverage compensating the multi-year ice area loss. With the large decline in multi-year ice coverage over this short record, it was shown that there is a reversal in the volumetric and areal contributions of the two ice types to the total volume and area of the Arctic Ocean ice cover. The winter area and volume of seasonal ice surpassed multi-year ice and became the dominant ice type. The average winter sea-ice volume over the period, weighted by a loss of ˜3000km3 between 2007 and 2008, was ˜14 000 km3. However, with the end of the ICESat mission in 2009, this source of ice-thickness and volume estimate has been lost.
Decline in Arctic Ocean winter sea-ice thickness from five ICESat campaigns between 2004 and 2008. MY ice: multi-year ice; FY ice: first-year ice. After Reference Kwok and SulskyKwok and Sulsky (2010).

2.6. Antarctic sea-ice thickness
Progress in the retrieval of Antarctic sea-ice freeboard and thickness from satellite altimetry has been slow. Reference Giles, Laxon and WorbyGiles and others (2008a), using ice elevation estimates from ERS-2, show reasonable spatial agreement between the satellite and in situ ice thickness, and correlations with expected seasonal trends. These results show promise for providing estimates of Antarctic ice thickness from radar altimetry missions such as CryoSat-2. As mentioned above, one major obstacle in the utilization of satellite freeboard estimates is our knowledge of the time-space variability in snow and ice densities. For the use of radar, the level of penetration into the thicker Antarctic snow cover remains a question (Reference Giles, Laxon and WorbyGiles and others, 2008a).
Reference Zwally, Yi, Kwok and ZhaoZwally and others (2008) provided a first examination of sea-ice freeboards in the Weddell Sea from ICESat elevation profiles using snow depth from AMSR-E passive microwave data (Reference Markus and CavalieriMarkus and Cavalieri, 1998;Reference Comiso, Cavalieri and MarkusComiso and others, 2003). Sea-ice thickness is derived using a simple two-layer model (Equation (1)) and nominal densities of snow, sea water and sea ice. This study demonstrates that ICESat provides a unique capability for measuring total ice freeboards with complete basin-scale coverage on approximately monthly timescales. However, a more detailed assessment of the quality of these lidar estimates awaits improved in situ observations, such as those from ships and moorings.
2.7. Assessment of satellite retrievals
Remote sensing provides synoptic-scale observations and presents a challenge for extensive validation of such estimates. This is especially true of remote-sensing data of the Arctic and Southern Ocean sea-ice covers with their large seasonal and interannual variability. Two avenues are available. One of these is the comparison of various types of remote sensing with each other, using arguments of internal consistency and the known elements of seasonal change. Another approach has been that of comparing aircraft, satellite and in situ data for given seasons and locales. The former is by far the more popular approach due to the cost of field programs associated with collecting in situ and aircraft datasets. In any case, it takes a number of years and considerable work to develop these datasets and to quantify and understand the uncertainties of the retrieved parameters.
For the Arctic Ocean, the availability of ice-thickness estimates from submarine and moored upward-looking sonars (ULSs), airborne laser profiling and ground/airborne electromagnetic surveys (Reference Haas, Hendricks, Eicken and HerberHaas and others, 2010) is improving. To validate altimetry and sea-ice products from CryoSat, there is a dedicated ESA campaign, CryoSat Validation Experiment (CryoVEx), which includes coordinated field and airborne campaigns. IceBridge, a 6year NASA aircraft mission, will help bridge the gap in polar observations between ICESat-1 and ICESat-2 (planned for late 2015). It will provide seasonal airborne surveys of the Arctic and Antarctic sea-ice covers. The airborne campaigns will provide a yearly multi-instrument look at the behavior of the changing polar sea-ice covers. These programs promise to provide more useful and coordinated datasets for improving retrieval algorithms and validation of thickness estimates.
Compared with the Arctic, measurements of Antarctic sea-ice thickness to date have been sparse and are limited to measurements of ice draft from moored ULSs (Reference Worby, Bush and AllisonWorby and others, 2001), ship-based observations and field drilling (Reference Wadhams, Lange and AckleyWadhams and others, 1987;Reference Worby, Geiger, Paget, van Woert, Ackley and DeLibertyWorby and others, 2008b), surface measurements from airborne laser profiling, and ground-based and airborne electromagnetic surveys (Reference HaasHaas, 1998). Although these data provide a useful description of Antarctic sea-ice thickness they are spatially and temporally limited. In the near future, the CryoVEx and IceBridge campaigns and field programs should be providing better measurements of the Antarctic ice cover.
3. Sea-Ice Kinematics
Sea-ice motion is readily observable in time-sequential satellite imagery. The quality of these measurements depends more on the geometric fidelity and image resolution than on a thorough physical understanding of the ice signatures. In recent years, motion estimates have been derived from a variety of imaging sensors: high-resolution SAR imagery, moderate-resolution imagery in the visible/ near-infrared bands, and lower-resolution passive microwave brightness temperature and scatterometer backscatter fields. In this section, a review is provided of the observational uncertainties, the motion-tracking approaches and the utility of ice-motion fields derived from different types of sensors.
3.1. Observational basis
The fundamental concepts of ice motion are position, displacement and velocity. Consider ice at a position X at time t =0; at some later time the ice has moved to a new position, x(t:X). A displacement is the difference in the positions of an ice particle at two different times

The average velocity over the intervening time interval, T = t i+1 — t i , is

There are two primary sources of error in measuring ice motion from satellite imagery: the absolute geographic position error (εg) of each image pixel and a tracking error (εf) which is the uncertainty in identifying common features in the second of two images. The position error applies independently to each position in each image, i.e. a position is the true position plus an error of x + εg. The tracking error e f applies to a displacement observed between two images. Following Reference Holt, Rothrock and KwokHolt and others (1992) and Reference Kwok and CunninghamKwok and Cunningham (2002), if it is assumed that εg and εf are each normally distributed with zero bias, have standard deviations σ g and σf and are uncorrelated between two time-separated images A and B, it is possible to treat separately the errors of each scalar component of vectors. Including errors, an estimate of the displacement of an ice feature is given by

The error in u has a zero mean and a variance of

The error in velocity is σu divided by the time interval of displacement.
Spatial differences in displacement between two features (1 and 2) are

The error in Δu has zero mean. Its variance contains a contribution from each of the tracking errors εf2 and εf1 that are independent. If the geolocation errors are all independent then their variances all add and the variance of Δu is  . This quantity is an upper bound on this error when the points are separated by hundreds of kilometers. However, if the two features are close, the geolocation errors are no longer independent and in fact tend to cancel; the error variance of Δu tends towards the lower bound
 . This means that even if the geolocation errors are large, differential motion or deformation can be estimated well, even if displacement cannot. The mean spatial gradient over the distance between two features (Δx) can be calculated by Δu/Δx.
3.2. Motion tracking
Satellite images provide displacements of as many features as can be identified and tracked between a pair of images. Although the temporal resolution and spatial coverage are limited by sensor swath widths and orbit repeat intervals, the spatial resolution can be quite high. A common approach to automatic ice tracking has been cross-correlation between two time-separated images. The magnitude of the correlation of the brightness patterns between two image patches is used as a measure of similarity for determining whether a matching feature is located. To avoid false matches, it is useful to confine the search space if an estimate of expected ice drift is known a priori. Depending on the time separation between images, the expected drift can be provided with a linear ice-drift model (Reference Kwok, Curlander, McConnell and PangKwok and others, 1990) driven by geostrophic winds from analyzed meteorological fields.
Typically, the tracking of image features proceeds in a pyramidal or hierarchical fashion, starting with degraded spatial resolution imagery to capture the large-scale ice drift before analyzing the detailed ice motion at the higher- resolution imagery. The matches found at the lower resolutions provide estimates of feature displacements to confine the searches for each successive increment in resolution. Density of sampling is increased at each stage. Overall, cross-correlation has been effective and accurate for deriving dense measurements of ice motion in the central Arctic pack where floe rotations and deformation over several days are small. Cross-correlation is less reliable in deformation zones and in the marginal ice zone, where significant rotations and deformations occur. Certainly, the decorrelation of the image patterns due to deformation can be mitigated by shortening the sampling interval between satellite passes. As mentioned above, this is constrained by sensor swath widths and orbit repeat intervals.
3.3. Lagrangian vs Eulerian sampling of motion field
There are two general ways of sampling a motion field: Eulerian and Lagrangian. In the Eulerian specification, the motion field is sampled at specific fixed locations in the space through which the ice moves as time passes. This Eulerian approach is more suited for studies of large-scale circulation patterns, regional and basin-scale advective ice balance and applications that generally do not require the details in the motion field.
With the Lagrangian specification, in contrast, the motion of individual ice particles is followed, producing an array of trajectories as the particles move through space and time. This particle array has the advantage of being able to provide sampling of the motion field as well as a record of the deformation of material elements within the ice cover (Reference Kwok, Rothrock, Stern and CunninghamKwok and others, 1995). Since sea ice is a brittle solid, it does not deform continuously throughout the ice cover;rather, sea ice moves and deforms due to fractures/cracks created by brittle failure. As local ice strength is determined by weaknesses in the fracture patterns that advect with the ice cover, the Lagrangian approach is more appropriate where details of ice kinematics and the openings and closings of the ice cover, for understanding ice mechanics and surface heat balance, are of interest. However, this observational requirement adds complexity to the ice-motion tracking process. In addition to recording the location history of the array at each time-step, the connectivity of the particles that define the material elements has to be maintained.
3.4. Arctic sea-ice motion
The discussion of the current capabilities for remote sensing of ice motion is divided into moderate- (˜10km) and finer- resolution (1 km) observations. There are limitations in present-day satellite systems in providing the range of resolution and space-time coverage that span the geophysical scale (tens of meters to kilometers) of interest.
3.4.1. Moderate resolution
Despite its antenna footprint of 10 km or more, it has been shown that useful ice motion can be derived from passive microwave instruments (Reference Agnew, Le and HiroseAgnew and others, 1997;Reference Kwok, Tsatsoulis and KwokKwok and others, 1998; Reference Liu and CavalieriLiu and Cavalieri, 1998;Reference Martin and AugsteinMartin and Augstein, 2000;Reference Meier and DaiMeier and Dai, 2006): scanning multichannel microwave radiometer (SMMR), Special Sensor Microwave/Imager (SSM/I) and AMSR-E. The limitation is that the fairly coarse spatial resolution of the imagery produces uncertainties of ˜4–6km for individual displacement vectors (Reference MaslanikMaslanik and others, 1998). The great strengths of this dataset are its spatial coverage and the length of the data record, which is >30 years for the combination of SMMR, SSM/I and AMSR-E. In addition, it has also been shown (Reference Zhao, Liu and LongZhao and others, 2002; Reference HaarpaintnerHaarpaintner, 2006) that coarse ice motion can be derived from low-resolution (footprint >10 km) scatterometer fields acquired by QuikSCAT (1999–2009);the vector uncertainties in the motion estimates are comparable to those from the passive microwave instruments.
Given the quality of these motion estimates, these datasets are better suited for understanding synoptic and longer-term drift patterns rather than the detailed characteristics of daily ice motion (Fig. 5). These motion fields are not well suited for computing short-term deformation (e.g. divergence, shear) because the errors would be intolerable for the expected strain rates in the Arctic or Antarctic ice cover. The ice-motion estimates from both types of instrument become unreliable after the onset of melt because of variable surface wetness and atmospheric effects that render the spatial signature unstable for correlation analysis. Recently, Reference Kwok and CunninghamKwok (2008) demonstrated that useful motion estimates could be extracted from the longer-wavelength passive microwave observations that are less sensitive to such issues during the melt season.
Sample monthly mean motion field of the Arctic (March 2008) and Southern (August 2008) Oceans derived from satellite passive microwave data (AMSR-E). Contours are isobars of sea-level pressure (interval 4 hPa).

Advanced Very High Resolution Radiometer (AVHRR) imagery provides wide swath coverage (˜1000km) at moderate resolution (˜1 km) for motion analysis (Reference Ninnis, Emery and CollinsNinnis and others, 1986;Reference Emery, Fowler, Maslanik, Ikeda and DobsonEmery and others, 1995), but gaps in coverage due to clouds make it difficult to routinely sample the motion fields. Uncertainties of ˜2 km are expected for individual displacement vectors. The AVHRR record dates back to 1991.
3.4.2. Finer resolution
Of particular interest is ice motion from SAR imagery. Spaceborne SAR imaging of the ice cover has the advantage of all-weather day-and-night operational capability, fine ground resolution (˜10–100m), good geometric accuracy, and sensitivity of the radar backscatter to the roughness, dielectric and physical properties of different sea-ice types and open water. However, current imaging radars have limited swath widths compared with those offered by the passive microwave and visible/infrared instruments.
Prior to the launch of RADARSATin 1996, detailed motion measurements were limited by the narrow SAR swaths of ˜100 km (Seasat, ERS-1 and -2 and Japanese Earth Resources Satellite-1 (JERS-1)). The Wide Swath Mode of RADARSAT (˜450km, spatial resolution ˜100m) provided the first basin-scale mapping capability at 3 day intervals. From 1997 to 2007, the SAR on RADARSAT provided routine coverage of the Arctic Ocean for ice-motion analyses. With the high-resolution sea-ice kinematics (grid spacing 5 km) from RADARSAT, motion estimates approach the length scales and timescales appropriate for observing the expressions of the smaller-scale sea-ice processes. A joint project of the Alaska Satellite Facility and the Jet Propulsion Laboratory has been producing fine-scale sea-ice motion products (Reference Kwok, Tsatsoulis and KwokKwok, 1998) based on this data stream. The motion analysis system (RADARSAT geophysical processor system, RGPS) operated in a Lagrangian tracking mode. Uncertainty in the motion vectors is ˜200–300m (Reference Lindsay and SternLindsay and Stern, 2003). The objective of the project has been to provide a dataset suitable for understanding the basin-scale behavior of small- scale sea-ice kinematics on a seasonal and interannual timescale, improving ice dynamics in sea-ice models (Reference Coon, Kwok, Levy, Pruis, Schreyer and SulskyCoon and others, 2007), documenting changes in sea ice and assimilation into coupled ice-ocean models.
The decade-long ice-motion dataset from this program has allowed a more detailed examination of the small-scale time-varying deformation of the ice cover (Reference Kwok, Dempsey and ShenKwok, 2001). The derived motion fields have been used to quantify the various measures of opening, closing and shear and to estimate ice production and thickness. From analysis of this dataset, it has been possible to resolve and trace the development of these long linear features, associated with fractures, in the pack ice (Fig. 6). The dataset shows that the activity, persistence, orientation and length scale of the fracture patterns are quite remarkable. The abundance of these quasi-linear fractures is correlated with motion gradients and material strength and they are organized into coherent patterns that persist for days. The dataset shows that there are distinct differences in the deformation-induced ice production and the density of these features in the seasonal and perennial ice zones (Reference KwokKwok, 2006).
Large-scale mean ice motion and deformation of the Arctic Ocean ice cover between 4 and 10 February 2007. The high-resolution ice deformation fields are derived from SAR imagery. (a) Mean vector field with superimposed sea-level pressure contours (interval 4hPa); (b) divergence; (c) vorticity; (d) shear. Deformation computed at gridcell ˜10km on a side. Units: per day. After Reference Kwok and SulskyKwok and Sulsky (2010).

A similar system (GlobICE), which also has the Lagrangian tracking capability, is being implemented for the analysis of Envisat SAR data. It is currently under development and has produced a preliminary set of data products for the science community.
Ice deformation at sub-daily timescales associated with tidal forcing or inertial effects is becoming more pertinent as the ice cover thins. However, sub-daily sampling remains an issue due to lack of frequent repeat coverage from orbiting satellites. New ice production due to the recurrent openings and closings at these temporal scales, if ubiquitous, could be significant within the winter pack (Reference Kwok, Cunningham and Hibler, IIIKwok and others, 2003). A simple simulation of this process shows that it can account for an equivalent of 10 cm of ice thickness over 6 months of winter, approximately 20% of the basal ice growth of thick ice (of ˜0.5 m) in the central Arctic. As noted by Reference Heil and Hibler, IIIHeil and Hibler (2002), if these processes are indeed important over the entire Arctic basin, their contribution to the mass budget should be included in numerical simulations of Arctic ice- ocean-atmosphere interactions.
3.5. Antarctic sea-ice motion
As with the Arctic, the discussions of current capabilities for remote sensing of ice motion are divided into moderate- and finer-resolution observations. However, the limitations of present-day satellite systems are more acute because of the more demanding space-time sampling and resolution requirements of sea-ice motion processes in the Southern Ocean (Reference Padman and KottmeierPadman and Kottmeier, 2000).
3.5.1. Moderate resolution
For the Southern Ocean, the use of passive microwave instruments (SMMR, SSM/I, AMSR-E) and scatterometers (QuikSCAT) to produce daily ice-motion measurements has also been relatively successful. However, the quality of the data is somewhat lower than that achievable in the Arctic Ocean: the higher daily displacement and deformation rates in the Antarctic ice cover reduce the spatial coherence of image features (brightness patterns) at a faster rate and this impacts the matching schemes discussed above. It is also difficult to produce ice-drift estimates close to the ice edge where atmosphere/ocean processes modify the ice cover at much shorter timescales than the typical satellite revisit time of 1 day. As in the Arctic, these datasets are better suited for understanding synoptic and longer-term drift patterns rather than the detailed characteristics of daily ice motion. Similarly, the ice-motion estimates become unreliable during the melt season.
3.5.2. Finer resolution
There are no dedicated programs to produce fine-scale sea- ice motion datasets of the Southern Ocean ice cover. Over the past decade, SAR coverage has been sparse due to spacecraft and sensor limitations. Unlike the passive satellite instruments, these active instruments can be operated for only fractions of an orbit period. Thus, imaging of the Antarctic ice cover has to compete for the limited resources used typically for Arctic observations.
Repeat radar imaging to obtain ice motion at the spatial resolution achievable with SAR in the Southern Ocean depends on satellite orbit characteristics. Whereas the image-matching procedures can tolerate revisit times of 2–3days in the Arctic, daily revisits are required especially in the regions with low ice compactness (e.g. seaward of the polynyas of the Ross and Ronne Ice Shelves, Bellingshausen Sea, etc.). Typical strain rates of Antarctic sea ice (10-6 to 10-5s-1) are one to two orders of magnitude higher than in the Arctic (10-7s-1) (Reference KwokKwok, 2005).
Away from the Weddell and Ross Seas, observing sea ice in the region of large gradients across the narrow band of sea ice (several hundred kilometers) surrounding the coast of Antarctica requires high space-time resolution acquisitions. This is the case especially for the entire East Antarctic sector: daily high-resolution coverage is needed in this region since current coverage is inadequate for observations necessary for understanding of ice dynamics.
Additionally, temporal variability in radar backscatter in the Antarctic sea-ice zone heavily impacts ice-tracking capability using SAR imagery. Episodic warming and high moisture events that occur year-round cause large variability in ice backscatter signatures. Hence, key issues remain with regard to the interpretation and understanding of sea-ice backscatter signatures and characteristics in the region, and their effect on not just ice-motion algorithm performance, but also fast-ice detection and sea-ice type classification.
3.6. Validation of satellite ice motion
The most common approach of ice-motion validation is by comparison of displacements derived from satellite fields with those from drifting buoys. The International Arctic Buoy Program (IABP) maintains a network of drifting buoys in the Arctic Ocean, and the recent deployments provide fairly good coverage for assessment of ice motion. The position error for the buoys reported by the IABP using the Advanced Research and Global Observation Satellite (ARGOS) positioning system is ˜0.3 km (Reference Thorndike and ColonyThorndike and Colony, 1982). Some buoys are equipped with GPS and their positioning is typically of the order of tens of meters but depends on the viewing geometry of the GPS constellation at polar latitudes. There is a parallel program named International Programme for Antarctic Buoys (IPAB) that maintains the buoy network for the Southern Ocean. However, the coverage is quite sparse because of deployment logistics and because of typical buoy lifespans of <1 year due to the seasonal nature of the ice cover. With the current positioning accuracy of satellite image data, there is less of a requirement for extensive data quality assessment with drifting buoys, except during the evaluation phase of an ice-tracking system.
4. Simultaneous Observations of Thickness and Kinematics
Satellite measurements for ice-thickness and motion parameters are typically acquired independently with little consideration of the close coupling between the thermodynamics and dynamics that is necessary for understanding changes and improving models of the ice cover. For example, at short timescales our understanding of how ice is redistributed in thickness by mechanical processes such as rafting and pressure ridging is weakly constrained by observations (Reference Lipscomb, Hunke, Maslowski and JakackiLipscomb and others, 2007). Current ridging schemes used in models are largely heuristic and are difficult to verify empirically. There is also increasing interest in running sea-ice and ocean models at scales of the order of ≤10km: these small-scale simulations are necessary to resolve mesoscale eddies in the ocean (Reference Smith, Maltrud, Bryan and HechtSmith and others, 2000), detailed features of sea-ice motion (e.g. Reference Maslowski and LipscombMaslowski and Lipscomb, 2003) and the response of the ocean to ice kinematics (Reference McPhee, Kwok, Robins and CoonMcPhee and others, 2005). Thus, even though near-simultaneous observations of these parameters are difficult with current satellite technologies, the importance of the coordination between these observations deserves special attention.
5. Conclusions
This paper presents a review of our current ability to retrieve and observe sea-ice thickness and kinematics in the Arctic and Southern Oceans. For the Arctic, the retrieval of sea-ice thickness from radar and lidar altimetry is maturing and its shortcomings are relatively well understood. However, the ultimate achievable quality of ice-thickness estimate will depend on our ability to address these shortcomings. During the last decade, separate observations of thickness and motion have provided new insights into the variability and changing processes inside the ice edge. These observations complement the multi-decadal time series of Arctic ice extent from coarse-resolution passive microwave sensors. The observations of kinematics and thickness have added to our understanding of the rapid decline of the Arctic ice cover during the decade. Yet, the records of small-scale (kilometers) sea-ice kinematics and thickness are short and incomplete due to gaps in coverage and sensor issues. For the Southern Ocean ice cover, the retrieval of thickness and kinematics have not received the same attention as for the Arctic ice cover and thus there are fewer observations to address the deficiencies in our capability.
As thermodynamics and dynamics are related through their modification of the ice-thickness distribution, there is a need for more extended and near-simultaneous observations of the coupled behavior of motion and thickness to understand their seasonal-to-decadal variability and the integrated response of the ice cover to a changing climate. It is also important to note that complementary field programs are indispensable components of a comprehensive system to address our observational needs for validation and process understanding (Polar Research Board, 2006; Integrated Global Observing Strategy, 2007).
As far as spaceborne assets are concerned, it is unfortunate that NASA’s ICESat-1 mission ended in 2009. Currently, the Envisat altimeter is still active and is providing useful although limited coverage of the Arctic and Southern Ocean ice cover. The ESA’s CryoSat-2 was launched in April 2010. At an orbit inclination of 88°, the on-board radar altimeter will provide continuous mapping of the sea-ice freeboard of a large fraction of the ice cover in the Arctic and Antarctic Oceans. Further, CryoSat-2 provides elevation estimates with spatial resolution of 300 m in the along-track direction using a synthetic aperture processing technique (Reference WinghamWingham and others, 2006) – a significant improvement over previous radar altimeters. For ice-motion observations, Envisat is providing radar imaging of the polar oceans. RADARSAT-2 SAR imagery is not available for scientific use. The Sentinel-1 European Radar Observatory, to be launched about 2012, is a polar-orbiting satellite system for the continuation of SAR applications, including observations of sea-ice motion. It is a C-band imaging radar mission consisting of a pair of satellites aimed at providing an allweather day-and-night supply of imagery. Sentinel-1 is to be followed by a second satellite a few years later.
Two NASA polar-orbiting missions (ICESat-2 and Deformation, Ecosystem, Structure and Dynamics of Ice (DESDynI)), both planned for launch this decade, are also tasked to address the observational needs of sea-ice thickness and kinematics. One of the science objectives of ICESat-2 (planned launch late 2015) is to measure sea-ice freeboard for estimation of sea-ice thickness (Reference AbdalatiAbdalati and others, 2010). The spacecraft will have a multi-beam surface-profiling lidar system (˜10m footprints) for measuring sea-ice freeboard. The DESDynI mission (to be launched later this decade) will have an L-band SAR to provide routine observations of ice kinematics of both the Arctic and Southern Oceans. Near 3 day mapping of sea-ice kinematics will be available from the imaging radar system on DESDynI.
During this decade, the prospects for improved satellite observation of the Arctic and Southern Ocean sea-ice covers are promising. The potential of near-simultaneous observations of thickness and kinematics will allow us to understand the contributions of thermodynamics and dynamics to the ice-thickness distribution for process studies and model improvements, and to provide a dataset that is suitable for assimilation into, and assessments of, global models.
Acknowledgements
I thank S. Laxon for providing valuable comments on the manuscript. This work was performed at the Jet Propulsion Laboratory, California Institute of Technology, under contract with NASA.



