I. INTRODUCTION
Higher thermal efficiency can reduce fuel consumption and decrease greenhouse gas emission of the coal-fired power plants. Conventional supercritical coal-fired power plants (USC) typically operate at efficiencies on the order of 44% to 46%. Recently, to achieve higher thermal efficiency, operation at 700 °C and 35 MPa or higher with a net efficiency (heat rate) of above 50% has been proposed [700 °C advanced supercritical coal-fired power plants (A-USC)]. Reference Jørgen, Sven and Blum1 However, the material requirements of 700 °C A-USC plants, especially the creep strength (100 MPa for 105 h), are clearly beyond the temperature capacity of the currently used ferritic or austenitic steels for A-USC power plants. Reference Viswanathan and Bakker2 Superalloys such as CCA617, Haynes 282, and IN740, with better high-temperature creep strength are considered as the most appropriate candidate in the hottest boiler and turbine sections. Reference Oh, Yoo, Choi, Santella and Jang3–Reference Yang, Thomson, Leese and Roberts6 However, these alloys are prohibitively expensive due to a high content of Co and/or Mo, W and the workability is poor. Reference Wang, Guo, Guo and Zhou7
One key method to reduce the cost and improve the workability is the development of Ni-base alloys with high amount of Fe, Ni–Fe based alloys. Reference Zhong, Gu, Yuan and Shi8 Therefore, lots of attempts have been done to develop the new Ni–Fe based alloy strengthened mainly by γ′ precipitates in recent years. Reference Wang, Zhao, Guo, Guo and Zhou9 As an alloy strengthened mainly by γ′ precipitates, the mechanical properties and deformation behaviors are all sensitively affected by the characteristics of γ′ precipitates. Reference Raynor and Silcock10–Reference Fu, Du, Han, Cui and Zhang13 Service induced γ′ degeneration in superalloys mainly occurs in the forms of γ′ coarsening, the instability of γ′ morphology, the dissolution of γ′ precipitates, and the transformation from γ′ to η etc. Reference Koul and Castillo14–Reference Wang, Wang, Tan, Guo, Guo and Zhou17 These changes exert important influence on the mechanical properties of the alloys. Reference Qin, Guo, Yuan, Hou, Zhou and Ye16–Reference Yuan, Song, Zheng, Huang, Yagi, Xiao and Feng20 Hence, the stability of γ′ precipitates should be considered, when a new alloy is developed.
The stability of γ′ precipitates is closely related to the constituents of the alloys. Although lots of attempts have been done to develop the new Ni–Fe based alloy, as a primary constituent of Ni–Fe based alloy, few works referring to the influence of Fe on the thermal stability of γ′ precipitates and tensile properties are available. Better understanding of the influence of Fe on the thermal stability of γ′ precipitates is significantly important for optimizing alloy composition and improving mechanical properties. Therefore, to get an optimum alloy composition, the influence of Fe on the thermal stability of γ′ precipitates and tensile properties was investigated in this paper.
II. EXPERIMENTAL PROCEDURES
Examined material is a new developed wrought superalloy, contains 20%Cr, 2.2%Mo, 1.2%Nb, 0.35%Al, 1.24%Ti, 0.04%C, trace B and the balance Ni + Fe (wt%). Fe contents in the experimental alloys G34 and G25 are 34% and 25% respectively. The alloys were vacuum induction melted, homogenized at 1150 °C for 2 h and then hot-forged and rolled into bars of 16 mm in diameter at 1150 °C. The as-processed bars were subjected to standard heat treatment: 1100 °C/1 h/air cooling + 750 °C/8 h/air cooling, followed by long term thermal exposure at 650–800 °C in air furnace. For standard heat treatment and each exposure condition at least four specimens were prepared for tensile test.
Tensile specimens (5 mm in gage diameter and 25 mm in gage length) were machined from these bars. Tensile tests were conducted at 700 °C in accordance with GBT 228-2002. Yield strength was calculated using the 0.2% offset method. Ductility (elongation and reduction in area) was obtained from the measurements of gage section length and the minimum gage diameter before and after fracture. Each strength and ductility value represents an average value taken from at least two tensile test results.
Microstructure was characterized by the JEOL 6340 field emission gun scanning electron microscope (SEM; JEOL Ltd., Tokyo, Japan) equipped with energy dispersive x-ray spectroscopy (EDS) microanalysis and a TECNAI G25 F20 transmission electron microscope (TEM; FEI Company, Hillsboro, Oregon). SEM samples were grounded to 2000-grit, mechanically polished, and then etched by two different solutions. One solution was used for general microstructure observation with the composition of 200 g KCl, 50 g citric acid, 200 mL HCl, and 1000 mL H2O. The other solution was used for deep etching for 3D observation of the lath-like η phase (Ni3Ti-base) and ultra-fine γ′ phase. The composition of the second solution is 10% H2CrO4 (CrO3 + H2O). TEM samples were mechanically thinned down to about 100 μm in thickness, and electropolished with a 10% perchloric acid methanol solution, using a double-jet electropolisher (Shanghai University, Shanghai, China). Particle size (γ′ diameter) measurements were made mainly on SEM and TEM photographs of the particles. More than one hundred particles were measured to minimize the experimental errors and the average value was taken as γ′ size. The γ–γ′ lattice mismatch and the chemical composition of γ′ were measured from powder samples obtained by the electrolytic extraction. Reference Wang, Wang, Sun, Qin, Guo and Zhou21
The thermodynamic calculations of the equilibrium microstructural, phases and precipitation kinetics were performed using J-MatPro version 7.0 with the Ni–Fe database.
III. RESULTS AND DISCUSSION
A. γ′ characteristics after standard heat treatment
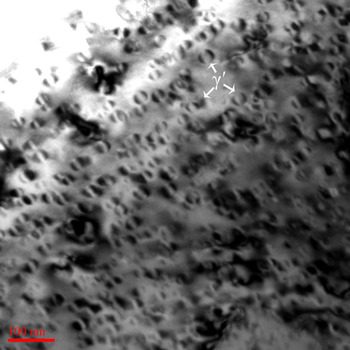
Figure 1 illustrates the γ′ characteristics of G34 alloy after standard heat treatment. It can be seen clearly that the ultrafine coherent γ′ precipitates, which contribute to the main strengthening effect for this alloy, homogeneously distribute within γ matrix. γ′ morphology is spherical, typical size is between 15 and 28 nm, and the average size is about 20 nm. Both alloys present a similar γ′ characteristics. However, the γ–γ′ lattice mismatch determined experimentally increases from 0.23% to 0.27% with decreasing Fe content from 34% to 25%.
Bright-field TEM micrograph of G34 alloys after standard heat treatment.

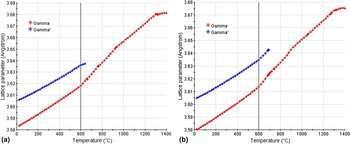
Figure 2 shows the γ and γ′ lattice parameters of both alloys from the thermodynamic calculation. The results show that the difference between γ and γ′ lattice parameters becomes larger with decreasing Fe content, which is in agreement with the experimental results. One of the possible reasons for the variation in γ–γ′ lattice mismatch is the concentration difference of Fe between γ and γ′. Fe solubility in γ matrix is much higher than that in γ′ and the atomic radius of Fe is bigger than that of Ni. Reference Guo22 Therefore, the decrease of a γ is more than a γ′ and (a γ′ − a γ) becomes larger with decreasing Fe content. Both alloys display a positive misfit and the misfit is proportional to (a γ′ − a γ). Hence, the decrease of Fe content causes an increase in γ–γ′ lattice mismatch.
γ and γ′ lattice parameters of alloy G34 (a) and G25 (b).

B. γ′ coarsening behavior
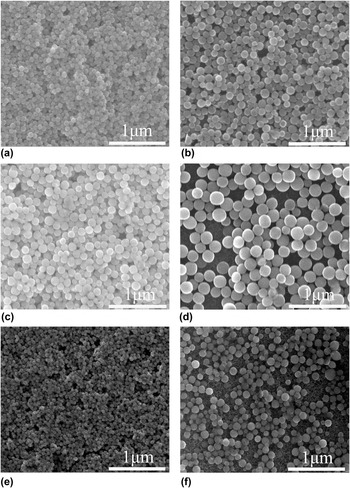
γ′ coarsening behavior of both alloys was investigated as functions of temperature from 650 to 750 °C and thermal exposure time up to 5000 h. The SEM micrographs in Fig. 3 depict the changes of γ′ precipitates in G34 alloy during thermal exposure at 700 and 750 °C for different times and in G25 alloy at 700 and 750 °C for 5000 h. With increasing thermal exposure temperature and time, γ′ precipitates have an obvious growth, particularly with increasing thermal exposure temperature. However, the morphology of γ′ precipitates is still spherical after thermal exposure at 750 °C for 5000 h. The γ′ morphology has good thermal stability. For G25 alloy, after thermal exposure at 700 and 750 °C for 5000 h, the size of γ′ precipitates is all obviously smaller than that of G34 alloy under the same conditions and is also spherical. The γ′ morphology of G25 alloy also has good thermal stability. In addition, no coalescence behavior was observed and the density of γ′ precipitates decreases with increasing thermal exposure time. The coarsening behavior of γ′ precipitates is consistent with the description of Ostwald ripening theory in which the larger precipitates grow at the expense of smaller precipitates.
γ′ characteristic of alloys G34 (a–d) and G25 (e and f) after thermal exposure at 700 (a, c and e) and 750 °C (b, d and f) for different time: (a and b) 1000 h; (c–f) 5000 h.

The morphology evolution of γ′ precipitates in superalloy is driven by the reduction of the global energy of the system. Reference Grosdidier, Hazotte and Simon23 The global energy can be reduced to the chemical free energy, interfacial energy due to the interface between γ and γ′ precipitates and elastic distortion energy associated with the lattice misfit. The selection of appropriate shape is a major way to reduce the global energy and the equilibrium shape is resulted from the balance between interfacial and elastic energy contributions. When the precipitates are small, the interfacial energy is dominant and spherical or quasi-spherical shape appears. As precipitates grow, the part of elastic energy contribution increases and the morphology becomes instable. The elastic energy is proportional to the γ–γ′ lattice mismatch. The elastic energy of G34 alloy is low due to the low γ–γ′ lattice mismatch. Therefore, the γ′ morphology of G34 alloy is still spherical due to the lower elastic energy even if the γ′ size becomes large after thermal exposure at 750 °C for 5000 h. Although the γ–γ′ lattice mismatch of G25 alloy is higher than that of G34 alloy, the γ′ size of G25 alloy is smaller than that of G34 alloy. Therefore, the γ′ morphology of G25 alloy also has good thermal stability due to the lower coarsening rate of γ′ precipitates.
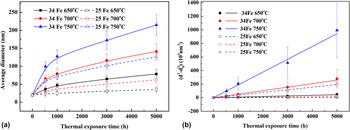
The average radius of γ′ precipitates
 $\left( {d} \right)$
obtained after various thermal exposure time (t) at three temperatures is plotted against thermal exposure time in Fig. 4(a). The γ′ size increases with increasing thermal exposure time and temperature. It is worth noting that γ′ size increases drastically, and then γ′ precipitates grow gradually. γ′ size of G25 alloy is smaller than G34 alloy under the same thermal exposure conditions. Additionally, as shown in Fig. 4(b), there is a liner relationship between
 ${\bar d^3} = {d^3} - \mathop {{d_0}}\nolimits^3$
and t, where d
0 and d are average diameter of γ′ precipitates at t = 0 and t, respectively. The liner relationship suggests that the coarsening of γ′ precipitates follows the standard
 ${\bar d^3} \propto t$
kinetics of diffusion-controlled particle growth although the Lifshitz–Slyozov–Wagner theory is strictly applicable when the precipitate volume fraction is small or approaches zero.
Reference Lifshitz and Slyozov24,Reference Wagner25
Similar behavior of precipitate coarsening was observed for the gamma-prime phase or the gamma-double-prime phase in other superalloys.
Reference Zhong, Gu and Yuan26,Reference Zhao, Xie, Smith and Patel27
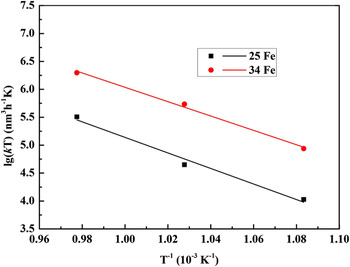
The slope of each straight line in Fig. 4(b) is the coarsening rate constant, k. Moreover, at 650 and 700 °C, the coarsening rate is obviously lower than that at 750 °C. That is to say the k value increases with increasing thermal exposure temperature due to the increase of diffusion efficient and the γ′ precipitates is very stable at 650 and 700 °C. Additionally, it is found that the coarsening rate is closely related with Fe content within all temperature range. With the decrease of Fe content, the coarsening rate obviously decreases and the coarsening rate of γ′ precipitates in G25 alloy at 750 °C is even slightly lower than that of alloy G34 at 700 °C.
A plot of γ′ size versus thermal exposure time at different temperatures: (a) d ∝ t; (b) (d 3-d 0 3) ∝ t.

The coarsening rate of γ′ precipitates has an inverse proportion with the activation energy, E, for γ′ coarsening. The E can be determined from the slope of the ln kT versus T −1 plot according to previous study, Reference Wang, Guo, Guo and Zhou7,Reference Kusabiraki, Takasawa and Ooka15,Reference Zhong, Gu and Yuan26 which is shown in Fig. 5. The values of E are approximately 235 kJ/mol for G34 alloy and 247 kJ/mol for G25 alloy. The coarsening activation energy increases by 12 kJ/mol as the Fe content decreases from 34% to 25%. The values of E for G34 and G25 alloy are almost in coincidence with the diffusion of Ti and Al in γ-Fe and Ni. This result indicates that the growth of γ′ precipitates is consistent with a diffusion-controlled coarsening mechanism, and the coarsening of γ′ precipitates is controlled mainly by the volume diffusion of Ti and Al. The activation energy of volume diffusion of Ti in γ-Fe (251 kJ/mol) is lower than that in Ni (257 kJ/mol). Reference Kusabiraki, Takasawa and Ooka15 With decreasing Fe content, the values of E for γ′ coarsening increases which may be related to the increase of the activation energy for volume diffusion of Ti and Al with decreasing Fe content. This indicates that the lower Fe content can decrease the coarsening rate of γ′ precipitates by increasing the activation energy, E, for γ′ coarsening.
Relationship between temperature (T) and the coarsening rate (k).

C. Transformation from γ′ to η
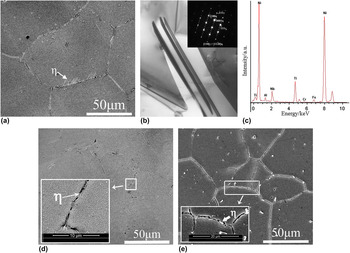
Figure 6(a) and (d) show the microstructure of both alloy after thermal exposure at 700 °C for 5000 h. Clearly, the morphology and distribution of precipitates are quite similar to that after standard heat treatment. However, for G34 alloy, besides MC and M23C6 carbides, the needle-like precipitates appear in the area near grain boundary and grow from grain boundary to matrix. The needle-like precipitates observed in TEM are shown in Fig. 6(b), and the selected area electron diffraction (SADP) and EDS [Fig. 6(c)] analysis confirm that the needle-like precipitates is the hexagonal close-packed η phase (Ni3Ti-base) with the lattice parameters of a ∼ 5.09 Å and c ∼ 8.30 Å. The SADP also exhibits that the η phase has an orientation relationship with γ matrix,
 ${\left\{ {111} \right\}_\gamma }\,\sol\sol {\left\{ {1000} \right\}_\eta },{\left[ {110} \right]_\gamma }\, \sol\sol {\left[ {11{\rm{\ }}\!\!\overline {\rm{2}} 0} \right]_\eta }$
. Therefore, it is reasonable to infer that the needle-like phase first precipitates at grain boundary due to the segregation of Ti and the lower interface energy at grain boundary. In contrast to G34 alloy, the quantity and size of η phase in alloy G25 obviously decreases. For G25 alloy, the η phase is still very few even if after thermal exposure at 700 °C for 10,000 h [Fig. 6(e)]. Therefore, it can be deduced that the lower Fe content can retard the precipitation of η phase.
SEM microstructure of alloys G34 (a–c) and G25 (d and e) after thermal exposure at 700 °C for different times: (a–c and d) 5000 h; (e) 10,000 h.

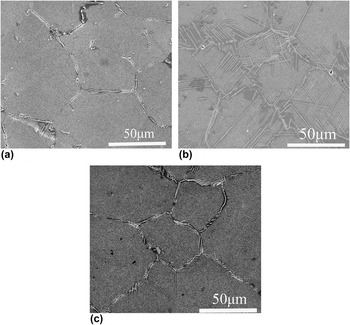
SEM microstructures of alloys G34 and G25 after thermal exposure at 750 °C for different times are shown in Fig. 7. As observed in Fig. 6, the significant structure change in G34 alloy is η phase formation at grain boundary after 1000 h thermal exposure and the size of η phase is similar to that after thermal exposure at 700 °C for 5000 h. This means that the growth rate of η phase at 750 °C is much higher than that at 700 °C. After thermal exposure at 750 °C for 5000 h, not only η phase initiates from grain boundaries but a significant amount of η phases form within the grains as Widmanstätten pattern structure. For alloy G25, after thermal exposure for 5000 h, η phase also precipitates at grain boundary. However, the quantity and size are similar to that of G34 alloy after 1000 h thermal exposure and obviously smaller than that of G34 alloy under the same thermal exposure conditions. Thus, it can be deduced that the precipitation of η phase is sensitive to Fe content. The lower Fe content can retard the precipitation of η phase. Additionally, from Fig. 7(b), it can be seen that there is a distinct γ′-denuded zone around η phase, which indicates that the growth of η phase expends γ′ phase and is controlled by volume diffusion of Ti atoms. The activation energy for volume diffusion of Ti decreases with decreasing Fe content. So, the diffusion coefficient of Ti decreases with decreasing Fe content. Moreover, the decrease of Fe content increases the solubility of Ti in γ matrix. Therefore, the lower Fe content can retard the precipitation of η phase.
SEM microstructure of alloys G34 (a and b) and G25 (c) after thermal exposure at 750 °C for different time: (a) 1000 h; (b and c) 5000 h.

D. γ′-solvus temperature
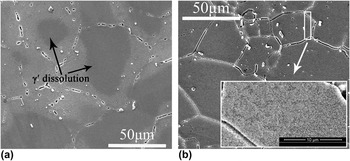
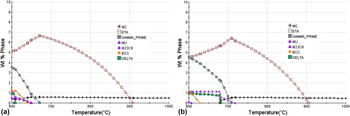
The dissolution behavior of γ′ precipitates in the alloys with different Fe contents is shown in Fig. 8. It can be seen clearly that γ′ denuded regions appear in G34 alloy after thermal exposure at 800 °C for 200 h. This indicates the dissolution of γ′ precipitates appears and the γ′-solvus temperature is lower than 800 °C. For alloy G25, γ′ coarsening was observed, but γ′ denuded region does not appear. It can be inferred that γ′-solvus temperature of the alloy with lower Fe content is higher. This is consistent with the results of thermodynamic calculation. Figure 9 shows the thermodynamically calculated results. It can be seen clearly that the γ′-solvus temperature increases from 660 °C to 705 °C with decreasing Fe content from 34% to 25%. The γ′-solvus temperature has an inverse proportion relation with Fe content.
γ′ dissolution behavior (800 °C/200 h): (a) G34; (b) G25.

Calculated equilibrium phase diagram: (a) G34 34% Fe; (b) G25 25% Fe.

E. Variation in tensile properties during thermal exposure
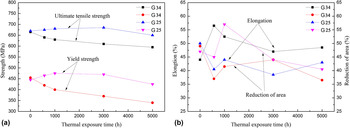
The 700 °C tensile properties of both alloys after long-term thermal exposure at 700 °C, as a function of exposure time are shown in Fig. 10. It is clear that the Fe content has an obvious influence on the stability of 700 °C tensile properties during long term thermal exposure at 700 °C. The tensile properties of both alloys are almost same after standard heat treatment. For alloy G34, the ultimate tensile strength and yield strength decrease drastically with increasing thermal exposure time. However, compared with the standard heat treatment, the thermal exposure has a positive effect on the ultimate tensile strength and the yield strength of alloy G25 prior to thermal exposure time of 3000 h, but after thermal exposure for 5000 h, the yield strength slightly decreases. The ductility of both alloys has no significant change during thermal exposure at 700 °C. It can be deduced that the thermal stability of the tensile properties of the alloys with lower Fe content is better than that with higher Fe content during thermal exposure at 700 °C.
Tensile properties at 700 °C of samples before and after thermal exposure at 700 °C: (a) yield and ultimate tensile strength; (b) elongation and reduction of area.

As an alloy strengthened mainly by γ′ precipitates, the tensile properties at 700 °C are mainly dependent on γ′ precipitates when the size of η phase is small. Reference Wang, Wang, Tan, Guo, Guo and Zhou17 From Fig. 4, it is clear that the size of η phase is very small even if after thermal exposure at 700 °C for 5000 h. Hence, the change of strength can be attributed to the γ′ coarsening. At 700 °C, the shearing of γ′ precipitates by dislocation while forming the stacking faults within γ′ precipitates is the main deformation characteristics even if γ′ precipitates become large after thermal exposure at 750 °C for 10,480 h. Reference Tan, Wang, Guo, Guo and Zhou28 Based on the classic precipitates strengthening theory, the shearing mechanism can be subdivided into two models, i.e., weakly coupled dislocation (WCD) model for small precipitates and strongly coupled dislocation model for large precipitates and the size of precipitates exists a critical one. Reference Jackson and Reed29,Reference Oh, Choi, Kim, Yoo and Jang30 That is to say, if γ′ size is smaller than the critical size, the WCD model will dominate and the strength increases with the increase of γ′ size, and vice versa. From Fig. 10, it can be seen that the peak value of tensile strength of G25 alloy appears when the γ′ size is about 49 and 58 nm after thermal exposure for 1000 h and 3000 h, respectively. Therefore, the critical γ′ size range could be defined between 49 and 58 nm. γ′ coarsening rate in G34 alloy is obviously higher than that of G25 alloy at 700 °C (Fig. 10). For G34 alloy, after thermal exposure at 700 °C for 570 h, the γ′ size is 65 nm and is larger than the critical γ′ size. Hence, the γ′ coarsening has a negative effect on the tensile strength and the tensile strength decreases with increasing thermal exposure time from 570 to 5000 h. However, for G25 alloy, the γ′ size is still around the critical size even if after thermal exposure at 700 °C for 3000 h. Therefore, the γ′ coarsening has positive effect on tensile strength and the tensile strength increases with increasing thermal exposure time from 570 to 3000 h. Further increasing thermal exposure time to 5000 h, the tensile strength decreases slightly due to the γ′ coarsening.
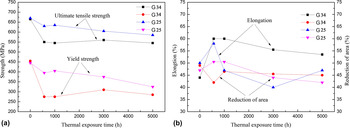
The change of the 700 °C tensile properties of both alloys is shown in Fig. 11 during long-term thermal exposure at 750 °C. The tensile strength of G34 alloy decreases dramatically at the initial stage due to the dramatic γ′ coarsening, and then almost keeps constant with increasing exposure time where the strengthening effect of γ′ phase is negligible due to the over aging. In contrast, the tensile strength of G25 alloy decreases steadily with increasing thermal exposure time. Compared with thermal exposure at 700 °C, the γ′ coarsening only has a negative effect on the tensile strength of both alloys. Based on the above discussion, the reason can be attributed to the higher γ′ coarsening rate during thermal exposure at 750 °C. The γ′ size of two alloys is beyond the critical size after thermal exposure at 750 °C for 570 h (γ′ size of G34 alloy is 99 nm and G25 alloy is 68 nm after thermal exposure for 570 h).
Tensile properties at 700 °C of samples before and after thermal exposure at 750 °C: (a) yield and ultimate tensile strength; (b) elongation and reduction of area.

F. Fractographic observations
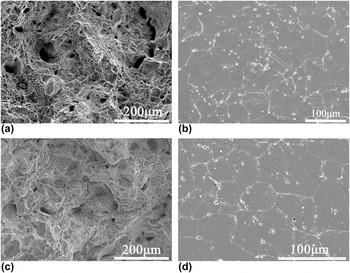
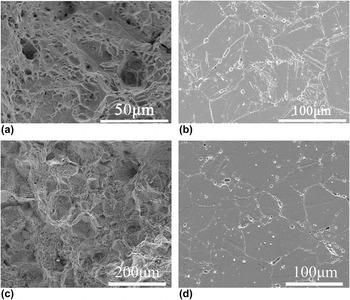
Figure 12 shows the typical micrographs of 700 °C tensile fracture surface and the cross sections near the fracture surface of both alloys after standard heat treatment. For both alloys, the main characteristics of the fracture surface are the appearance of some dimples with few cleavages after standard heat treatment [Figs. 12(a) and 12(c)]. Moreover, the intergranular and transgranular cracks can be observed. According to the classic fracture theory, Reference Balikci, Mirshams and Raman31 the dimples appearing at fracture surface correspond to the excellent ductility. Further observation on the sliced cross sections shows that in both alloys there are many microvoids at the interfaces between matrix and MC, wherever it is in grain interior or at grain boundary, as showed in Figs. 12(b) and 12(d). And most of them propagate and interlink each other and then form cracks. The Fe content has no significant influence on the fracture characteristics.
SEM micrographs showing microstructure characteristic of fracture surface (a and c) and cross section (b and d) near the fracture surface after standard heat treatment: (a and b) G34; (c and d) G25.

After thermal exposure at 750 °C for 5000 h, the fracture characterization of 700 °C tensile tested samples is shown in Fig. 13. For G34 alloy, the fracture surface feature has no obvious change compared to standard heat treatment [Fig. 13(a)]. However, as shown in Fig. 13(b), the microvoid appears at the interfaces between matrix and η phase. This means that the η phase becomes the crack initiation site. The fracture characterization of G25 alloy is similar as that after standard heat treatment [Figs. 13(c) and (d)]. Additionally, as shown in Fig. 13(d), the microvoid distributes at the interfaces between matrix and MC and almost no voids are found at the interfaces between matrix and η phase in G25 alloy. The influence of η phase on strength is related to its size. Reference Koul and Castillo14 The precipitation of hard and brittle η phase generates new phase interface η/γ. The interfaces hinder dislocation movement and stress concentration occurs as a result. At the same time, the plastic deformation of η phase is very difficult. The difference of plastic deformation between matrix and η phase results in the stress concentration around η phase. Therefore, the interface between matrix and η phase becomes the crack initiation. But the stress concentration is likely not enough to form microvoid when η phase is very small. The microvoid forms and the η phase becomes the crack initiation site when its size is large enough. After the thermal exposure at 750 °C for 5000 h, the η phase of G34 alloy becomes the crack initiation site, which should be attributed to the growth of η phase with Widmanstätten pattern structure. After thermal exposure at 750 °C for 5000 h, the Fe content has no obvious influence on the fracture mode, but the crack initiation site is reduced with decreasing Fe content.
SEM micrographs showing microstructure characteristic of fracture surface (a and c) and cross section (b and d) near the fracture surface after thermal exposure at 750 °C for 5000 h: (a and b) G34; (c and d) G25.

IV. CONCLUSIONS
γ′ stability and its influence on the tensile properties of a wrought superalloy with different Fe contents was studied during long-term thermal exposure at elevated temperatures. The major conclusions from this study can be summarized as follows:
-
(1) The γ′-solvus temperature is higher and the γ–γ′ lattice mismatch is bigger in the alloy with the lower Fe content.
-
(2) With decreasing Fe content from 34% to 25%, the coarsening rate of γ′ precipitates obviously decreases and the activation energy for γ′ coarsening increases from 235 kJ/mol to 247 kJ/mol.
-
(3) Transformation from γ′ to η appears in both alloys during thermal exposure at 700 and 750 °C. The lower Fe content can retard the transformation from γ′ to η.
-
(4) Tensile properties are sensitively affected by the size of γˊ precipitates and γˊ size exists a critical size. The tensile strength increases with the increase of γˊ size when γ′ size is smaller than the critical size and vice versa. The lower Fe content can improve the stability of tensile properties due to the enhancement of the thermal stability of γ′ precipitates.
-
(5) The fracture mechanism of two alloys is controlled by mix fracture model. The η phase becomes the crack initiation site due to the growth of η phase with Widmanstätten pattern structure after thermal exposure at 750 °C for 5000 h.
ACKNOWLEDGMENTS
This work was supported by the National High Technology Research and Development Program of China (863 Program) (No. 2012AA03A501), the National Natural Science Foundation of China (No. 51301171), and the National Energy Administration Program of China (No. NY20150102-1).