Insulin resistance and hyperinsulinaemia have been hypothesised as important underlying mechanisms linking diet and several major chronic diseases, including type 2 diabetes(Reference Stumvoll, Goldstein and van Haeften1) and obesity-related cancers(Reference Giovannucci2,Reference Gallagher and LeRoith3) . Several studies have shown that carbohydrate-stimulated insulin secretion is related to weight gain(Reference Nordmann, Nordmann and Briel4) and higher risk of obesity(Reference Astley, Todd and Salem5). Other dietary components, such as protein, influence acute insulin secretion. The dietary insulin index has been developed as a measure of postprandial insulin response of foods including both carbohydrate-containing foods and non-carbohydrate factors including protein(Reference Holt, Miller and Petocz6). Although the dietary insulin index predicted higher TAG and low HDL-cholesterol levels(Reference Nimptsch, Brand-Miller and Franz7), unexpectedly, higher dietary insulin index scores appeared to be related to lower fasting plasma C-peptide and lower BMI levels(Reference Nimptsch, Brand-Miller and Franz7).
Fasting plasma C-peptide may be more valid as a measure of insulin resistance than insulin secretion. Recently, we developed an empirical dietary index for hyperinsulinaemia (EDIH) based on how foods and food groups comprehensively predicted fasting C-peptide levels(Reference Tabung, Wang and Fung8). Although designed based on fasting plasma C-peptide, EDIH was also a better predictor of non-fasting plasma C-peptide than dietary insulin index or dietary insulin load(Reference Tabung, Nimptsch and Giovannucci9). Since C-peptide is ultimately secreted in the urine, a 24-h urine sample of C-peptide would provide an integrated measure of insulin secretion(Reference Besser, Ludvigsson and Jones10).
In the present study, we collected C-peptide concentrations in 24-h urine samples from the Men Lifestyle Validation Study (MLVS) to conduct a cross-sectional analysis of the association of EDIH, dietary insulin index and dietary insulin load with 24-h urinary C-peptide. Moreover, we examined interactions between these insulin-related dietary indices, physical activity and BMI in relation to 24-h urinary C-peptide. We hypothesised that all three insulin-related dietary indices are positively associated with integrated insulin secretion assessed by 24-h urinary C-peptide, and the positive association is stronger among overweight/obese individuals.
Methods
Study population
The MLVS was initiated as a validation study of diet and physical activity questionnaires used in the Health Professionals Follow-up Study (HPFS), a large prospective US cohort study(Reference Rimm, Giovannucci and Willett11). The MLVS included a subset of men from the HPFS and the Harvard Pilgrim Health Care insurance plan. Participants with a history of major diseases, including CHD, stroke, cancer or major neurological disease, were not included in the MLVS. The data collection was performed between 2011 and 2013. For the present study, we selected individuals who had completed the 2010 FFQ from the HPFS and donated a 24-h urine sample. We excluded participants who were diabetic or over 70 years old. Participants with diabetes were identified using a validated questionnaire(Reference Manson, Stampfer and Colditz12,Reference Hu, Leitzmann and Stampfer13) which asked about diabetes-related symptoms, medications use and diagnostic tests following the National Diabetes Data Group(14,15) . The final sample included 293 men. The study protocol was approved by the institutional review boards of the Brigham and Women’s Hospital and Harvard T.H. Chan School of Public Health.
Dietary assessment and calculation of the insulin-related dietary indices
Diet was assessed using a semiquantitative FFQ in 2010. Participants were asked to report their usual dietary intake of a standard portion of over 130 food items in the past year. Previous validation studies showed high reproducibility and validity of the dietary questionnaire(Reference Hu, Rimm and Smith-Warner16,Reference Rimm, Giovannucci and Stampfer17) .
Empirical dietary index for hyperinsulinaemia
The development and validation of EDIH have been described previously(Reference Tabung, Wang and Fung18). Briefly, EDIH was developed in a sample of 5812 women from the Nurses’ Health Study with a goal to create an empirical score to assess the insulinaemic potential of whole diets defined using food groups. Based on thirty-nine pre-defined food groups from FFQ, stepwise linear regression models were used to identify a dietary pattern most predictive of plasma C-peptide, a marker of insulin secretion. EDIH is a weighted sum of eighteen food groups that were shown to be statistically significant predictors. Higher (more positive) scores indicate hyperinsulinaemic diets and lower (more negative) scores indicate low-insulinaemic diets. The food groups positively associated with EDIH score are red meat, processed meat, poultry, non-fatty fish, margarine, butter, cream soup, low-fat dairy products, eggs, high-energy beverages, low-energy beverages, tomatoes and French fries. The food groups inversely associated with EDIH score are wine, coffee, leafy green vegetables, whole fruits and full-fat dairy products.
We also calculated empirical lifestyle index for hyperinsulinaemia (ELIH) using the stepwise linear regression model but further including two lifestyle factors (BMI and physical activity)(Reference Tabung, Wang and Fung18). ELIH is a weighted sum of twelve food groups plus BMI and physical activity. Similarly, higher (more positive) scores indicate hyperinsulinaemic lifestyles and lower (more negative) scores indicate low-insulinaemic lifestyles. For each participant, we used the self-administered FFQ to calculate EDIH and ELIH scores.
Dietary insulin index and insulin load
The insulin index values for individual food that appeared in the FFQ were obtained either from previously published estimates (thirty-one foods)(Reference Holt, Miller and Petocz6,Reference De Jong, Holt and Brand-Miller19) or provided by Dr Brand-Miller at University of Sydney, Sydney, Australia (seventy-three foods). US food samples were shipped to the laboratory in Sydney for testing as previously described(Reference Holt, Miller and Petocz6). Briefly, test subjects consumed various test foods on separate days, with insulin measured every 15 min for 2 h after consumption. The insulin index for each food was calculated by dividing the area under the insulin response curve for 1000 kJ of a test food by the area under the insulin response curve for 1000 kJ of the reference food (glucose). The insulin index value for each food represented the mean responses of 11–13 subjects.
Using these insulin index values, we calculated the dietary insulin load for each participant by multiplying the insulin index value of each food by the total energy content contributed by the food and summing the values for all foods reported. We calculated the dietary insulin index by dividing dietary insulin load by total energy content.
Twenty-four-hour urinary C-peptide assessment
C-peptide was measured in 24-h urine samples by a competitive electrochemiluminescence immunoassay on the Roche Cobas 6000 system (Roche Diagnostics). Briefly, a biotinylated C-peptide antibody and a C-peptide derivative labelled with ruthenium were mixed with the urine sample. The C-peptide in the sample and the ruthenium-labelled C-peptide compete for binding sites on the biotinylated antibody and form the respective immune complexes. Streptavidin-coated magnetic microparticles were then added to the reaction mixture to bind the biotinylated antibody. These immune complexes were magnetically entrapped on an electrode and the unbound reagents and sample were washed away. A chemiluminescent reaction was then electrically stimulated to generate light, the intensity being indirectly proportional to the amount of C-peptide present in the sample. This assay is approved by the US Food and Drug Administration for clinical use. The lowest detection limit of this assay is 0·01 ng/ml and the day-to-day imprecision values at concentrations of 1·82, 5·69, 16·7 and 24·1 ng/ml are 5·0, 2·2, 3·8 and 1·8 %, respectively.
Covariates assessment
Information on covariates, such as age, height, body weight, physical activity, smoking status, non-steroidal anti-inflammatory drug (NSAID) use and history of co-morbidities, were collected from a self-reported questionnaire in 2010. In addition, predicted lean body mass and fat mass were calculated based on previously validated anthropometric prediction equations(Reference Lee, Keum and Hu20) using age, race, height, weight and waist circumference collected from a self-reported questionnaire in 2012.
Statistical analysis
Descriptive statistics according to the insulin-related dietary indices were presented as mean and standard deviation for continuous variables and as percentages for categorical variables. Spearman’s correlation was used to evaluate the relationship between the insulin-related dietary indices, BMI, physical activity and 24-h urinary C-peptide, and among the insulin-related dietary indices.
Generalised linear models were used to examine the association of EDIH, dietary insulin index and dietary insulin load with 24-h urinary C-peptide concentrations. All insulin-related dietary indices were adjusted for total energy intake using the residual method(Reference Willett, Howe and Kushi21) and then categorised into tertiles. We also used a continuous variable of the insulin-related dietary indices with unit of 1-sd increment. Multivariable-adjusted models included age (continuous), physical activity (continuous), co-morbidity score (continuous), NSAID use (yes or no) and smoking status (never, past or current). We conducted an additional model further including BMI (continuous) to examine whether the association between the insulin-related dietary indices and 24-h urinary C-peptide mediates through adiposity.
We examined stratified analysis of EDIH, dietary insulin index and dietary insulin load with 24-h urinary C-peptide by BMI (<25 or ≥25 kg/m2), physical activity (<median or ≥median) and a combination of the two variables (lean and active, lean and sedentary, overweight/obese and active or overweight/obese and sedentary). Test for interaction was conducted (Wald test) by including a cross-product term of each insulin-related dietary index and stratification variable in the models. We further examined the joint association of EDIH (tertile) and dietary insulin index (tertile) with 24-h urinary C-peptide concentrations.
As a sensitivity analysis, instead of using a single FFQ closest to 24-h urine collection, we used two FFQ, assessed in 2010 and 2012, to examine the association of average EDIH, dietary insulin index and dietary insulin load with 24-h urinary C-peptide concentrations. Because insulin sensitivity may partly mediate through muscle mass, we conducted an additional multivariable-adjusted model further adjusting for predicted lean body mass. Given that BMI may not be a perfect measure of adiposity, we also ran a multivariable-adjusted model using predicted fat mass. Lastly, we examined the association between ELIH and 24-h urinary C-peptide to see if ELIH, a more comprehensive score of lifestyle factors including diet, BMI and physical activity, is more strongly associated with 24-h urinary C-peptide.
All statistical analyses were performed using SAS, version 9.4 (SAS Institute Inc). All tests were two-sided and P < 0·05 was considered statistically significant.
Results
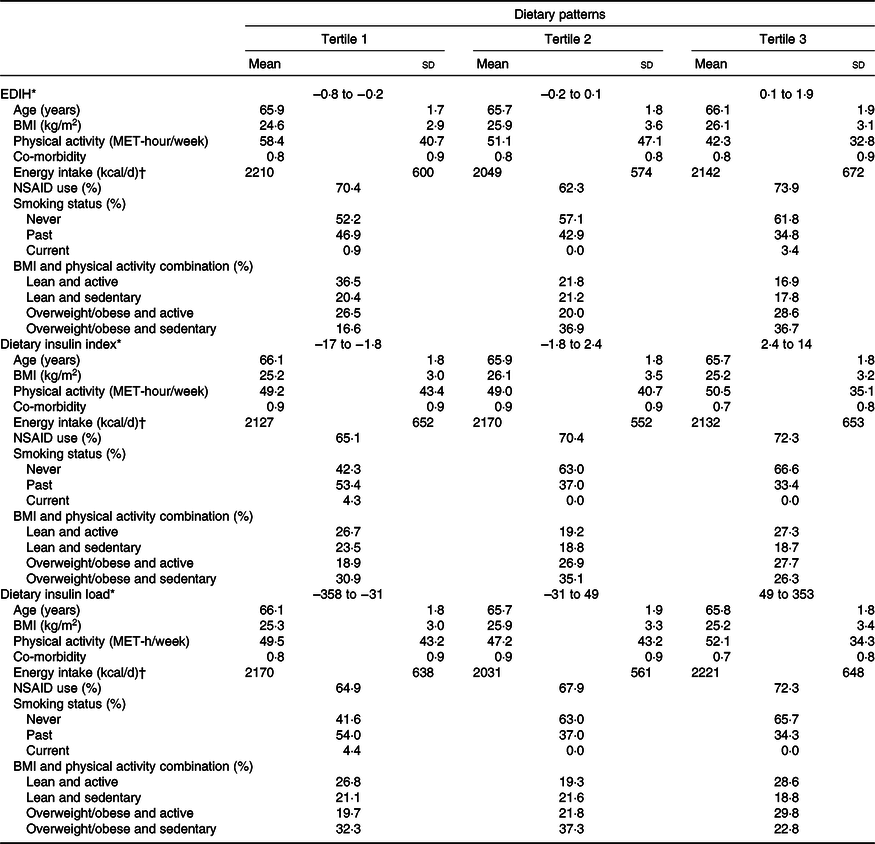
Age-adjusted characteristics of participants by tertiles of insulin-related dietary indices (i.e. EDIH, dietary insulin index and dietary insulin load) are presented in Table 1. The mean age, BMI and physical activity levels were 65·9 years, 25·5 kg/m2 and 50·0 metabolic equivalent task-hour/week (online Supplementary Table S1). Participants in the highest tertile of EDIH had higher BMI and lower physical activity levels. In contrast, BMI and physical activity levels were similar across tertile of dietary insulin index and dietary insulin load. Moreover, participants with higher scores on all three insulin-related dietary indices were more likely to be never-smokers. Compared with the main HPFS cohort, our study samples from the MLVS were younger and more active and had less co-morbidities (online Supplementary Table S1). The Spearman correlation of EDIH with dietary insulin index and dietary insulin load were 0·21 and 0·18, respectively (online Supplementary Table S2).
Age-adjusted characteristics of participants by empirical dietary index for hyperinsulinaemia (EDIH), dietary insulin index and dietary insulin load in the Men’s Lifestyle Validation Study (n 293) (Mean values and standard deviations for continuous variables and percentages for categorical variables)
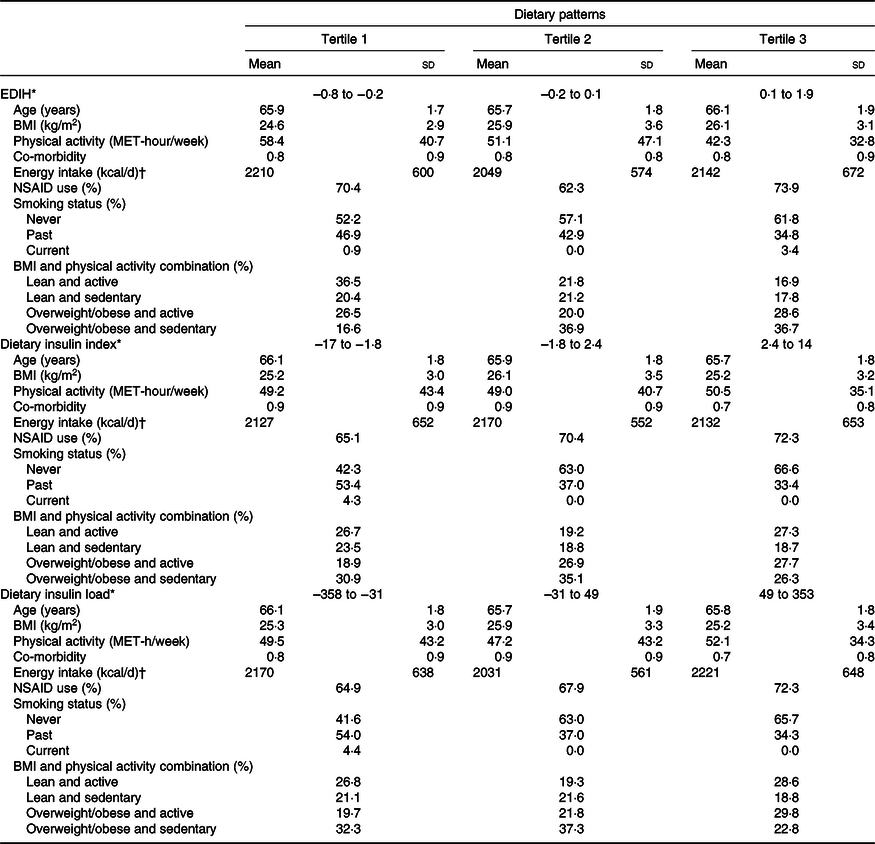
MET, metabolic equivalent task; NSAID, non-steroidal anti-inflammatory drug.
* Adjusted for energy intake.
† To convert energy values from kcal to kJ, multiply by 4·184.
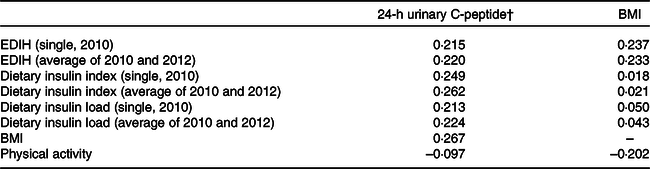
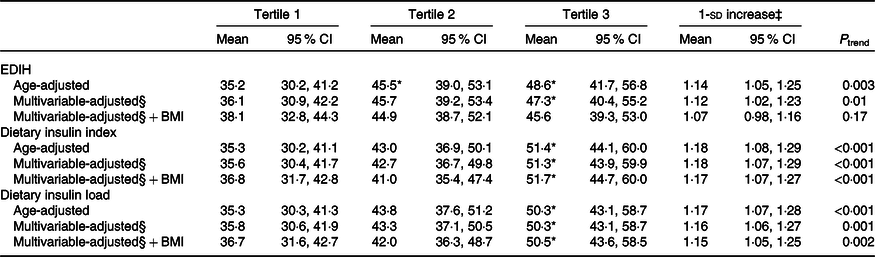
In Table 2, EDIH, dietary insulin index and dietary insulin load showed similar correlations with 24-h urinary C-peptide but only EDIH, not dietary insulin index and dietary insulin load, was correlated with BMI. Moreover, higher EDIH, dietary insulin index and dietary insulin load scores were associated with higher levels of 24-h urinary C-peptide concentrations (Table 3). Compared with participants in the lowest tertile of EDIH, dietary insulin index and dietary insulin load, those in the highest tertile had significantly higher levels of 24-h urinary C-peptide after adjusting for potential confounders. Relative concentrations (or relative ratio) of 24-h urinary C-peptide per 1-sd increase in insulin-related dietary index was 1·12 (95 % CI 1·02, 1·23) for EDIH, 1·18 (95 % CI 1·07, 1·29) for dietary insulin index and 1·16 (95 % CI 1·06, 1·27) for dietary insulin load, respectively. When we further adjusted for BMI, the relative concentrations of C-peptide for EDIH attenuated to 1·07 (95 % CI 0·98, 1·16), while the relative concentrations for dietary insulin index and dietary insulin load remained consistent. Additional adjustment for predicted lean body mass or fat mass did not change the results (data not shown).
Associations of empirical dietary index for hyperinsulinaemia (EDIH), dietary insulin index and dietary insulin load with 24-h urinary C-peptide and BMI (n 293)*
(Spearman correlation coefficients)
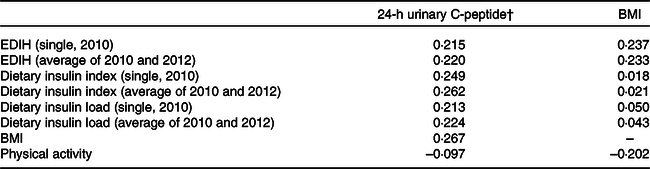
* Correlations were adjusted for energy intake.
† 24-h urinary C-peptide was log-transformed.
Association of empirical dietary index for hyperinsulinaemia (EDIH), dietary insulin index and dietary insulin load with 24-h urinary C-peptide in the Men’s Lifestyle Validation Study (n 293)† (Mean absolute concentration (ng/ml) values and 95 % confidence intervals)
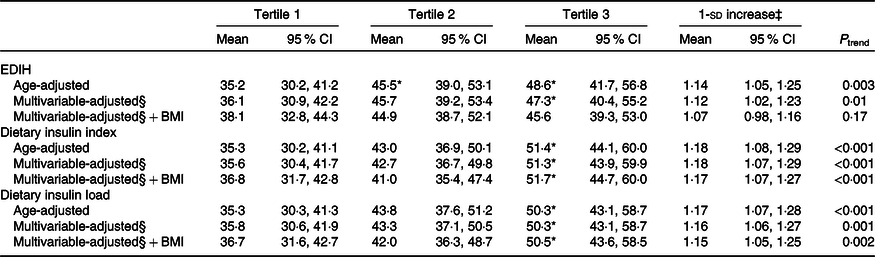
* Significantly different from tertile 1 (P < 0·05).
† Values are absolute 24-h urinary C-peptide and its 95 % CI (ng/ml). EDIH, dietary insulin index and dietary insulin load were adjusted for energy intake using the residual method.
‡ Absolute concentrations with 95 % CI of 24-h urinary C-peptide per 1-sd increase in dietary index.
§ Multivariable-adjusted models included age (continuous), physical activity (continuous), co-morbidity score (continuous), non-steroidal anti-inflammatory drug use (yes or no) and smoking status (never, past or current). Multivariable-adjusted + BMI models further included BMI (continuous).
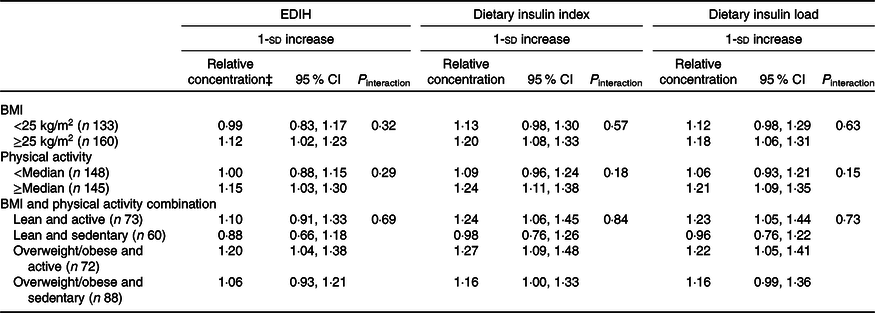
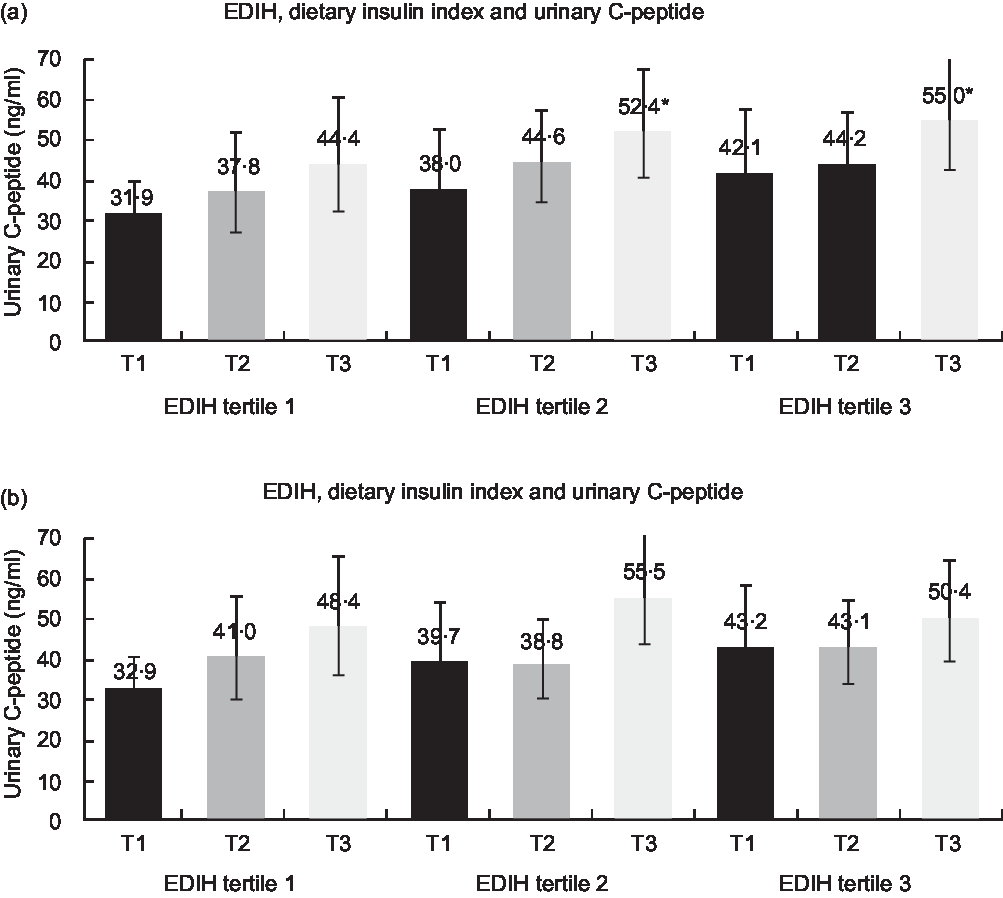
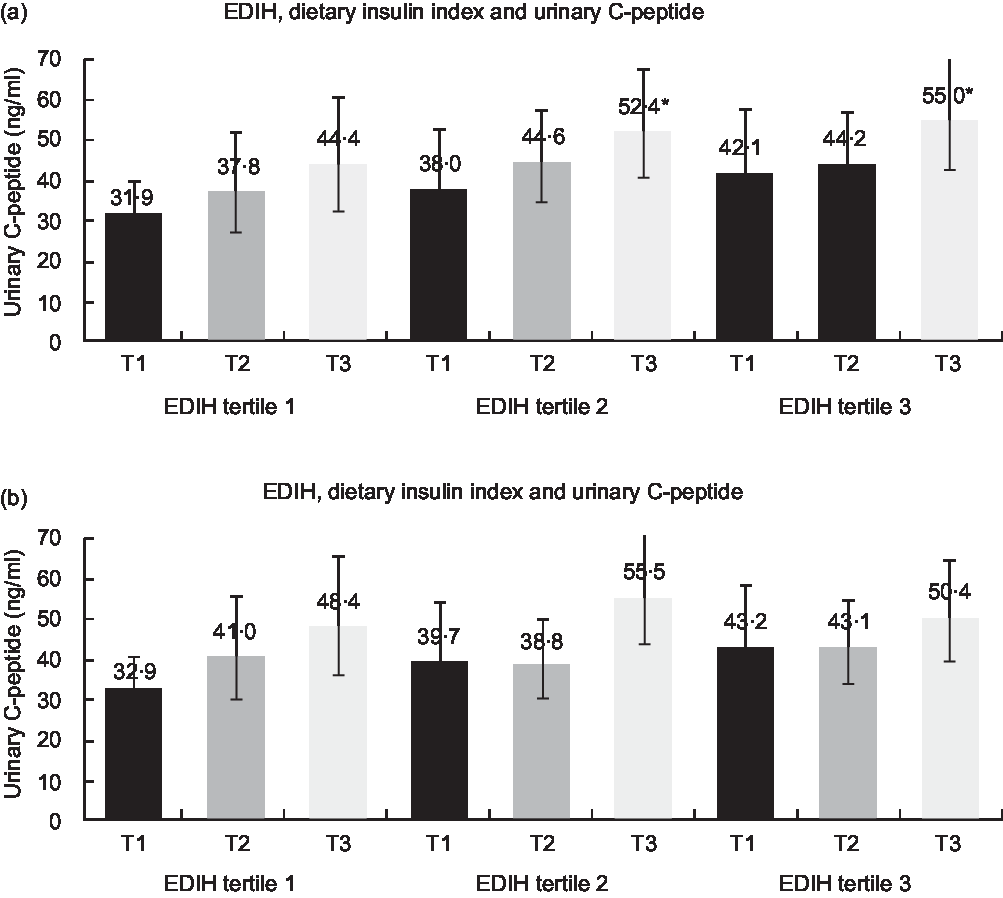
In stratified analyses of insulin-related dietary indices and 24-h urinary C-peptide by BMI and physical activity, we found no significant interactions by BMI and physical activity (or their combination) (P interaction > 0·05) (Table 4). However, the positive associations for all insulin-related diet indices tended to be stronger among overweight/obese and/or active participants. In Fig. 1, we examined the joint association of EDIH and dietary insulin index with 24-h urinary C-peptide. Compared with participants in both lowest tertiles of EDIH and dietary insulin index, those in both highest tertiles had significantly higher levels of 24-h urinary C-peptide (31·9 v. 55·0 ng/ml). Additional adjustment of BMI slightly attenuated the association.
Stratified analyses of empirical dietary index for hyperinsulinaemia (EDIH), dietary insulin index and dietary insulin load with 24-h urinary C-peptide in the Men’s Lifestyle Validation Study (n 293)* † (Relative concentration values and 95 % confidence intervals)
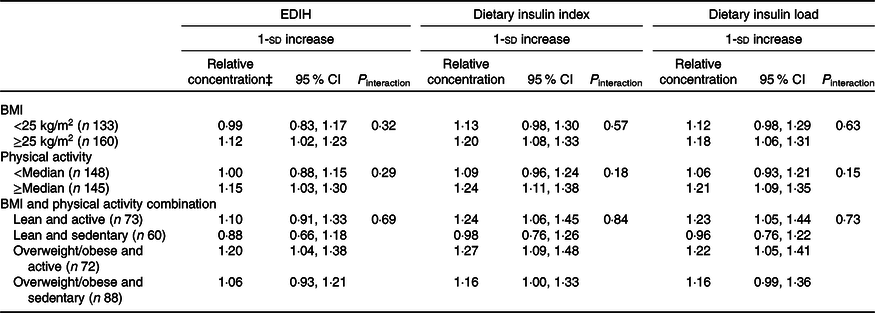
* Values are relative difference in 24-h urinary C-peptide and its 95 % CI (ng/ml) associated with 1-sd increase in EDIH, insulin index or insulin load. EDIH, dietary insulin index and dietary insulin load were adjusted for energy intake using the residual method.
† All models included age (continuous), physical activity (continuous), co-morbidity score (continuous), non-steroidal anti-inflammatory drug use (yes or no), smoking status (never, past or current) and BMI (continuous).
‡ Relative concentrations with 95 % CI of 24-h urinary C-peptide per 1-sd increase in dietary index.
Joint association of empirical dietary index for hyperinsulinaemia (EDIH) and dietary insulin index with 24-h urinary C-peptide. Values are means of 24-h urinary C-peptide with 95 % confidence intervals (ng/ml). (a) Adjusted for the same covariates as the multivariable models in Table 2. (b) Further adjusted for BMI. T1, tertile 1 of dietary insulin index, T2, tertile 2 of dietary insulin index, T3, tertile 3 of dietary insulin index. * Significantly different from participants in both lowest tertiles of EDIH and dietary insulin index (P < 0·05).
In a sensitivity analysis using two repeated measures of FFQ, we found the consistent positive associations between the average of EDIH, dietary insulin index and dietary insulin load with 24-h urinary C-peptide (online Supplementary Table S3). Moreover, overall results did not change when we used the residual method for BMI adjustment (online Supplementary Table S4). Lastly, when we used ELIH, instead of EDIH, we found a stronger positive association with 24-h urinary C-peptide. The relative concentration of 24-h urinary C-peptide per 1-sd increase in ELIH was 1·26 (95 % CI 1·16, 1·38).
Discussion
Long-term average insulin exposure may be an important predictor of diseases such as cancer. Two indices have been used to assess the influence of diet on insulin exposure in epidemiological studies. Dietary insulin index directly measures the effect of a particular food on insulin secretion immediately after a meal, independent of the state of insulin resistance(Reference Holt, Miller and Petocz6). In contrast, EDIH is an empirical hypothesis-oriented dietary index based on usual diets that are predictive of fasting plasma C-peptide, which is more reflective of insulin resistance than insulin secretion(Reference Tabung, Wang and Fung8). However, it is unknown how these two different insulin-related dietary indices predict long-term average insulin secretion, which may be more directly assessed with 24-h urinary C-peptide(Reference Hoogwerf and Goetz22,Reference Jones and Hattersley23) . To address this knowledge gap, in a cross-sectional study of 293 men, we found that all insulin-related indices including EDIH, dietary insulin index and dietary insulin load were significantly positively associated with 24-h urinary C-peptide.
In a previous cross-sectional study, we found that EDIH but not dietary insulin index nor dietary insulin load was strongly predictive of both fasting and non-fasting plasma C-peptide(Reference Willett24). Plasma insulin (C-peptide) concentration is determined both by insulin secretion and insulin clearance(Reference Haffner, Stern and Watanabe25,Reference Jones, Abbasi and Carantoni26) . In the insulin resistance state, insulin clearance decreases physiologically as a compensatory mechanism, preserving β-cell function and insulin levels(Reference Mittelman, Van Citters and Kim27). Twenty-four-hour urinary C-peptide may not be a good measure of insulin clearance or insulin resistance but is a more comprehensive and integrated measure of insulin secretion. Our findings suggest that both EDIH and dietary insulin index are good measures of dietary factors that stimulate long-term average insulin secretion. Both factors associated with insulin resistance (e.g. EDIH) and insulin secretion directly (e.g. dietary insulin index) should ultimately increase 24-h urinary C-peptide.
In a person with high insulin sensitivity (e.g. lean, physically active, low EDIH diet), a diet with high dietary insulin index and dietary insulin load will stimulate secretion of insulin. This may increase 24-h urinary C-peptide, but the circulating insulin will remain relatively low because it is rapidly cleared. Insulin resistance will increase circulating insulin levels but in part or mostly by reducing clearance rate. Interestingly, prospective cohort studies have shown that EDIH was predictive of weight gain(Reference Tabung, Satija and Fung28), type 2 diabetes, and cancers such as digestive system cancers(Reference Wang, Fung and Wang29,Reference Tabung, Wang and Fung30) and multiple myeloma(Reference Lee, Fung and Tabung31), while dietary insulin index and dietary insulin load were not predictive of diseases that are associated with hyperinsulinaemia (e.g. type 2 diabetes, colorectal(Reference Bao, Nimptsch and Meyerhardt32) and pancreatic cancers(Reference Bao, Nimptsch and Wolpin33)). These findings may suggest that these diseases may be more associated with diets reflective of insulin resistance (high circulating insulin) than with diets that stimulate insulin secretion, because the insulin may be rapidly cleared in a highly insulin sensitive person.
Because dietary insulin index is a different construct and weakly correlated with EDIH, the two indices provide complementary information for the 24-h urinary C-peptide. For example, overall, men in the high tertile of dietary insulin index have a 39 % higher C-peptide level compared with those in the low tertile of dietary insulin index. However, men in the high tertiles of both dietary insulin index and EDIH had a 72 % higher C-peptide level than those in the low tertiles of both. Thus, men in the high or low tertiles of dietary insulin index can be further classified based on their EDIH. Taking into account, both measures may optimally predict total insulin secretion.
Our analysis showed correlation coefficients of 0·24 for EDIH, 0·02 for dietary insulin index and 0·05 for dietary insulin load in relation to BMI, which is a strong predictor of insulin resistance. Adjusting for BMI, a potential mediator, attenuated the observed positive association between EDIH, but not dietary insulin index/insulin load, and 24-h urinary C-peptide. This finding suggests that increased BMI may be a potential mediator in part linking EDIH to insulin resistance.
In stratified analyses, we found no significant interactions by BMI or physical activity. However, the positive associations (relative concentrations) between insulin-related dietary indices and 24-h urinary C-peptide appeared to be stronger among overweight/obese or active individuals. Yet, we observed substantially higher absolute 24-h urinary C-peptide concentrations across all tertiles among overweight/obese individuals, compared with those among lean individuals. Although we found stronger positive associations among active individuals, compared with sedentary individuals, active individuals with low-insulinaemic diets had relatively lower absolute 24-h urinary C-peptide concentrations, compared with sedentary individuals with low-insulinaemic diets. These findings are in line with a previous study that showed a lower concentration of fasting C-peptide among lean and/or active individuals with low EDIH scores(Reference Tabung, Wang and Fung8).
Our study has several limitations. First, we used single measure of 24-h urinary C-peptide and thus there could be measurement error. It would be ideal to have multiple measures of 24-h urinary C-peptide to reduce measurement error and to assess long-term insulin excretion. Second, diets and other lifestyle factors were measured using self-reported questionnaire and thus measurement error is inevitable. However, previous validation studies of diet(Reference Hu, Rimm and Smith-Warner16,Reference Rimm, Giovannucci and Stampfer17) , physical activity(Reference Chasan-Taber, Rimm and Stampfer34) and anthropometric measures(Reference Rimm, Stampfer and Colditz35) showed reasonably high validity and reproducibility. Third, the observational design of the present study limits causal interpretation of our findings. Lastly, our cohort predominantly included relatively healthy, white health professionals which may limit the generalisability of our findings, though the accurate reporting of this population of highly educated health professionals strengthens the internal validity of the study.
In conclusion, we found that higher intakes of diets with high insulinaemic potential, indicated by higher EDIH, dietary insulin index and dietary insulin load scores, were associated with higher 24-h urinary C-peptide concentrations. Our study suggests that EDIH, dietary insulin index and dietary insulin load are useful dietary indices that predict long-term integrated measure of insulin secretion. Moreover, findings from the BMI adjustment further confirm the underlying constructs of EDIH (insulin resistance) and dietary insulin index/insulin load (insulin secretion), suggesting that these biological dimensions of diet may play different roles in the aetiology and/or prognosis of diseases.
Acknowledgements
This work was supported by the National Institutes of Health (R01 HL35464, UM1 CA167552, K99 CA207736 and R00 CA207736).
Conception or design of the work: D. H. L., E. L. G., F. K. T.; Data collection: E. L. G., F. K. T.; Data analysis and preparation of the initial draft: D. H. L.; Data interpretation and critical revision of the article: D. H. L., E. L. G., F. K. T.; Final approval of the version to be published: D. H. L., E. L. G., F. K. T.
The authors declare that there are no conflicts of interest.
Supplementary material
For supplementary material referred to in this article, please visit https://doi.org/10.1017/S0007114520002184