


1. Introduction
The Arctic basin is a key area for polar marine climate processes. Most of the year, the area is covered by multi-year and seasonal sea ice. However, ice extent, observed by satellite continuously since 1979, shows a substantial decreasing trend of about 11% per decade in summer and 2–3% per decade in winter (Reference Stroeve, Holland, Meier, Scambos and SerrezeStroeve and others 2007, Reference Stroeve2008, and updates by the US National Snow and Ice Data Center (NSIDC) including 2009 observations). In September 2007, the lowest monthly mean ice extent since 1979 was recorded. Model projections from coupled climate models (General Circulation Climate Models, GCMs) with limited spatial resolution project an Arctic Ocean with mean minimum summer sea-ice concentrations less than 15% in all 2˚×2˚ cells for the years 2035–2100 (Reference SolomonSolomon and others, 2007; Reference Boe, Hall and QuBoe and others 2009; Reference Wang and OverlandWang and Overland 2009). However, the spatial resolution of the models is limited, and important feedback processes are not yet considered sufficiently in most GCMs (see, e.g., Reference Walsh, Kattsov, Chapman, Govorkova and PavlovaWalsh and others, 2002; ACIA, 2005; Reference SolomonSolomon and others, 2007). the trends of modeled GCM Arctic sea-ice extent are generally weaker than observations for the period 1979–2009.
Knowledge of in situ conditions of Arctic sea ice is necessary to better understand and quantify the sea-ice status, its changes and the relevant processes. Such in situ data exist from ship expeditions (e.g. C. Haas and J.L. Lieser, 10.1594/PANGAEA.327029; Reference PerovichPerovich and others, 2009), drifting stations and drifting ships (Reference Radionov, Bryazgin and AleksandrovRadionov and others, 1996; Reference RomanovRomanov, 1996; Reference WarrenWarren and others, 1999; Reference Frolov, Gudkovich, Shirochkov and TimokhovFrolov and others, 2005; Reference GascardGascard and others, 2008; Reference Makshtas, Sokolov, Kuznetsov, Frolov, Gerland, Eicken, Perovich and YangMakshtas and others, 2010), submarine transects (e.g. Reference WadhamsWadhams, 1990; Reference Rothrock, Yu and MaykutRothrock and others, 1999; Reference Kwok and RothrockKwok and Rothrock, 2009) and visits by airplanes (e.g. Sever expeditions: Reference Frolov, Gudkovich, Shirochkov and TimokhovFrolov and others, 2005; Reference Alexandrov, Sandven and JohannessenAlexandrov and others, 2010). During the International Polar Year 2007–08, enhanced sea-ice research was conducted in the High Arctic (e.g. Reference GascardGascard and others, 2008).
Since the 19th century, explorers such as F. Nansen (Reference NansenNansen, 1897, Reference Nansen1906; Reference JohansenJohansen, 2003), G. Nares, R. Peary and F. Cook have traveled on the Arctic basin sea ice. In modern times, adventurers seek challenges in traveling large distances on the Arctic basin, mostly on skis during March– May when both weather and ice conditions are more favorable than at other times of year. Scientific icebreaker cruises cannot be performed easily at that time. Therefore, most spring-season scientific data have been obtained from drift stations or from airborne and satellite work, and additional data collected by adventurers are of particular interest and value. More and more adventurers and tourists and their supporters visit the Arctic basin every spring and could potentially provide a great opportunity to gather valuable scientific data.
The sea-ice snow cover has several key roles. Owing to its high albedo, before the onset of melt snow reflects most of the incoming solar radiation and therefore significantly affects the surface energy balance of the Arctic Ocean, preventing heating of the mixed layer. the attenuation of shortwave radiation in snow controls the light budget in and under the sea ice, which is important for the ecosystem. Furthermore, the snow cover insulates and reduces ice-growth rates once it is cold. the effect of snow on sea-ice growth and melt is detailed in numerous one-dimensional model studies (e.g. Reference Maykut and UntersteinerMaykut and Untersteiner, 1971).
Snow-depth data, along with ice thickness and snow and ice density, are necessary for validation and calibration of satellite data, since snow modifies the sea-ice freeboard through isostatic balance. For example, laser (NASA’s Ice, Cloud and land Elevation Satellite (ICESat): Reference ZwallyZwally and others, 2002; Reference Kwok, Cunningham, Zwally and YiKwok and others, 2006, Reference Kwok, Cunningham, Wensnahan, Zwally and Yi2009) and radar altimeters (the European Space Agency’s (ESA) CryoSat-2, Envisat and ERS satellite sensors: Reference Laxon, Peacock and SmithLaxon and others, 2003; Reference WinghamWingham and others, 2006; Reference GilesGiles and others, 2007, Reference Giles, Laxon and Ridout2008) determine the ice freeboard from which ice thicknesses can be retrieved only if realistic assumptions are made about snow thicknesses. the ESA even endorses selected adventurer traverses to collect scientific data. Consequently, more snow-thickness information is required for all seasons.
In this paper, we discuss possible observation schemes for expeditions by adventurers willing to do such types of observations. Consistent observations increase the quality and usefulness of such data. Examples from four expeditions are shown, focusing on snow thickness. We also briefly discuss ice-thickness estimates and measurement possibilities. However, these measurements are more difficult: they are either inaccurate and biased, or tedious and time-consuming, and when done properly they depend on heavy and advanced measurement equipment (if indirect methods are applied). Other data and observations (e.g. meteorology, animal observations) were also made on some of the traverses but are not discussed here.
2. Observation Scheme and Methods Applied
Typically, adventurers traverse the Arctic basin by ski, hauling heavy sledges. Therefore, it is crucial to keep the weight of any scientific equipment to a minimum. Often adventurers have the ambition to do their trips unsupported (without depots along the route). In recent years, shorter trips have become popular, covering ‘the last degree’ between the North Pole and the temporary ice airstrip ‘Barneo’ operated by a Russian company during April. These trips are not discussed in this paper; instead we focus on longer trips covering large transects between the coasts and the North Pole and beyond.
There are several factors limiting the degree of detail and the number of parameters to be recorded: (1) lack of scientific training of the individual observer; (2) weight limitations; and (3) time restrictions, dedication and fatigue.
-
1. the lack of scientific training of the individual observer prevents observations requiring special experience. Also, it cannot be expected that the observers can respond to unexpected, unknown or any other very demanding events or processes, which a scientist would assess as interesting and investigate more closely.
-
2. Weight limitations are often very high. This may be addressed by modifying originally non-scientific equipment used for travel to serve both the original and scientific purposes. For example, length scale marks can easily be added to ski poles to use them for snow- and ice-thickness measurements, as done by B. Ousland and A. Hubert (see section 4). When it comes to other measurements, very light sensors have a higher chance of being used than heavier ones. It is often not possible for samples to be brought back, but on-site measurements of samples could be more realistic (e.g. snow density, but this was not done for the expeditions discussed in this paper). GPS receivers are usually carried as standard equipment.
-
3. Time is often crucial. the traverses make immense physical demands on the adventurers and it cannot be expected that scientific tasks will have high priority among the daily duties required during a traverse. Therefore, observations that take little time are more likely to be done than time-consuming observations. the amount and frequency of observations needs to be adjusted so that the program is realistic. Generally, performing measurements at the end of the day is demanding, and corresponding limitations are obvious.
Following modified versions of an observation scheme developed by M. Cornelissen and C. Haas (unpublished information), recent expeditions typically log the following parameters: position (GPS), snow thickness, ice thickness, photographs of typical ice conditions, and comments on any peculiar observations. Regarding the observation site spacing and number of observations, more detailed observations were done in slightly different ways for the four expeditions listed. For snow thicknesses, the first two expeditions (1994 and 2001) include individual observations made while traveling, whereas the last two expeditions (in 2007) have collected more measurements (~50–100) at distinctive sites during the traverses. Ice thickness, which is discussed more at the end of this paper, was measured on blocks where ice was rafted or ridged to the surface, but these data are generally not representative and are not included in this paper.
3. Data
Three of the four expeditions (Fig. 1) discussed here are very similar, each of them starting close to Severnaya Zemlya, Russia, at the beginning of March. All three went to the North Pole and reached their destination in the second half of April. Two of the expeditions continued to northern Canada and North Greenland, respectively. the fourth and most recent expedition included here was carried out in May–June 2007; it started at the North Pole and ended at the Russian archipelago of Franz Josef Land. Data collection schemes were continuously refined after the first expedition in 1994, when only a basic data collection scheme was followed. In the earlier expeditions, ice-thickness observations had the highest priority, whereas in the later expeditions snow thickness was prioritized due to the wishes of scientists and methodological considerations. the resolution of the data collected varied. In 1994, data were collected with 10cm resolution. For NP-2001, snow thicknesses are given in 5 cm resolution, often as ranges (min. and max. for a section). Arctic Arc 2007 and NP-2007 snow thicknesses are available at 1 cm resolution. Depending on the number of data collected and the geographical positions available for sites and days, either individual data are shown or daily or site means. More details of the individual expeditions and their measurements are given below and in Table 1 and 2.
Map of the Arctic Ocean with routes of the four expeditions discussed in this paper: NP-1994 from Severnaya Zemlya to the North Pole (dotted line); NP-2001 from Severnaya Zemlya to Ward Hunt Island, Canada (dashed-dotted line); NP-2007 from the North Pole to Franz Josef Land (dashed line); and Arctic Arc 2007 from Severnaya Zemlya to North Greenland (solid line).

Overview of expeditions discussed in this paper. POS = position; IT = sea-ice thickness; ST = snow thickness; DST = detailed snow thickness; GIO = general ice observations/descriptions; OMET = occasional meteorological observations; AOT = animal observations and tracks

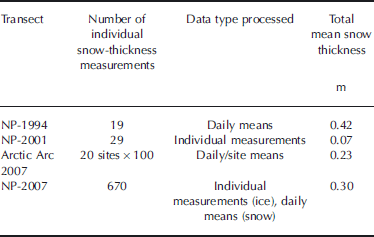
Background information on snow-depth data collected during the four expeditions presented, including total means of daily means (NP-1994, Arctic Arc 2007 and NP-2007) and means of individual data (NP-2001)
4. Results
In this section we give an overview of individual results from the four selected expeditions. These results and how they were collected are the basis for the assessment, discussion and recommendations that then follow.
4.1. NP-1994
This solo ski traverse by B. Ousland from Norway started at Cape Arctichesky, Severnaya Zemlya, on 2 March 1994 and ended at the North Pole on 23 April (dotted track in Fig. 1; Table 1). This is the first of the traverses shown and the observation scheme was less detailed than in later traverses. Snow-thickness and sea-ice-thickness measurements were made with a marked ski pole sounding the snow layer and on ice blocks pushed up on the ice at ridged/rafted sections, respectively. on this expedition, ice-thickness measurements (77 individual measurements) were a higher priority than snow-depth measurements (19 individual measurements). Thicknesses were measured with a resolution of 10cm and only one to five measurements per site were made, with ice thickness being prioritized. Very few observations were made beyond 87˚ N. Some basic meteorological observations (air temperature, wind) and ice features (ridges, leads) were noted. Daily means of up to three snow thicknesses noted during a day were calculated (Fig. 2). Geographical positions (Fig. 1) needed to be reconstructed from notes and a map plotted in Reference Ousland and OsloOusland (1994).
Snow depth vs geographical latitude for the four expeditions discussed in this paper. See legend for markers.

Snow-depth data (Fig. 2) are too sparse and variable for discussion of any spatial trend. the mean snow thickness for all day means was 0.42 m.
4.2. NP-2001
The NP-2001 traverse by B. Ousland also started at Cape Arctichesky, led to the North Pole and from there to Ward Hunt Island, Arctic Canada (dashed-dotted track in Fig. 1; Table 1 and Table 2; Reference OuslandOusland, 2001). Snow and sea-ice thicknesses were measured, but snow thickness only in the first part of the traverse up to 86˚N (Fig. 2). In total, 29 individual snow-thickness measurements were made. Compared with the 1994 data, snow depth was relatively small throughout, with a mean of 0.07m for all measurements.
4.3. 2007 Arctic Arc
The Arctic Arc expedition with two skiers from Belgium (A. Hubert and D. Dansercoer) started on 1 March 2007 at Cape Arctichesky, reached the North Pole on 24 April 2007 and ended in North Greenland on 14 June 2007 (solid track in Fig. 1; Table 1 and Table 2). At each of 20 sites, 100 snow-thickness measurements were collected over a length of 400 m with an average spacing of 4 m, resulting in a total of 2000 individual measurements (Reference Hubert and DansercoerHubert and Dansercoer, 2007). This set-up implies that these are systematic measurements at individual sites on floe-scale spatial order of magnitude, which is different to individual measurements spread out over many kilometers (as done under NP-1994 and NP-2001; see sections 4.1 and 4.2). In addition to the snow measurements and position, information was collected on air temperature, air pressure, wind speed and direction, clouds and visibility. General weather conditions were described, as well as the type and surface characteristics of the sampled floe. Data and observations are summarized in a report (Reference Hubert and DansercoerHubert and Dansercoer, 2007), which was part of a pre-launch validation activity in preparation for the ESA CryoSat-2 mission.
Snow thicknesses were mostly <0.2m between Siberia and the North Pole, and mostly >0.2m between the North Pole and Greenland (Fig. 2 and 3). the mean snow thickness of all site means was 0.23 m. the systematic measurements along 100m profiles also allow the calculation of standard deviations, which bear information on the snow-thickness variability at each site (Fig. 3). As mean thicknesses can be biased by variable numbers of measurements in thick snow surrounding ridges, modal thicknesses may be better suited to represent the dominant snow thickness at each site, which typically also represents the snow thickness on level ice. This information reveals that most of the first-year ice surveyed in the eastern Arctic was almost snow-free, with modal thicknesses of 0m (Fig. 3). More insight into regional differences is obtained from histograms of data from three major regions along the track (Fig. 4). These also show that in March/April 2007 most ice on the Siberian side was snow-free (thickness zero; cf. individual modes in Fig. 3), and that there was hardly any snow thicker than 0.4 m. Across the Pole, snow thicknesses of 0.1–0.2m were obtained more frequently. These histograms are in stark contrast to that obtained for the western section south of 89.2˚ N, which was characterized by modal thicknesses of 0.2–0.35 m, and which included a large fraction of snow thicker than 0.5 m. the transition between the two latter histograms (Fig. 4b and c) also demarcates the region where the adventurers walked and camped predominantly on multi-year ice, while most of their measurements in the North Pole region were apparently still performed on first-year ice, although satellite data suggested the presence of significant amounts of second-year ice around the North Pole.
Same as Figure 2, but only for Arctic Arc 2007. Also included are standard deviations for the mean thicknesses (error bars), as well as modal snow thicknesses. Secondary modes indicate bimodal snow-thickness distributions.


4.4. NP-2007
This traverse of the skiers B. Ousland and T. Ulrich started in the beginning of May 2007 at the North Pole and ended at Franz Josef Land in mid-June 2007 (dashed track in Fig. 1; Table 1 and Table 2; Reference OuslandOusland, 2008). on several occasions long distances were covered in a short time using ski sails. As this was only possible on very level ice, it is probable that results are biased towards first-year ice and refrozen leads which had not yet undergone substantial deformation. the presence of predominantly first-year ice in the spring of 2007 is also indicated by satellite radar observations (Reference Kwok, Cunningham, Wensnahan, Zwally and YiKwok and others, 2009). Snow thickness was measured (almost) every day, with approximately ten individual measurements at the site where the tent was set up (Fig. 2). on five occasions, a more extensive snow measurement dataset (profile) was collected (50–60 individual measurements; see three examples in Fig. 5). Spacings were a few meters, meaning that the way the data were collected here is comparable with snow thicknesses collected during Arctic Arc 2007.
Snow depth was observed mainly in the range 0.20– 0.50 m. Snow thickness increased when moving southwards. Spatial gradients are not linear. For snow thickness, a prominent shift shows up at about 85˚ N. Further south, snow depth is larger. the three examples of probability density function (PDF) distributions of snow thickness for three individual sites (Fig. 5) show differences in modal and mean thicknesses, examples with more than one mode, and variability of the width of the snow-thickness distributions.
PDFs of snow thicknesses for three sites with about 50 individual measurements each (NP-2007). the data were collected at (a) 88˚50.7’ N, 51˚7.0’ E, (b) 86˚52.65’ N, 67˚57.0’ E and (c) 85˚58.2’ N, 69˚34.0’ E. See legends for dates of collection.

5. Discussion
Having discussed the four expeditions and datasets in section 4, we now briefly compare the results and then recommend choices and priorities for future observation schemes and set-ups.
A direct intercomparison of the different datasets collected is difficult, since fewer snow-depth data were collected on the early expeditions (1994 and 2001) than on the more recent ones (2007) and partly different regions were studied. However, the data give a good overview of the variability of snow thicknesses along the traverses, and information is most dense for the section between Severnaya Zemlya and the North Pole. Both the traverses from 1994 and 2001 have only snow-thickness data for the first part of the section. Values were on average higher in 1994 than in 2001 (Fig. 2). In 2007, data scatter least due to the averaging of a larger number of samples included in a daily mean estimate. the snow-thickness data from 1994 and 2001 are sparse and are probably insufficient for drawing any solid conclusions due to their large variability. However, they may also be indicative of the degree of interannual snow-thickness variability that may be expected in this sector of the Arctic basin. Measurements on the two expeditions in 2007 show a substantially different snow distribution for the eastern Arctic sector (north of Siberia) compared with the North Pole area and the area between the North Pole and Greenland (Fig. 3 and 4; Arctic Arc data). Later in 2007, the skiers Ousland and Ulrich recorded thicker snow in the eastern sector, several times >0.5mthick, probably now including new spring snow (Fig. 2 and 5).
Snow-thickness readings can be biased by very hard snow layers that may not be penetrable with a measurement pole. We cannot assess how much this may influence the results shown, but we can state that connected errors would be asymmetric (only underestimation of snow thickness). If the data presented here were affected, we would primarily see the area containing multi-year ice between Greenland and the North Pole as a potential area for this type of bias (measured as a part of Arctic Arc 2007), since especially here a combination of humid snow and strong winds in autumn could lead to concrete snow layers, as we have observed frequently on sea ice north of Ellesmere Island, Nunavut, Canada.
Assessing the value of the different observation protocols, a larger number of systematic snow-thickness measurements taken regularly at fixed latitudes or in the vicinity of overnighting sites along a transect seems to be the most feasible and valuable parameter to observe. By measuring systematically a larger number of values, the modal snow thickness within the surroundings of a site can be calculated. Modal snow thickness derived from a limited number of measurements is more representative for a region than mean snow thickness because it is not biased by variable numbers of measurements in thick snow surrounding ridges.
As detailed above, snow is an important climate parameter and it can be measured relatively easily, without bias and with enough measurements to derive modal thicknesses. Such datasets give a representative picture of the snow-thickness distribution at one site. In the expeditions in 2007, snow measurements were made with higher priority and the snow-thickness distributions and derived data shown in Figures 3–5 highlight how much more insight can be gained from larger snow-thickness datasets. Mean data and individual observations (single measurements along the route), as for example collected during the NP-1994 expedition (section 4.1), are not ideal since they are not sufficient to represent the complex nature of snow-thickness distributions, which are often bi- or trimodal and non-normally distributed. As most adventurer expeditions are carried out during March–May, few data exist from this source during other seasons. In summer, typically more scientific work is carried out on ship expeditions, but autumn and winter data remain sparse, despite the fact that these seasons are crucial for the freezing and ice growth in the seasonal cycle of Arctic sea ice.
6. Ice Thickness
Accurate and unbiased ice-thickness data are very difficult to collect on adventurer expeditions. When only ice-block thicknesses of newly formed ridges are measured, as undertaken to some degree in the expeditions NP-1994, NP-2001 and NP-2007, thinner ice is likely to be over-represented, since it is more likely to deform. Measuring ice thickness on rafted and ridged blocks presupposes ice-dynamic processes and related forcing not too long prior to the observation and it limits the observations to ice types that preferably become rafted and ridged. This may make the data useless.
Drillhole measurements are accurate, but for many adventurer expeditions a thickness drill is too large and heavy to take along. the drilling procedure is also time-consuming, so that often only a few measurements can be made. We are aware of only one adventurer expedition where extensive drillhole ice-thickness measurements have been performed, but it covered a distance of only about 400 km (Catlin 2009; see http://www.catlinarcticsurvey2009.com/). on that expedition, systematic drilling of first-year ice along with visual ridge-height estimates resulted in a PDF for the first-year fraction of the sea ice along the transect of that expedition.
Another reason in favour of adventurer expeditions concentrating mainly on snow-thickness measurements is the fact that the newest ice-thickness measurement technologies and infrastructures enable measurements over large areas of Arctic sea ice from the air in a relatively short time (e.g. Reference Haas, Hendricks, Eicken and HerberHaas and others, 2010). Therefore, snow thickness remains the single most important and most difficult sea-ice property to observe.
7. Conclusions
The collection of scientific sea-ice and snow data on laymen expeditions over Arctic sea ice is limited in its value; however, once rigid protocols and plans on spacing of measurements are followed, valuable data can be collected.
We have presented the potential for, and the feasibility of, snow-depth data collection during adventurer expeditions in the Arctic Ocean. Some data examples were given. These examples, along with general shortcomings in snow data for the Arctic basin, lead us to conclude that the first priority for observation schemes for adventurers should be multiple snow measurement transects with an order of magnitude of 100 independent measurements at sites at regular distances (order of magnitude 100km or less) along the traverses. By collecting these data consistently over the coming years, valuable new snow-thickness distribution datasets in spring can be expected. the data would provide valuable information for the validation of satellite products (including meso- and small-scale features) and for comparison with, and updating of, earlier observations (Reference Radionov, Bryazgin and AleksandrovRadionov and others, 1996; Reference RomanovRomanov, 1996; Reference WarrenWarren and others, 1999). They can also improve parameterizations for GCMs.
Taking the limitations during adventurer expeditions into account, we conclude that snow-thickness observations conducted during laymen expeditions are of higher value than ice-thickness measurements. Both parameters are of interest for the scientific community, but snow data can be retrieved much faster and with less bias than ice-thickness measurements. Ice thickness measured from ice blocks in ridges or from freeboard at floe edges is both selective and subject to larger measurement errors.
8. Outlook
There are more parameters that could be observed by adventurers, depending on how expeditions are set up in detail: for example, standard meteorological parameters including surface radiation balance. More emphasis could be put on statistics on open and refrozen leads, since this information is also important for satellite calibration and validation, and for climate modeling. In leads, the dimensions of the leads could be measured and the possibility of measuring the salinity and temperature of surface water could be explored, for example by using sensors and data loggers on kayaks or floating sledges, which are also frequently used by adventurers. Measuring unbiased and large datasets of ice thickness could be achieved if lightweight electromagnetic measurement systems integrated into a sledge system were to be developed based on existing technology (e.g. Reference Haas, Gerland, Eicken and MillerHaas and others, 1997).
Acknowledgements
We thank B. Ousland (and T. Ulrich in 2007) for collecting snow and ice data for the Norwegian Polar Institute on traverses over Arctic sea ice in 1994, 2001 and 2007, and A. Hubert and D. Dansercoer for collecting data during the Arctic Arc expedition in 2007. the ESA sponsored the latter expedition. M. Cornelissen contributed significantly to opening communication between scientists and adventurers. the help of A. Nicolaus with data work and O. Pavlova in producing the map (Fig. 1) is gratefully acknowledged. We are grateful for constructive comments by two anonymous reviewers, the scientific editor, K. Shirasawa, and the chief editor, M. Granskog. A part of this work is an element of the projects Damocles (European Union funded) and Prodex CryoSat Sea Ice (ESA and Norwegian Space Centre funded).



