Introduction
The most notable difference in the nutritive composition of maize silage and grass silage is the source of energy available to the ruminant from these two forages. Grass silage contains only minimal amounts of starch and relatively low levels of water-soluble carbohydrate; the main supply of energy is derived from fermentable fibre. In contrast, a large proportion of energy in maize silage is derived from starch. Starch is a readily fermentable source of energy, which has the potential to optimise the growth of the rumen microbial population and may be complementary to feeds high in soluble nitrogenous compounds such as grass. Optimisation of growth of the rumen population will subsequently influence the rate of microbial protein synthesis, the utilisation of nitrogen (N) and energy in the rumen and the production of energy substrates for the host animal such as volatile fatty acids (VFAs) (Elizalde et al., Reference Elizalde, Merchen and Faulkner1999).
Research has demonstrated that by changing forage-to-concentrate ratio, effectively increasing the starch content of the diet, the ratio of fat to protein gain in the carcass is reduced (Steen, Reference Steen1992; Steen and Robson, Reference Steen and Robson1995). Mechanisms that control the deposition of lean and fat include the pancreatic hormones (insulin and glucagon) and the hormones of the somatotrophic axis (GH and IGF-1). Thorp et al. (Reference Thorp, Wylie, Steen, Shaw and McEvoy2000) investigated the effects of forage-to-concentrate ratio, fed as equal digestible energies, on the circulating concentrations of insulin, IGF-1, glucagon and blood metabolites in growing beef steers. They reported increases in insulin and IGF-1 concentrations in addition to increases in plasma concentrations of the metabolites β-hydroxybutyrate and urea with increasing concentrate-to-forage ratio. It follows, therefore, that the addition of starch, provided either by the cereal grain of concentrates or by the grains in the maize silage in this study, may complement feeds that are high in soluble nitrogenous components, such as grass silage. This may result in the rumen microflora better utilising available nutrients that consequently influence the availability of energy and protein supplies to the host animal and ultimately the circulating concentrations of the hormones insulin, GH and IGF-1 and the metabolite glucose.
Juniper et al. (Reference Juniper, Browne, Fisher, Bryant, Nute and Beever2005) have previously shown, in an experiment investigating similar forage mixtures as described in this paper, that forage dry matter (DM) and starch intake increase linearly as maize silage replaces grass silage. This was associated with increasing live-weight gains. Other studies (Browne et al., Reference Browne, Juniper, Bryant and Beever2005) showed that N retention also increased linearly as maize silage replaced grass silage. The current study investigated the effects of substituting grass silage with graded levels of maize silage on rumen fermentation patterns and the circulating concentrations of insulin, GH and IGF-1 in growing steers.
Material and methods
Dietary treatments
Diets were one of four forage combinations. The forage portion of each diet comprised either grass (diet G) or maize (diet M) silage fed separately or as a mixture of the two silages. To provide the mixtures, maize and grass silage were mixed in the proportions 2 : 1 and vice versa (on a DM basis); thus, each silage comprised either 67 or 33 g/100 g total forage DM in the diet (i.e. diets GGM and MMG). Thorough mixing of the forages was performed using a small, self-propelled mixer wagon (Data Ranger, American Calan Inc., Northwood, NH, USA).
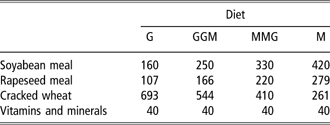
Diets were formulated to be isonitrogenous, each animal receiving 2 kg DM/day of a concentrate blend (Table 1) in order to equalise dietary crude protein (CP) intake at 140 g CP/kg DM. Each concentrate blend was formulated to account for the different protein contents of the different silage components and were based on the same ingredients, namely cracked wheat, soyabean meal, rapeseed meal and a vitamin and mineral supplement. Concentrates were divided and fed as two equal meals, the first at 0900 h and the latter at 1600 h. Feeding of forage took place once daily at 0900 h (except on the day of sampling) and water was available at all times. Uneaten food was removed daily prior to feeding and weighed to enable individual intakes to be recorded.
Ingredient composition of the forage mixture concentrates (kg/t freshweight)

G = 1000 g/kg grass; GGM = grass 670 g/kg, maize 330 g/kg; MMG = maize 670 g/kg, grass 330 g/kg; M = 1000 g/kg maize.
Animals
Four Holstein Friesian steers, with mean body weight of 425 ± 23.0, each fitted with a cannula into the dorsal sac of the rumen (40 mm i.d.) and a ‘T’ piece cannula (20 mm i.d.) in the proximal duodenum, were housed in individual tie stalls (Beever et al., Reference Beever, Kellaway, Thompson, MacRae, Evans and Wallace1978).
Ambient temperature and air circulation in the building housing the steers was controlled by blower fans and a ventilation sock. Artificial light was allowed for 12 h each day.
Experimental design
This experiment was conducted as a 4 × 4 Latin square design in which the four diets were fed to the four steers during four collection periods.
Experimental procedure
Each collection period lasted 5 weeks, with experimental diets fed for 24 days before duodenal and rumen sample collection. During the first 3 weeks of a collection period, silage was offered ad libitum, maintaining refusals at approximately 150 g/kg of daily intake. In order to minimise fluctuations in daily DM intake during sampling, the amount of forage offered was set at a constant freshweight 3 days before duodenal sample collection. This was calculated to be 100% of ad libitum intake as recorded during the previous week. Forage and concentrate offered was maintained at this level throughout digesta, faecal and blood sampling. Feed offered was sampled daily during the final 2 weeks of each collection period when digesta and faecal samples were collected.
On the day prior to blood sampling, an indwelling venous catheter was inserted into the jugular vein of each animal. Blood samples were collected on the final day of the collection period.
Nutrient flow to the duodenum
Nutrient flow at the duodenum was estimated by the dual phase marker technique (Faichney, Reference Faichney1975) using chromium-EDTA (Cr-EDTA; Downes and McDonald, Reference Downes and McDonald1964) to mark the fluid phase and ytterbium acetate as the particulate phase marker. Solutions of Cr-EDTA (3420 μg Cr/ml) and ytterbium acetate (845 μg Yb/ml) were continuously infused, via separate infusion lines, into the reticulo-rumen by means of a multi-channel peristaltic pump (Minipuls 2; Gilson, France). At the start of infusion a priming dose (290 ml) of each infusate solution, equal to one half of the daily dose, was poured into the rumen of each animal. An infusion rate of approximately 24 ml/h was then maintained for a period of 9 days. Infusate bottles were refilled regularly and weighed twice daily to maintain a constant infusion rate. Duodenal samples were collected during the final 72 h of infusion when equilibrium of marker concentration within the whole digestive tract was assumed to have been reached.
Before infusion started in the first collection period, 6 × 300 ml samples of duodenal digesta were collected from each animal over 2 days. This digesta was used to make the standard solutions against which Cr and Yb concentration was measured. During the last 72 h of infusion, samples of duodenal digesta (400 ml) were collected by gravity flow from the ‘T’ piece cannula. Duodenal samples were taken at 6-h intervals over 3 consecutive days such that a composite of 12 samples was obtained to represent samples taken every 2 h over a 24-h period. Duodenal samples were pooled on an equal-volume basis for each animal and stored at 2°C until they were processed on the day following the last sample collection.
Each bulk sample of duodenal digesta was stirred vigorously before being divided into two equal portions; one of these was centrifuged at 4000 rpm in a refrigerated (2°C) centrifuge (Heraeus Supatech, Megafuge 2.0R; Jencons Scientific Ltd, Bedfordshire, UK) and the supernatant discarded; the other portion was left as collected. Centrifuged digesta (CD) and whole digesta (WD) were oven dried at 55°C for 5 days in shallow polystyrene trays. Both were then milled through a 1-mm sieve in preparation for analysis.
Rumen fermentation characteristics
Samples of strained rumen fluid (40 ml) were taken during the day after infusion stopped, by means of a syringe attached to a filtering device. In all, 16 samples were collected from each animal at half, 1 h and 2-h intervals between 0700 and 2200 h. Rumen fluid pH was determined immediately (pH meter HI 8520; Hanna Instruments, Lingolstein, France). The sample was then divided into two equal volumes and stored in separate vials. One vial was used for VFA analysis and one for ammonia analysis. The latter was acidified with four drops of concentrated sulphuric acid to prevent volatilisation of ammonia. Both were immediately frozen. Rumen fluid samples were bulked on an equal-volume basis into four time period samples for analysis. These time periods were as follows: A: 0700 to 0900 h; B: 0930 to 1200 h; C: 1300 to 1600 h; and D: 1800 to 2200 h.
Total tract digestibility
Total tract digestibility was measured for 6 days following duodenal and rumen sampling. Each steer was fitted with a harness and plastic chute designed to collect faeces into a plastic tray, avoiding contamination with urine. Faecal output was weighed daily and a sample retained in proportion to fresh daily production. At the end of the collection period, faecal samples were bulked on an individual animal basis and a sub-sample stored at −20°C until analysed.
Blood sampling
On the day of sampling, 1 h prior to feeding, a sterile Vycon three-way tap was fitted to the end of the indwelling catheter. The heparin/saline mixture that had been left in the catheter to maintain patency overnight was removed and discarded, and a 10 ml blood sample drawn into a 10 ml syringe. The catheter was flushed with a 50 μ/ml heparin/saline solution (containing 300 mg Crystapen). Samples were then taken every 15 min thereafter for the following 12 h, the heparin/saline solution being removed and discarded at each sample and the catheter subsequently flushed after each sample. During blood sampling all animals were fed at 0800 h, immediately following the fifth sample. Following the final sample, the catheter was withdrawn and the area around the catheter site sprayed topically with a Terramycin aerosol.
Blood samples were immediately put into labelled 10 ml pre-treated sodium EDTA tubes and stored on ice. Every hour the samples were centrifuged for 10–15 min at maximum speed in a Gallenkamp bench top centrifuge. From the plasma fraction of each sample a 1 ml aliquot was placed into labelled polypropylene tubes (Sarstedt, Germany), using an Ependorf 1000 μl pipette. Samples were frozen and stored at −20°C until analysis by respective radioimmunoassays for determination of insulin and GH concentrations.
Radioimmunoassay
Insulin
The concentrations of insulin in plasma samples were determined using a ‘double-antibody’ radioimmunoassay, based on the method described by Reynolds et al. (Reference Reynolds, Huntington, Elsasser, Tyrell and Reynolds1989). Standards and antibodies were diluted in 1% bovine serum albumin phosphate-buffered saline (BSA-PBS). The standard curve was prepared by serial dilution of a stock solution of bovine monocomponent insulin standard (10 μg/ml) to give an upper standard of 20 ng/ml with the lowest standard of 0.3125 ng/ml. Intra-assay and inter-assay coefficients of variation were 0.120 and 0.104, respectively.
Growth hormone (GH)
The concentrations of GH in plasma samples were determined using a ‘double-antibody’ radioimmunoassay, based on the method described by Hart et al. (Reference Hart, Flux, Andrews and McNeilly1975). Standards and antibodies were diluted in BSA-PBS. The standard curve was prepared by serial dilution of a stock solution of bovine GH (1 μg/μl) to give upper and lower standards of 50 and 0.3906 ng/ml, respectively. Intra-assay and inter-assay coefficients of variation were 0.04 and 0.13, respectively.
Insulin-like growth factor-1 (IGF-1)
Determination of plasma concentrations of IGF-1 was carried out using a double-antibody radioimmunoassay, following acid ethanol extraction, according to the method described by Echternkamp et al. (Reference Echternkamp, Spicer, Gregory, Canning and Hammond1990). Standards and antibodies were diluted in radioimmunoassay diluent. The standard curve was prepared by serial dilution of a stock solution of recombinant human IGF-1 (1 ng/10 μl) to give upper and lower standards of 50 and 0.10 ng/ml, respectively. Intra-assay and inter-assay coefficients of variation were 0.03 and 0.06, respectively.
Feed sampling and chemical analysis
Oven DM content of concentrates and silage was determined by drying samples in a forced-draught oven at 100°C for 24 h. In order to take into account the DM of fresh silage lost in the form of volatile components during oven drying, the equation reported by Porter et al. (Reference Porter, Patterson, Steen and Gordon1984) was employed after determination of the concentrations of ethanol, lactic acid and VFA. Organic matter (OM) content was obtained by difference after ashing the dried sample in a muffle furnace at 550°C for 16 h. Neutral detergent fibre (NDF) and ammonium nitrogen were determined by methods described by MAFF (1986 and 1993). Starch was determined by polarimetry (MAFF, 1983) with random samples analysed using the enzymatic technique (MacRae and Armstrong, Reference MacRae and Armstrong1968) to verify the calibration of the polarimeter. Nitrogen content was measured by the Kjeldahl technique and water-soluble carbohydrate content was measured spectrophotometrically.
Statistical analysis
Experimental results for digestibility data were analysed using the GLM procedure of SAS (SAS Institute, Inc., Cary, NC, USA). Diets, animal and period were sources of variation with diet as the mean effect. The data set included 16 observations, with n = 4. Results are presented as least squares means (LSM).
Statistically significant differences between treatments for rumen fermentation characteristics and hormone concentrations were determined by analysis of variance (ANOVA) using the Mixed models procedure of SAS. Individual animals were used as the repeated subject, and period and time as the repeated measure. Sources of variation within the model for rumen fermentation characteristics included diet (2 d.f.), time (3 d.f.) and period (3 d.f.). Statistical tests were undertaken for main effects, first-order interactions and pairwise comparisons between treatment means using the Tukey simultaneous test method. Results are presented as LSM with the standard error of the difference (s.e.d.). Sources of variation for the IGF-1 data set were diet, animal and period. Insulin shared the same sources of variation but in addition included time. Data forming the GH profiles were analysed by the PC-PULSAR programme (Merriam and Wachter, Reference Merriam and Wachter1982), to determine profile characteristics, and then statistically significant differences were determined by ANOVA using the Mixed models procedure of SAS where animals was the repeated subject and period the repeated measure. Sources of variation were diet (2 d.f.) and period (3 d.f.). Results are presented as LSM with s.e.d.
The GLM was also employed to divide the effect of replacing maize silage with grass silage into linear and quadratic effects.
Results
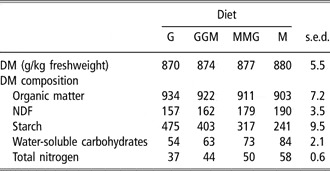
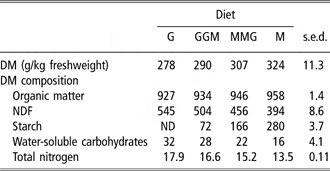
Mean chemical composition of the four concentrate blends and forage mixtures is shown in Tables 2 and 3, respectively, and are based on the mean of four samples of each concentrate blend and forage mixture. The DM contents of the grass and maize silages were 278 and 324 g/kg freshweight, respectively, resulting in an increase in the DM of forage mixtures as maize silage replaced grass silage. Similarly, the OM of maize silage was higher than that of grass silage (P < 0.001), resulting in an increase in the OM content of forage mixtures as maize silage replaced grass silage. The NDF content of grass silage was higher than that of maize silage (P < 0.001), which contained more non-structural carbohydrates, in the form of starch (P < 0.001). Predictably, as the level of maize silage inclusion increased there was a commensurate reduction in overall fibre content of forage mixtures with a concurrent increase in starch content. The N content of forage mixtures declined as maize silage replaced grass silage, reflecting the higher N content of grass silage when compared with maize silage.
Chemical composition of the forage mixture concentrates (g/kg corrected dry matter (DM), unless otherwise stated)

G = 1000 g/kg grass; GGM = grass 670 g/kg, maize 330 g/kg; MMG = maize 670 g/kg, grass 330 g/kg; M = 1000 g/kg maize.
Chemical composition of forage mixtures containing both grass and maize silages (g/kg corrected dry matter (DM), unless otherwise stated)

ND = not determined.
G = 1000 g/kg grass; GGM = grass 670 g/kg, maize 330 g/kg; MMG = maize 670 g/kg, grass 330 g/kg; M = 1000 g/kg maize.
Total fermentation acid of the forage mixtures was positively related to the amount of grass silage within the forage mixture. Both maize and grass silages were well fermented with ammonia N levels below 100 g/kg total N, although ammonia N was higher (P < 0.001) in grass silage when compared with maize silage.
Estimation of nutrient flow to the small intestine
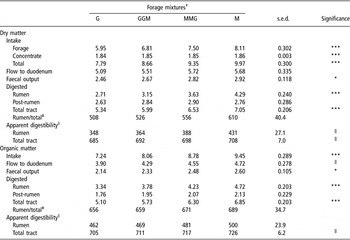
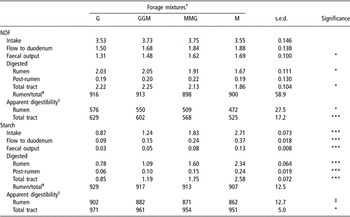
Nutrient flow at the duodenum was calculated according to the dual marker method proposed by Faichney (Reference Faichney1975). Replacing grass silage with maize silage increased the total DM intake as a consequence of increasing forage DM intake (Table 4). Flow of DM to the duodenum was not significantly different between diets, but tended to be lowest for cattle fed diet G. Rumen digestibility tended to increase with maize silage inclusion in the diet but these differences were not significant (P = 0.088). The quantity of DM digested in the rumen increased as more maize silage was fed, causing the amount of DM digested in the total tract to increase by approximately 1.5 kg when maize silage completely replaced grass silage in the diet. Amounts digested post-ruminally were comparable between diets and therefore the additional DM consumed by cattle fed diets containing maize silage was primarily in the rumen. OM intake and digestion followed a similar pattern to DM.
Digestion of dry matter and organic matter within the digestive tract of steers given diets based on forage mixtures of grass and maize silage

†Forage mixture descriptions in Table 3.
‡Rumen digestion as a proportion of total digestion (g/kg).
§g/kg intake.
||Approaching significance (P < 0.1).
Intake of NDF (Table 5) was comparable for all diets but faecal output increased as the proportion of maize silage in the diet increased, resulting in less maize silage NDF being digested in the whole tract when compared with diets containing predominantly grass silage. Duodenal flow of NDF also tended to increase as more maize silage was fed, causing significantly less fibre to be digested in the rumen of cattle fed maize silage as opposed to grass silage (P = 0.047). Amounts of fibre digested post-ruminally were small and almost identical for all four diets.
Digestion of NDF and starch within the digestive tract of steers given diets based on forage mixtures of grass and maize silage

†Forage mixture descriptions in Table 3.
‡Rumen digestion as a proportion of total digestion (g/kg).
§g/kg intake.
||Approaching significance (P < 0.1).
Total starch intake increased from 0.87 to 2.71 kg/day when maize silage completely replaced grass silage in the diet (P = 0.001). Consumed starch in diet G was derived mainly from wheat grain in the concentrates, while forage starch accounted for 40%, 68% and 84% of the total starch intake in diets GGM, MMG and M, respectively. Starch flow to the duodenum increased as more maize silage was included in the diet (P = 0.001) and this was accompanied by a slight decline in rumen digestibility (P = 0.086). Despite greater post-ruminal starch flows in maize silage-rich diets compared with grass silage-based diets, the amount of starch digested in the rumen increased at each increment of maize silage inclusion. However, faecal starch output increased from 30 g/day in diet G to 130 g/day in diet M, resulting in a reduction in total tract starch digestibility.
Rumen fermentation
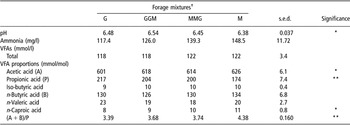
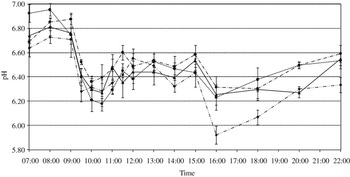
Mean rumen pH (Table 6) of cattle offered diets G and GGM were significantly higher than those offered diets containing maize silage as the only forage (P < 0.05). Figure 1 shows the diurnal changes in rumen pH. All cattle had rumen pH above 6.6 before the first feed with those offered grass silage as the sole forage (G) tended to have the highest pH values. Immediately following the morning feed, pH values fell rapidly in all diets, although at this time there were no significant differences in pH values between dietary treatments. Following the second feed, rumen pH values were seen to decline markedly in those animals where maize silage was the sole forage, reaching a minimum value of 5.92, whereas there was no appreciable change in rumen pH or significant differences between the other three diets.
pH, concentrations of ammonia and volatile fatty acids (VFAs) and molar proportions of individual VFAs in the rumen of steers given diets based on forage mixtures of grass and maize silage

†Forage mixture descriptions in Table 3.
Rumen pH of beef steers given diets based on forage mixtures of grass and maize silage (○ = G, ● = GGM, ▴ = MMG, ◊ = M).

Although there were no significant effects of diet on rumen ammonia concentrations or the total concentration of VFAs, the molar proportions of acetic acid were greater (P < 0.05) in those diets containing larger proportions of maize silage whereas molar proportions of propionic acid were greatest (P = 0.006) in those diets containing larger proportions of grass silage. Consequently, the ratio of non-glucogenic to glucogenic precursors was greatest (P < 0.005) in those diets containing greater quantities of maize silage.
Plasma hormone concentrations
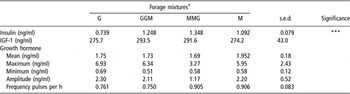
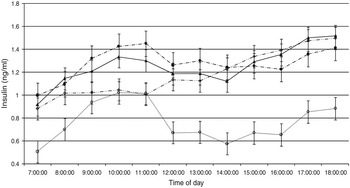
Mean circulating concentrations of insulin were similar between diets MMG and GGM but both were higher than the levels observed in diets G (P < 0.001) and M (P < 0.10), although diet M had a greater mean concentration than diet G (P < 0.001) (Table 7). Examination of insulin profiles (Figure 2) show that diets containing grass silage, namely G, GGM and MMG, appear to exhibit biphasic patterns whereby insulin concentrations rose appreciably following the morning feed and then declined marginally followed by another increase in insulin concentration, which coincided with the feeding of the afternoon concentrates, although this second post-prandial rise was less well defined in diet G. The profile of diet M indicated a progressive increase in insulin concentrations throughout the day, lacking the two distinct phases apparent in the other three diets.
Mean circulating concentrations of insulin, IGF-1 and growth hormone profile characteristics of steers given diets based on forage mixtures of grass and maize silage

Mean insulin profiles of steers given diets based on forage mixtures of grass and maize silage (○ = G, ● = GGM, ▴ = MMG, ◊ = M).

There were no significant differences between dietary treatments in the mean circulating concentrations of IGF-1 or GH, or in the frequency, amplitude or duration of GH hormone pulses (Table 7).
Discussion
Despite inclusion of maize silage causing an increase in the flow of OM out of the rumen, the amount within the rumen also increased, due to the simultaneous increase in intake. The amount of OM apparently digested in the rumen increased by approximately 1.5 kg when grass silage was totally replaced by maize silage. This could be accounted for by a similar increase in the quantity of ruminally digested starch between diets G and M, suggesting that the majority of maize starch was digested in the rumen. The values recorded here are similar to those reported for beef cattle (Juniper et al., 2006) and cows (Sutton et al., Reference Sutton, Cammell, Phipps, Beever and Humphries2000) offered maize silage of differing maturities and those of cows fed maize silage-based diets (Kung et al., Reference Kung, Tung and Carmean1992).
Starch apparently accounted for 8% of OM flowing out of the rumen in diet M compared with 2% in diet G. The greater flow of starch to the duodenum of cattle fed maize silage as opposed to grass silage is likely to be related to the type of starch in the diets. Starch digestion in the rumen varies markedly among feeds (Cone et al., Reference Cone, ClineThiel, Malestein and van’t Klooster1989). Maize starch is less degradable in the rumen than barley or wheat starch (Theurer, Reference Theurer1986), which has consequences not only for starch digestion but also for fibre digestion in the rumen, which tends to decrease with the addition of rapidly degradable starch (DePeters and Taylor, Reference DePeters and Taylor1985). However, Mertens and Loften (Reference Mertens and Loften1980) reported that both maize and wheat starch depressed fibre digestion to a similar extent. Rumen starch fermentation is not always negatively associated with lower fibre digestion if the pH is maintained at an adequate level to support rumen cellulolytic bacteria (Robinson et al., Reference Robinson, Tamminga and van Vuuren1987), this threshold averaging around pH 6.0 (Mould et al., Reference Mould, Orskov and Mann1983). Only cattle fed diet M had pH values below this, which occurred immediately after the afternoon concentrate feed and may have been maintained for up to 3 h. Since the lag time before initiation of NDF degradation has been shown to be longer for maize silage than for grass silage (Deaville and Givens, Reference Deaville and Givens1995), low rumen pH levels may have coincided with the main phase of fibre digestion in the rumen of maize silage-fed cattle with negative consequences. Indeed, maize silage NDF was significantly less digestible in the rumen, and consequently the total tract, than grass silage NDF. However, it is not possible to distinguish between the effect of forage, starch intake or level of intake on the depression in fibre digestibility within this study.
Despite considerably more OM being digested in the rumen with maize silage-based diets, mean total VFA concentrations in the rumen post-feeding were not affected by forage source. However, a notable exception to this lack of difference was prior to the morning feed when all diets containing maize silage had higher VFA concentrations than diet G (P = 0.011) and those containing grass silage had lower concentrations than diet M (P = 0.052).
Unlike total VFA concentration, there was a significant increase in the molar proportions of acetic acid and a reduction in the proportion of propionic acid when maize silage replaced grass silage in the diet. The relative proportions of acetate and propionate in the rumen are generally related to the ratio of forage to concentrate in the diet (Sutton, Reference Sutton1985) and to its chemical composition (Friggens et al., Reference Friggens, Oldham, Dewhurst and Horgan1998). The positive effects that maize silage inclusion had on forage intake increased the proportion of forage in the total diet from 764 g/kg in diet G to 814 g/kg in diet M (P = 0.001). This increase in forage-to-concentrate ratio may have resulted in the increasing molar proportion of acetate in the rumen of cattle where grass silage was replaced by maize silage. Furthermore, while acetic acid is the major end product of the fermentation of cell wall carbohydrates, it is also formed during the degradation of protein (Cecava, Reference Cecava1995). Total protein intake increased with ascending inclusion of maize silage in the diet, which may also account for the higher proportion of acetic acid in the rumen of maize silage-fed cattle.
It is difficult to reconcile the consistent reduction in the proportion of propionic acid with the addition of maize silage to the diet, since it accompanied increased ingestion of rumen-degradable starch, which is usually associated with an increase in the proportion of propionic acid (Overton et al., Reference Overton, Cameron, Elliot, Clark and Nelson1995). Mean circulating concentrations of insulin for diets GGM, MMG and M reflect the ratios of non-glucogenic to glucogenic precursors seen in these diets, although this is not the case for diet G. However, insulin profiles (Figure 2) indicate that there was significant diurnal variation in insulin concentrations throughout the 12-h sampling period, these fluctuations appearing to be dependent upon forage mixture.
Diets containing maize silage had similar initial, pre-feeding, insulin concentrations whereas diet G had notably lower (P < 0.01) values. The elevated initial insulin concentrations in diets containing maize silage are probably the result of increased levels of starch in these diets, although these diets seem to lack a dose response as would be expected with increasing starch content. Insulin profiles of animals receiving diets comprising forage mixtures or grass silage alone were distinctly different from those of animals fed the sole maize silage diet. Diets containing grass silage (MMG, GGM and G) showed a relatively rapid post-prandial rise in insulin concentrations in the 3 h immediately following the morning feed, followed by a notable decline over the next 4 h. Insulin concentrations in grass silage-containing diets were seen to rise once again following the afternoon concentrate feed. In contrast, profiles for those animals receiving the diet comprising entirely of maize silage showed a sustained and progressive post-prandial increase in circulating insulin concentrations. The similarity in insulin patterns between diets G, GGM and MMG implies that the insulin response may be attributable to an interaction between the grass silage component of the diet and the addition of concentrates, as (i) the pattern was not evident in the insulin profile of diet M and (ii) the two distinctive phases of increased insulin concentration seen in grass silage-containing diets coincide with the feeding of concentrates, probably indicative of synchronisation between dietary energy and N supplies.
Due to the isonitrogenous nature of the diets used in this study, lack of differences in the circulating concentrations of GH and IGF-1 by the feeding of forage mixtures was not entirely unexpected. GH is sensitive to the effects of under nutrition, where circulating concentrations and pulse amplitude increase with diminishing nutrition (Bass et al., Reference Bass, Spencer and Hodgkinson1992). Maximal IGF-1 response is dependent upon the level of dietary CP supplied in the diet (Elsasser et al., Reference Elsasser, Rumsy and Hammond1989; Brier, Reference Brier1999) provided that there is a sufficient supply of energy.
While some of the effects on rumen fermentation were unexpected, the differences seen between grass silage and maize silage digestion could be attributable either to the different intake characteristics or to the digestibility of the forages. Thus, despite having similar DM, OM and starch rumen digestibility, the greater intake of maize silage-based diets increased the amounts of these nutrients being digested. Consequently, the physical and chemical environment within the rumen is different when grass silage and maize silage are fed, contributing to differences in nutrient supply and utilisation.