1. Introduction
The stability of thin films on substrates has been for a long time a basic subject of research, not only because of the numerous technological applications, including coatings, adhesives, lubricants and dielectric layers, but also because of their fundamental interest (Eggers Reference Eggers1997; Oron, Davis & Bankoff Reference Oron, Davis and Bankoff1997; Craster & Matar Reference Craster and Matar2009). The dewetting of thin liquid films is the process of destabilization of such films which leads to the formation of drops. It is generally observed when the supported liquid film is placed on a substrate under partial wetting conditions, and subject to destabilizing intermolecular forces. For a homogeneous isotropic liquid on a uniform solid substrate, two main dewetting processes are known: (i) the nucleation of holes at defects or dust particles (Bischof et al. Reference Bischof, Scherer, Herminghaus and Leiderer1996; Xie et al. Reference Xie, Karim, Douglas, Han and Weiss1998), and (ii) the amplification of perturbations at the free surface (e.g. capillary waves) under the destabilizing effect of long-range intermolecular forces in so-called spinodal dewetting (Thiele, Mertig & Pompe Reference Thiele, Mertig and Pompe1998; Thiele, Velarde & Neuffer Reference Thiele, Velarde and Neuffer2001; Thiele Reference Thiele2003). In the latter case, thermal fluctuations induce perturbations in the film thickness, which then grow exponentially with time, leading to dewetting when the amplitude reaches the size of the film thickness. For this mechanism, the term ‘spinodal dewetting’ has been coined in analogy to the symmetry breaking mechanism involved in decomposition processes (Cahn Reference Cahn1965; Mitlin Reference Mitlin1993). Although the distinction between these two dewetting processes is well established in the literature, there is still a lot of debate about which of these mechanisms is actually observed in a given experiment (Jacobs & Herminghaus Reference Jacobs and Herminghaus1998; Seemann et al. Reference Seemann, Herminghaus, Neto, Schlagowski, Podzimek, Konrad, Mantz and Jacobs2005).
In this context, lubrication approximations to the full Navier–Stokes (N–S) equations have shown to be extremely useful for investigating the dynamics and instability of thin liquid films on substrates, including the motion and instabilities of their contact lines (Oron et al. Reference Oron, Davis and Bankoff1997; Zhang & Lister Reference Zhang and Lister1999). The theoretical treatment of the coating problem is greatly simplified if the film is so thin that the lubrication approximation can be employed. When this modelling is valid, it is possible to determine the velocity field of the liquid as a function of the film thickness, and the problem reduces to the solution of a nonlinear evolution equation for the thickness profile of the film. To leading order, at low speeds, the dynamics is controlled by a balance among capillarity, viscosity and intermolecular forces, without inertia playing a role. This approach has achieved considerable success in dealing with the solution of this class of problems (Colinet et al. Reference Colinet, Kaya, Rossomme and Scheid2007). In other contexts, such as that of sliding bearings, the effects of inertia within the lubrication approximation has also been studied (see e.g. Hori Reference Hori2006; Szeri Reference Szeri2011).
However, in some applications such as the dewetting of nano-scale thin metallic films on hydrophobic substrates (González et al. Reference González, Diez, Wu, Fowlkes, Rack and Kondic2013), the effects related to inertia and the shortcomings of the lubrication approximation assumptions (requiring small slopes and consequently small contact angles) may have an influence on the dynamics and morphology of the film. For example, the effects of inertia in the context of metallic films has recently been considered by Fowlkes et al. (Reference Fowlkes, Roberts, Wu, Diez, González, Hartnett, Mahady, Afkhami, Kondic and Rack2014) when analysing instability development and the formation of satellite droplets. One of the goals of this paper is to shed some light on the possible differences expected between existing theories and experiments, which could eventually be attributed to inertial effects, among others. Thus, we aim to give a quantitative answer to this issue by considering in detail how measured parameters, such as the characteristic distance of the drop pattern (i.e. average separation between drops) and characteristic times (i.e. growth rates), are modified by the natural inertia of the flow (usually neglected).
Experimental studies of unstable thin films coating solids have shown significant differences in the patterns that develop when fluid instabilities lead to the formation of growing ‘dry regions’ on the solid. The effects of inertia on the instability have been studied previously in other problems, for example for a film flowing down an incline (Lopez, Miksis & Bankoff Reference Lopez, Miksis and Bankoff1997), the breakup of a liquid filament sitting on a substrate (Ubal et al. Reference Ubal, Grassia, Campana, Giavedoni and Saita2014) and several other configurations (Hocking & Davis Reference Hocking and Davis2002). However, these problems do not include explicitly the effects of the intermolecular interactions between the molecules of the liquid and those of the solid. Here, we consider these by using integrated Lennard-Jones forces, which lead to the disjoining pressure that entails the power dependence on the fluid thickness (Kargupta, Sharma & Khanna Reference Kargupta, Sharma and Khanna2004). In the present context, the occurrence and nature of both inertia and bidimensional effects in the liquid film on the solid substrate is of interest, not only for fundamental research, but also for technological applications.
The solutions of problems under the lubrication approximation is usually limited to speeds low enough to give small capillary and Reynolds numbers. The extension of the theory to higher speeds introduces inertia into the problem, and, even in the case of thin films, the analysis may become much more difficult. The great simplification previously found by the application of the lubrication theory no longer exists; instead, the system is governed by the coupling of a nonlinear partial differential equation for the velocity field, and an evolution equation for the thickness profile. It is possible, however, to find a class of problems in which inertial effects can be assessed within the long-wave framework. In this work we are concerned with the instability of a flat liquid film extended over a solid plane, and subject to intermolecular forces between the liquid and the solid substrate. Then, the film evolution is studied by considering viscous, surface tension and intermolecular forces, with special emphasis on the effects of inertia in the development of the instability.
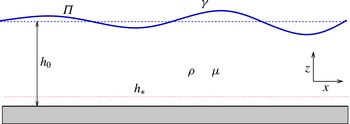
Schematic diagram of the problem.

2. Intermolecular forces in the hydrodynamic description
We consider a thin liquid film of thickness
 $h_{0}$
, which spans infinitely in the
 $x$
-direction (the system is invariant in the
 $y$
-direction, i.e. plane flow conditions prevail), and rests on a solid plane at
 $z=0$
(see figure 1). Here, we will consider the instability of this initially flat film under the action of surface tension and intermolecular forces, both acting at the free surface of the film of instantaneous thickness
 $h(x,t)$
. Thus, the hydrodynamic evolution is governed by the N–S equations and the incompressibility condition,
 $$\begin{eqnarray}\displaystyle {\it\rho}(\partial _{t}\boldsymbol{v}+\boldsymbol{v}\boldsymbol{\cdot }\boldsymbol{{\rm\nabla}}\boldsymbol{v})=-\boldsymbol{{\rm\nabla}}p+{\it\mu}{\rm\Delta}\boldsymbol{v},\quad \boldsymbol{{\rm\nabla}}\boldsymbol{\cdot }\boldsymbol{v}=0, & & \displaystyle\end{eqnarray}$$
where
 ${\it\rho}$
is the liquid density,
 ${\it\mu}$
its viscosity,
 $p$
the pressure and
 $\boldsymbol{v}=(u,w)$
the velocity field. At the substrate (
 $z=0$
), we apply the no slip and non-penetration conditions. At the free surface,
 $z=h(x,t)$
, we have the usual kinematic condition and normal stress equilibrium given by
 $$\begin{eqnarray}\displaystyle p=-{\it\Pi}-{\it\gamma}\mathscr{C}, & & \displaystyle\end{eqnarray}$$
where
 ${\it\gamma}$
is the surface tension,
 $\mathscr{C}$
the curvature of the surface and
 $$\begin{eqnarray}\displaystyle {\it\Pi}(h)={\it\kappa}f(h)={\it\kappa}\left[\left(\frac{h_{\ast }}{h}\right)^{n}-\left(\frac{h_{\ast }}{h}\right)^{m}\right], & & \displaystyle\end{eqnarray}$$
is the disjoining pressure. Here,
 ${\it\kappa}$
is a constant with units of pressure (related to the Hamaker constant of the system), the exponents satisfy
 $n>m>0$
and
 $h_{\ast }$
is the equilibrium thickness (of the order of nanometres). This surface force is a consequence of the interaction among the molecules in the three phases present in the problem, namely the liquid of the film, the solid substrate and the surrounding gas. Note that at equilibrium, i.e. when
 $h=h_{0}=\text{const}.$
, the film has a uniform pressure
 $p_{0}=-{\it\Pi}(h_{0})>0$
, since
 ${\it\Pi}(h_{0})<0$
for
 $h_{0}>h_{\ast }$
.
Typically, the effects of this driving force is studied within a simplified version of the N–S equations, namely the long-wave approximation with inertial terms neglected. Here, we describe the instability under this approach, but including also inertial effects (§ 3). Since this approximation requires very small values of the ratio,
 ${\it\varepsilon}=h_{0}/\ell$
, where
 $\ell$
is a typical wavelength of the instability (see below), we consider the complete N–S equations in linear form, i.e. without the convective term (§ 4). Both models are compared in § 5. We also solve numerically the nonlinear version of the N–S equations and compare the results with the linear solution valid for small surface perturbations (§ 6). The values of
 $h_{0}$
of typical experiments that lead to noticeable inertial effects as well as those related with
 ${\it\varepsilon}$
are discussed in § 7, together with theoretical and numerical predictions.
3. Long-wave approximation
In this approximation it is assumed that the film thickness,
 $h_{0}$
, is much smaller than the characteristic horizontal length of the problem. Since the film extends to infinity, we assume that there exists a typical length associated with the wavelength of the perturbations, namely
 $\ell$
. The definition of
 $\ell$
will be made more precise below. Subsequently, for
 ${\it\varepsilon}=h_{0}/\ell \ll 1$
, we can simplify (2.1) under the long-wave approximation assumptions retaining inertial terms in the form
 $$\begin{eqnarray}\displaystyle & \displaystyle -\frac{\partial p}{\partial x}+{\it\mu}\frac{\partial ^{2}u}{\partial z^{2}}={\it\rho}\left(\frac{\partial u}{\partial t}+u\frac{\partial u}{\partial x}+w\frac{\partial u}{\partial z}\right) & \displaystyle\end{eqnarray}$$
 $$\begin{eqnarray}\displaystyle & \displaystyle -\frac{\partial p}{\partial z}=0 & \displaystyle\end{eqnarray}$$
 $$\begin{eqnarray}\displaystyle & \displaystyle \frac{\partial u}{\partial x}+\frac{\partial w}{\partial z}=0. & \displaystyle\end{eqnarray}$$
The boundary conditions for these equations are as follows. At
 $z=0$
, we impose no penetration and no slip at the substrate,
 $$\begin{eqnarray}\displaystyle w=0,\quad u=0. & & \displaystyle\end{eqnarray}$$
At the liquid–gas interface (
 $z=h$
), we have zero shear stress,
 $$\begin{eqnarray}\displaystyle \frac{\partial u}{\partial z}=0,\quad & & \displaystyle\end{eqnarray}$$
as well as the kinematic condition,
 $$\begin{eqnarray}\displaystyle \frac{\partial h}{\partial t}+u\frac{\partial h}{\partial x}=w, & & \displaystyle\end{eqnarray}$$
and the Laplace relation for the capillary pressure
 $$\begin{eqnarray}\displaystyle p(h)=-{\it\gamma}\frac{\partial ^{2}h}{\partial x^{2}}-{\it\kappa}f(h). & & \displaystyle\end{eqnarray}$$
From (3.2) we see that the pressure,
 $p$
, is
 $z$
-independent, and then
 $p$
is only a function of
 $h$
,
 $p=p(h)$
. Thus, we have that the
 $x$
-derivative of
 $p$
in (3.1) is given by
 $$\begin{eqnarray}\displaystyle \frac{\partial p}{\partial x}=-{\it\gamma}\frac{\partial ^{3}h}{\partial x^{3}}-{\it\kappa}f^{\prime }(h)\frac{\partial h}{\partial x}. & & \displaystyle\end{eqnarray}$$
The continuity equation, (3.3), is conveniently satisfied by introducing the stream function
 ${\it\psi}(x,z,t)$
defined by
 $$\begin{eqnarray}\displaystyle u=\frac{\partial {\it\psi}}{\partial z},\quad w=-\frac{\partial {\it\psi}}{\partial x}. & & \displaystyle\end{eqnarray}$$
Therefore, (3.1) and (3.6) in terms of
 ${\it\psi}$
are given by
 $$\begin{eqnarray}\displaystyle & \displaystyle {\it\mu}\frac{\partial ^{3}{\it\psi}}{\partial z^{3}}=-{\it\gamma}\frac{\partial ^{3}h}{\partial x^{3}}-{\it\kappa}f^{\prime }(h)\frac{\partial h}{\partial x}+{\it\rho}\left(\frac{\partial ^{2}{\it\psi}}{\partial z\partial t}+\frac{\partial {\it\psi}}{\partial z}\frac{\partial ^{2}{\it\psi}}{\partial x\partial z}-\frac{\partial {\it\psi}}{\partial x}\frac{\partial ^{2}{\it\psi}}{\partial z^{2}}\right), & \displaystyle\end{eqnarray}$$
 $$\begin{eqnarray}\displaystyle & \displaystyle \frac{\partial h}{\partial t}+\frac{\partial {\it\psi}(x,h,t)}{\partial x}=0. & \displaystyle\end{eqnarray}$$
The boundary conditions, given by (3.4a,b
) and (3.5), in terms of
 ${\it\psi}$
are:
 $$\begin{eqnarray}\displaystyle \left.{\it\psi}\right|_{z=0}=0,\quad \left.\frac{\partial {\it\psi}}{\partial z}\right|_{z=0}=0,\quad \left.\frac{\partial ^{2}{\it\psi}}{\partial z^{2}}\right|_{z=h}=0. & & \displaystyle\end{eqnarray}$$
3.1. Linear stability analysis (LSA) within long-wave approximation
The equilibrium state is given by
 $h=h_{0}$
, and for small-amplitude perturbations, the height and stream function can be written in the form
 $$\begin{eqnarray}\displaystyle h=h_{0}\left(1+A\,\text{e}^{{\it\omega}t+\text{i}kx}\right),\quad {\it\psi}=A{\it\psi}_{1}(z)\,\text{e}^{{\it\omega}t+\text{i}kx}, & & \displaystyle\end{eqnarray}$$
where
 $A$
is the small amplitude of the perturbation, and unstable (stable) modes correspond to
 ${\it\omega}>0$
(
 ${\it\omega}<0$
). By replacing (3.13a,b
) into (3.10) and (3.11), and retaining terms up to order one in
 ${\it\varepsilon}$
, we have
 $$\begin{eqnarray}\displaystyle & \displaystyle {\it\mu}\frac{\text{d}^{3}{\it\psi}_{1}}{\text{d}z^{3}}=\text{i}{\it\gamma}h_{0}k^{3}-\text{i}{\it\kappa}h_{0}f^{\prime }(h_{0})k+{\it\rho}\,{\it\omega}\frac{\text{d}{\it\psi}_{1}}{\text{d}z}, & \displaystyle\end{eqnarray}$$
 $$\begin{eqnarray}\displaystyle & \displaystyle {\it\omega}h_{0}+\text{i}k{\it\psi}_{1}(h_{0})=0, & \displaystyle\end{eqnarray}$$
with the boundary conditions
 $$\begin{eqnarray}\displaystyle \left.{\it\psi}_{1}\right|_{z=0}=0,\quad \left.\frac{\text{d}{\it\psi}_{1}}{\text{d}z}\right|_{z=0}=0,\quad \left.\frac{\text{d}^{2}{\it\psi}_{1}}{\text{d}z^{2}}\right|_{z=1}=0. & & \displaystyle\end{eqnarray}$$
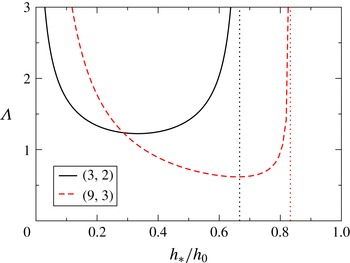
Parameter
 ${\it\Lambda}$
as given by (3.21) as a function of the ratio between the equilibrium thickness,
 $h_{\ast }$
, and the film thickness,
 $h_{0}$
, for two pairs of the exponents
 $(n,m)$
. The vertical dotted lines correspond to
 $g_{0}=0$
, i.e.
 $h_{\ast }=h_{0}\,(m/n)^{1/(n-m)}$
.

Now, we define the horizontal length scale,
 $\ell$
, by choosing
 ${\it\kappa}f^{\prime }(h_{0})={\it\gamma}/\ell ^{2}$
, so that it turns out
 $$\begin{eqnarray}\displaystyle \ell =\sqrt{\frac{{\it\gamma}}{{\it\kappa}f^{\prime }(h_{0})}}=\sqrt{\frac{{\it\gamma}h_{0}}{{\it\kappa}g_{0}}}, & & \displaystyle\end{eqnarray}$$
where
 $$\begin{eqnarray}\displaystyle g_{0}=h_{0}f^{\prime }(h_{0})=-n\left(\frac{h_{\ast }}{h_{0}}\right)^{n}+m\left(\frac{h_{\ast }}{h_{0}}\right)^{m}. & & \displaystyle\end{eqnarray}$$
Since
 $n>m$
and
 $h_{0}>h_{\ast }$
, we have
 $g_{0}>0$
. Note that we are here including in
 $\ell$
all the effects related with the magnitude of the intermolecular forces given by
 ${\it\kappa}$
. In fact, this constant is usually related in the literature with the contact angle,
 ${\it\theta}$
, which appears at the contact regions formed when the film thins up to
 $h_{\ast }$
, and characterizes the partial wetting of the substrate. It is found that the following simple relationship holds (Oron et al.
Reference Oron, Davis and Bankoff1997; Schwartz & Eley Reference Schwartz and Eley1998; Diez & Kondic Reference Diez and Kondic2007)
 $$\begin{eqnarray}\displaystyle {\it\kappa}=\frac{{\it\gamma}(1-\cos {\it\theta})}{Mh_{\ast }}, & & \displaystyle\end{eqnarray}$$
where
 $M=(n-m)/((n-1)(m-1))$
. Thus, the characteristic length scale becomes
 $$\begin{eqnarray}\displaystyle \ell =\sqrt{\frac{Mh_{0}h_{\ast }}{(1-\cos {\it\theta})g_{0}}}, & & \displaystyle\end{eqnarray}$$
so that this length includes all the parameters determining the problem, except for
 ${\it\gamma}$
and
 ${\it\mu}$
which yield the time scale (see (3.23) below). In figure 2, we show how the dimensionless combination
 $$\begin{eqnarray}\displaystyle {\it\Lambda}=\sqrt{1-\cos {\it\theta}}\frac{\ell }{h_{0}}=\sqrt{\frac{Mh_{\ast }}{g_{0}h_{0}}} & & \displaystyle\end{eqnarray}$$
depends on the ratio
 $h_{\ast }/h_{0}$
for two fixed values of the exponent pair
 $(n,m)$
. Interestingly, very small values of
 $h_{\ast }$
as well as
 $h_{\ast }$
close to
 $h_{0}\,(m/n)^{1/(n-m)}$
yield very large values of
 $\ell /h_{0}$
for given contact angle,
 ${\it\theta}<{\rm\pi}/2$
. This illustrates that, for a given film thickness, the combined length
 ${\it\Lambda}$
(which includes both the characteristic length used here,
 $\ell$
, and the contact angle,
 ${\it\theta}$
) can be much larger than
 $h_{0}$
if
 $h_{\ast }$
is much less than or too close to
 $h_{0}$
. In other words, the length
 $\ell$
(as well as the ratio
 ${\it\varepsilon}$
) can vary over a very wide range for given
 $h_{0}$
,
 $h_{\ast }$
and
 ${\it\theta}$
.
Consequently, a convenient non-dimensional version of the problem for the long-wave approximation is given by the following scaling
 $$\begin{eqnarray}\displaystyle X=\frac{x}{\ell },\quad Z=\frac{z}{h_{0}},\quad H=\frac{h}{h_{0}},\quad T=\frac{{\it\varepsilon}^{3}}{{\it\tau}}t,\quad {\it\Psi}_{1}=\frac{{\it\tau}}{{\it\varepsilon}^{3}\ell h_{0}}{\it\psi}_{1},\quad K=\ell k,\quad {\it\Omega}=\frac{{\it\tau}}{{\it\varepsilon}^{3}}{\it\omega}, & & \displaystyle \nonumber\\ \displaystyle & & \displaystyle\end{eqnarray}$$
where
 $$\begin{eqnarray}\displaystyle {\it\tau}=\frac{{\it\mu}\ell }{{\it\gamma}} & & \displaystyle\end{eqnarray}$$
is the time scale. Under these definitions, (3.14) and (3.15) become
 $$\begin{eqnarray}\displaystyle & \displaystyle \frac{\text{d}^{3}{\it\Psi}_{1}}{\text{d}Z^{3}}+q^{2}\frac{\text{d}{\it\Psi}_{1}}{\text{d}Z}=\text{i}K(K^{2}-1), & \displaystyle\end{eqnarray}$$
 $$\begin{eqnarray}\displaystyle & \displaystyle {\it\Omega}+\text{i}K{\it\Psi}_{1}(1)=0, & \displaystyle\end{eqnarray}$$
 $$\begin{eqnarray}\displaystyle q^{2}=-La^{\ast }\,{\it\Omega}, & & \displaystyle\end{eqnarray}$$
with
 $$\begin{eqnarray}\displaystyle La^{\ast }=La\,{\it\varepsilon}^{5}, & & \displaystyle\end{eqnarray}$$
and
 $$\begin{eqnarray}\displaystyle La=\frac{{\it\rho}{\it\gamma}\ell }{{\it\mu}^{2}} & & \displaystyle\end{eqnarray}$$
being the Laplace number. The latter dimensionless number considers the effects of all the forces playing a role in the flow, namely, inertial (characterized by
 ${\it\rho}$
), viscous (characterized by
 ${\it\mu}$
), surface (characterized by
 ${\it\gamma}$
) and intermolecular forces (characterized by
 $\ell$
). Note that
 $La$
is actually the physical dimensionless number that accounts for the inertial effects in the problem, while
 $La^{\ast }$
combines both effects studied here, namely, the inertial ones (only included in
 $La$
) and the bidimensionality specified solely by
 ${\it\varepsilon}$
.
In general, the ratio of inertial to viscous effects scales as
 ${\it\rho}UL/{\it\mu}$
, where
 $L$
and
 $U$
are the characteristic length and velocity scales, respectively. If the only characteristic length scale of the problem is
 $L=\ell$
, the velocity field is driven by capillary pressure gradients, which leads to the scaling
 $U\sim {\it\gamma}/{\it\mu}$
and the relative importance of inertia is given by
 $La={\it\rho}{\it\gamma}\ell /{\it\mu}^{2}$
. Instead, if the aspect ratio of the film is small, the lubrication scaling analysis requires
 $L=h_{0}^{2}/\ell$
. Then, the relative importance of inertial terms to viscous ones is given by
 ${\it\rho}Uh_{0}^{2}/({\it\mu}\ell )$
, see (3.1). The velocity scaling is now given by the balance
 $U\sim Ph_{0}^{2}/(\ell {\it\mu})$
, with
 $P\sim {\it\gamma}h_{0}/\ell ^{2}$
. As a consequence, the appropriate parameter to represent inertial effects is
 ${\it\rho}{\it\gamma}h_{0}^{5}/{\it\mu}^{2}\ell ^{4}$
, which we denote by
 $La^{\ast }$
.
The solution of (3.24) has the form
 $$\begin{eqnarray}\displaystyle {\it\Psi}_{1}=\text{i}K(K^{2}-1)\frac{qZ+\sin (q-qZ)\sec Z-\tan q}{q^{3}}, & & \displaystyle\end{eqnarray}$$
which allows one to obtain the dispersion relation from (3.25) as
 $$\begin{eqnarray}\displaystyle \frac{{\it\Omega}}{K^{2}(K^{2}-1)}=\frac{q-\tan q}{q^{3}}. & & \displaystyle\end{eqnarray}$$
In the limit
 $q\rightarrow 0$
, this expression tends to the purely viscous solution,
 $$\begin{eqnarray}\displaystyle {\it\Omega}_{vis}=\frac{K^{2}(1-K^{2})}{3}, & & \displaystyle\end{eqnarray}$$
which is obtained in the inertialess case (Diez & Kondic Reference Diez and Kondic2007) for
 $La=0$
. Note that the dimensionless critical (marginal) wavenumber is equal to unity for the viscous case, i.e.
 $K_{c}=1$
, so that (3.31) shows instability for
 $K<1$
. This is because the choice of the in-plane characteristic length,
 $\ell$
, the inverse of the dimensional critical wavenumber (Nguyen et al.
Reference Nguyen, Fuentes-Cabrera, Fowlkes, Diez, González, Kondic and Rack2012).
By dividing (3.30) by
 $q^{2}$
and using (3.26), we may define the parameter
 $r$
as
 $$\begin{eqnarray}\displaystyle r\equiv \frac{1}{La^{\ast }\,K^{2}(K^{2}-1)}, & & \displaystyle\end{eqnarray}$$
and then, the possible values of
 $q$
for given
 $K$
, are given by the roots of
 $$\begin{eqnarray}\displaystyle r=\frac{\tan q-q}{q^{5}}. & & \displaystyle\end{eqnarray}$$
In what follows, we will consider only real values of
 $K$
. Thus, the allowed values of
 $r$
are
 $r<r_{max}=-4/La^{\ast }$
for
 $K<1$
, and
 $r>0$
for
 $K>1$
(see (3.32) and figure 3
a). In the region
 $K<1$
and
 $r<r_{max}$
there exist two different values of
 $K$
for a given
 $r$
, and so they share the same growth rate,
 ${\it\Omega}$
. At
 $r=r_{max}$
we have
 $K=K_{m}^{1D}=1/\sqrt{2}$
. Instead, in the region
 $K>1$
and
 $r>0$
, each mode
 $K$
has a unique and different
 $r$
, and consequently,
 ${\it\Omega}$
.
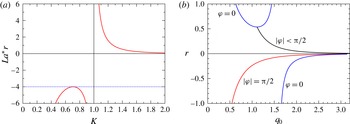
(a) Relationship between
 $La^{\ast }r$
and
 $K$
as given by (3.32). The dashed line is
 $r_{max}=-4/La^{\ast }$
. (b) Possible values of
 $r$
as a function of
 $q_{0}$
. The blue lines correspond to
 ${\it\varphi}=0$
, the red one to
 ${\it\varphi}={\rm\pi}/2$
and the black one to
 ${\it\varphi}\neq$
const. (see figure 4
a).

In order to analyse the possible values of
 ${\it\Omega}$
in each region, it is convenient to introduce the notation
 $$\begin{eqnarray}\displaystyle q=q_{0}\,\text{e}^{\text{i}{\it\varphi}}, & & \displaystyle\end{eqnarray}$$
so that the complex growth rate is
 $$\begin{eqnarray}\displaystyle {\it\Omega}={\it\Omega}_{r}+\text{i}{\it\Omega}_{i}=-\frac{q_{0}^{2}}{La^{\ast }}\,\text{e}^{2\text{i}{\it\varphi}}. & & \displaystyle\end{eqnarray}$$
For
 ${\it\Omega}_{r}=\text{Re}({\it\Omega})>0$
(
 ${<}0$
) we have unstable (stable) modes, and for
 ${\it\Omega}_{i}=\text{Im}({\it\Omega})\neq 0$
we have spatially oscillating modes. Therefore, we consider the imaginary and real parts of (3.33), which read as
 $$\begin{eqnarray}\displaystyle & \displaystyle \text{Re}(r)=F(q_{0},{\it\varphi})=[-{\it\Phi}\cos 4{\it\varphi}+\sin (2q_{0}\cos {\it\varphi})\cos 5{\it\varphi}+\sinh (2q_{0}\sin {\it\varphi})\sin 5{\it\varphi}]/{\it\Delta}, & \displaystyle \nonumber\\ \displaystyle & & \displaystyle\end{eqnarray}$$
 $$\begin{eqnarray}\displaystyle & \displaystyle \text{Im}(r)=G(q_{0},{\it\varphi})=[{\it\Phi}\sin 4{\it\varphi}-\sin (2q_{0}\cos {\it\varphi})\sin 5{\it\varphi}+\sinh (2q_{0}\sin {\it\varphi})\cos 5{\it\varphi}]/{\it\Delta}, & \displaystyle \nonumber\\ \displaystyle & & \displaystyle\end{eqnarray}$$
where
 $$\begin{eqnarray}\displaystyle & \displaystyle {\it\Phi}=2q_{0}\cos (q_{0}\,\text{e}^{-\text{i}{\it\varphi}})\cos (q_{0}\,\text{e}^{\text{i}{\it\varphi}}), & \displaystyle\end{eqnarray}$$
 $$\begin{eqnarray}\displaystyle & \displaystyle {\it\Delta}=q_{0}^{5}(\cos [2q_{0}\cos {\it\varphi}]+\cosh [2q_{0}\sin {\it\varphi}]). & \displaystyle\end{eqnarray}$$
Since
 $r$
is real, the solutions of (3.33) must have
 $\text{Im}(r)=0$
. Two trivial roots of this function are
 ${\it\varphi}=0$
and
 $|{\it\varphi}|={\rm\pi}/2$
. However, it is possible to find roots also along a curve in the
 $(q_{0},{\it\varphi})$
plane given implicitly by the function
 $G(q_{0},{\it\varphi})=0$
(see figure 4
a).
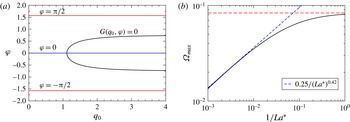
(a) Curves in the
 $(q_{0},{\it\varphi})$
plane along which
 $\text{Im}(r)=0$
.(b) Maximum growth rate as a function of
 $La^{\ast -1}$
. The horizontal dashed line corresponds to
 ${\it\Omega}_{vis,max}=1/12$
.

For
 $|{\it\varphi}|={\rm\pi}/2$
we find unstable real modes with growth rates given by (see (3.35))
 $$\begin{eqnarray}\displaystyle {\it\Omega}={\it\Omega}_{r}=\frac{q_{0}^{2}}{La^{\ast }}>0, & & \displaystyle\end{eqnarray}$$
where
 $q_{0}$
is now given by the implicit relation
 $$\begin{eqnarray}\displaystyle r(\pm \text{i}q_{0})=F(\pm \text{i}q_{0},\pm {\rm\pi}/2)=\frac{\tanh q_{0}-q_{0}}{q_{0}^{5}}. & & \displaystyle\end{eqnarray}$$
The function
 $r(\pm \text{i}q_{0})$
is plotted in figure 3(b). Since
 $r<0$
for all
 $q_{0}$
, this branch corresponds to
 $K<1$
.
Instead, for
 ${\it\varphi}=0$
, we obtain stable real modes whose growth rates are given by (see (3.35))
 $$\begin{eqnarray}\displaystyle {\it\Omega}={\it\Omega}_{r}=-\frac{q_{0}^{2}}{La^{\ast }}<0, & & \displaystyle\end{eqnarray}$$
where
 $q_{0}$
is obtained through the implicit relation
 $$\begin{eqnarray}\displaystyle r(q_{0})=F(q_{0},0)=\frac{\tan q_{0}-q_{0}}{q_{0}^{5}}. & & \displaystyle\end{eqnarray}$$
The function
 $r(q_{0})$
is plotted with blue lines in figure 3(b). Since
 $r$
changes sign at
 $q_{0}={\rm\pi}/2$
, the upper branch corresponds to
 $K>1$
, while the lower one to
 $K<1$
. Moreover, these branches are related to monotonically damped modes.
The implicit relation
 $G(q_{0},{\it\varphi})=0$
(plotted as the black curve in figure 4
a) allows us to obtain
 $r(q_{0}\,\text{e}^{\text{i}{\it\varphi}})$
as a function of
 $q_{0}$
(see black curve in figure 3
b). This branch appears as a bifurcation point of the the upper branch
 ${\it\varphi}=0$
, with coordinates
 $B=(r_{b},q_{0,b})=(1.1127,0.5367)$
. Since
 $|{\it\varphi}|\neq 0,\pm {\rm\pi}/2$
we have complex values of the growth rate,
 ${\it\Omega}$
, as determined by (3.35). Moreover, since
 $|{\it\varphi}|<{\rm\pi}/2$
,
 ${\it\Omega}_{r}$
is always negative and it corresponds to oscillating stable (damped) modes. It transpires that
 $r>0$
, so that these modes belong the region
 $K>1$
.
As a result, only the branch
 $|{\it\varphi}|={\rm\pi}/2$
includes unstable modes, which are in the region
 $k<1$
and
 $r<r_{max}$
of figure 3(a). The mode with maximum (real) growth rate,
 ${\it\omega}_{max}$
, is given by
 $r=r_{max}<0$
for a given
 $La^{\ast }$
and is located at the intersection with the line
 $|{\it\varphi}|={\rm\pi}/2$
in figure 3(b). In fact, for given
 $La^{\ast }$
we solve
 $$\begin{eqnarray}\displaystyle \frac{\tanh q_{0,max}-q_{0,max}}{q_{max}^{5}}=-\frac{4}{La^{\ast }}, & & \displaystyle\end{eqnarray}$$
for
 $q_{0,max}$
and obtain
 ${\it\Omega}_{max}=-q_{0,max}^{2}/La^{\ast }$
. The result is shown in figure 4(b), where it is observed how
 ${\it\Omega}_{max}$
tends to the viscous value, namely
 ${\it\Omega}_{vis,max}=1/12$
(see (3.31)), as
 $La^{\ast }\rightarrow 0$
. It is also shown that the behaviour for large
 $La^{\ast }$
corresponds to a decreasing growth rate as a power law with exponent close to
 $0.42$
. Similar decreasing trends of the growth rates due to inertial effects have also been found in other problems (Oron et al.
Reference Oron, Davis and Bankoff1997; Ubal et al.
Reference Ubal, Grassia, Campana, Giavedoni and Saita2014).
Figure 3(b) also shows that the line
 $r=r_{max}<0$
is also intersected by the
 ${\it\varphi}=0$
line. Since it corresponds to monotonically damped perturbations in the region
 $0<K<1$
, this implies that the maximum damping for the stable mode occurs at the same
 $K$
than the unstable modes in the
 $|{\it\varphi}|={\rm\pi}/2$
.
Note that unstable monotonically growing modes are only possible for
 $K<1$
, so that neither the critical wavelength nor that of the maximum growth rate are affected by the value of
 $La^{\ast }$
. However, the maximum growth rate itself is altered by the relative weight of inertial effects with respect to viscosity and capillarity. Therefore, the Laplace number is relevant when discussing time scales and growth rates, but not for critical or dominant wavelengths.
The modes with
 $K>1$
correspond to the
 $r>0$
region and are always stable as is the case in the usual viscous lubrication approximation, but we want now to analyse whether there is any change in their behaviour when inertial effects are included. First, note that for each
 $K>1$
, there is a single value of
 $r>0$
(see figure 3
a). This value of
 $r$
could yield either
 ${\it\varphi}=0$
(blue line, upper branch) or
 $|{\it\varphi}|<{\rm\pi}/2$
at the black line in figure 3(b). Two different situations ensue. If
 $r>r_{b}$
, the solutions are on the
 ${\it\varphi}=0$
(blue) line, i.e. the modes are monotonically damped, and two different values of
 $q$
are admissible: one smaller and the other larger than
 $q_{0,b}$
. At the point
 $B=(r_{b},q_{0,b})$
, both roots degenerate into a single value. For
 $0<r<r_{b}$
, the roots are found along the black line, and the modes are oscillatory and damped. From (3.32), we find the wavenumber corresponding to point
 $B$
as given by
 $$\begin{eqnarray}\displaystyle K_{b}=\sqrt{\frac{1}{2}+\sqrt{\frac{1}{4}+\frac{1}{La^{\ast }\,r_{b}}}}. & & \displaystyle\end{eqnarray}$$
Thus, for
 $1<K<K_{b}$
there are two damped real modes, while for
 $K>K_{b}$
(
 $r<r_{b}$
) two oscillatory (complex) damped modes are possible with increasing frequency oscillations and stronger damping as
 $K$
increases.
In summary, the condition
 $\text{Im}(r)=0$
(i.e.
 $r$
real) yield three types of lines in the
 $(q_{0},{\it\varphi})$
plane, which can be classified as:
-
(i)
 ${\it\varphi}=0$
, which yields stable damped (real) modes;
-
(ii)
$|{\it\varphi}|={\rm\pi}/2$
, which can be related to unstable purely growing (real) modes; and -
(iii)
${\it\varphi}\neq 0,{\rm\pi}/2$
, that will produce stable oscillatory modes in time, i.e. complex conjugate roots of
${\it\Omega}$
.


The procedure to obtain the dispersion relation of the problem, i.e.
 ${\it\Omega}(K)$
, for a fixed
 $La^{\ast }$
is as follows. Given a value
 $K$
, we obtain the corresponding
 $r$
(see (3.32) and figure 3
a). Then, with this value of
 $r$
, we find
 $q_{0}$
(e.g. using figure 3
b). In the case of complex roots (black line) the corresponding value of
 ${\it\varphi}$
is a consequence of requiring that
 $\text{Im}(r)=0$
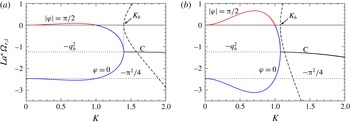
in (3.37). Once this is done, we obtain the full spectrum of modes as shown in figure 5. The dashed lines correspond to
 ${\it\Omega}_{i}$
for the complex modes along the black line named C.
We observe in figure 5 that
 $La^{\ast }$
strongly modifies some features of the complete dispersion relation. For instance, it modifies the maximum,
 ${\it\Omega}_{max}$
, in the unstable region (
 $K<1$
,
 ${\it\Omega}_{r}>0$
). Note that the product
 $La^{\ast }{\it\Omega}_{max}$
grows with
 $La^{\ast }$
because
 ${\it\Omega}_{max}$
decreases with
 $La^{\ast }$
with an exponent less than one (see figure 4
b). Analogously,
 $La^{\ast }$
also affects the minimum in the stable region with
 $K<1$
. For
 $K>1$
,
 $La^{\ast }$
only modifies the value of
 $K_{b}$
(see (3.45)).
Real (solid lines) and imaginary (dashed lines) parts of
 ${\it\Omega}={\it\Omega}_{r}+\text{i}{\it\Omega}_{i}$
multiplied by
 $La^{\ast }$
as a function of the wavenumber
 $K$
for (a)
 $La^{\ast }=1$
, and (b)
 $La^{\ast }=10$
. The curves for
 ${\it\Omega}_{r}>0$
and
 $K<1$
(unstable region) correspond to
 $|{\it\varphi}|={\rm\pi}/2$
, and those for
 ${\it\Omega}_{r}<0$
and
 $K<K_{b}$
(stable region for damped modes) correspond to
 ${\it\varphi}=0$
.

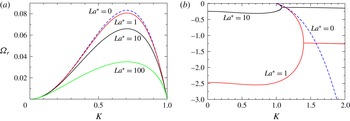
In figure 6 we show a more detailed comparison of the dispersion curves for several
 $La^{\ast }$
’s, both on the real growth rates for unstable (
 ${\it\Omega}_{r}>0$
) and stable (
 ${\it\omega}_{r}<0$
) modes. Panel (a) shows that as
 $La^{\ast }$
increases, the unstable modes have lower growth rates, but the wavenumber of the maximum growth is not altered and remains at
 $K_{max}=1/\sqrt{2}$
. For very small
 $La^{\ast }$
, the viscous dispersion relation is rapidly approached (see (3.31)). Figure 6(b) shows the stable region of the instability diagram (
 $K>1$
). For
 $1<K<K_{b}$
, there are two branches of modes that decay exponentially, a characteristic of the instability which is lost in the viscous approximation. For
 $K>1$
, the viscous solution,
 ${\it\Omega}_{vis}$
, is a fairly good approximation if
 $K\lesssim K_{b}$
, but fails for
 $K$
around
 $K_{b}$
. Clearly, this solution cannot describe the oscillating modes for
 $K>K_{b}$
.
Dispersion relations,
 ${\it\Omega}_{r}(k)$
, for some values of
 $La^{\ast }$
: (a) stable region, and (b) unstable region. The dashed line for
 $La^{\ast }=0$
is given by (3.31).

4. Bidimensional flow: linear stability analysis
We consider here the full N–S equations, (2.1a,b
), in dimensional form without the long-wave approximation assumptions, i.e. the ratio
 ${\it\varepsilon}$
is not necessarily small now. Therefore, the small perturbations of the free surface are done on the velocity and pressure fields, and are expressed in terms of normal modes with a wavenumber
 $\boldsymbol{k}=(k_{x},0,0)$
parallel to the substrate. Thus, we have
 $$\begin{eqnarray}\displaystyle \left.\begin{array}{@{}c@{}}{\it\delta}\boldsymbol{v}=\boldsymbol{v}(z)\,\text{e}^{\text{i}\boldsymbol{k}\,\boldsymbol{\cdot }\,\boldsymbol{r}+{\it\omega}t},\\ p=p_{0}+{\it\delta}p=p_{0}+p_{1}(z)\,\text{e}^{\text{i}\boldsymbol{k}\,\boldsymbol{\cdot }\,\boldsymbol{r}+{\it\omega}t},\\ h=h_{0}+{\it\delta}h=h_{0}+{\it\zeta}\,\text{e}^{\text{i}\boldsymbol{k}\,\boldsymbol{\cdot }\,\boldsymbol{r}+{\it\omega}t},\end{array}\!\right\} & & \displaystyle\end{eqnarray}$$
where
 $\boldsymbol{v}=(u(z),0,w(z))$
and
 ${\it\delta}h$
is the Lagrangian displacement of the free surface. Note that, for small perturbations, we have
 ${\it\zeta}=w(1)/{\it\omega}$
. Then, the N–S equation to first order in the perturbations becomes
 $$\begin{eqnarray}\displaystyle {\it\rho}\,\partial _{t}{\it\delta}\boldsymbol{v}=-\boldsymbol{{\rm\nabla}}{\it\delta}p+{\it\mu}{\rm\Delta}{\it\delta}\boldsymbol{v}. & & \displaystyle\end{eqnarray}$$
Since we assume incompressible flows,
 $\text{i}\boldsymbol{k}\boldsymbol{\cdot }\boldsymbol{v}=-Dw$
, where
 $D\equiv \text{d}/\text{d}z$
. In order to reduce the number of variables, we eliminate the pressure terms, by taking the
 $z$
component of the
 $\boldsymbol{{\rm\nabla}}\times \boldsymbol{{\rm\nabla}}\,\times$
(4.2). After some calculation, we obtain
 $$\begin{eqnarray}\displaystyle (D^{2}-k_{x}^{2})(D^{2}-s^{2}\,k^{2})w=0, & & \displaystyle\end{eqnarray}$$
where
 $k=k_{x}$
, and
 $$\begin{eqnarray}\displaystyle s^{2}\equiv 1+\,{\it\omega}/({\it\nu}k^{2}), & & \displaystyle\end{eqnarray}$$
or equivalently
 $$\begin{eqnarray}\displaystyle {\it\omega}=(s^{2}-1){\it\nu}k^{2}. & & \displaystyle\end{eqnarray}$$
The general solution of (4.3) is
 $$\begin{eqnarray}\displaystyle w=A_{1}\cosh (kz)+A_{2}\cosh (s\,kz)+A_{3}\sinh (kz)+A_{4}\sinh (s\,kz), & & \displaystyle\end{eqnarray}$$
where the constants
 $A_{i}$
(
 $i=1,\ldots ,4$
) are calculated by applying the following boundary conditions.
First, we impose the no-flow condition through the rigid substrate,
 $$\begin{eqnarray}\displaystyle \left.w\right|_{z=0}=0. & & \displaystyle\end{eqnarray}$$
Second, we shall assume that there is no slip at the substrate,
 $\left.u\right|_{z=0}=0$
. Since the flow is incompressible, then
 $$\begin{eqnarray}\displaystyle \left.Dw\right|_{z=0}=0. & & \displaystyle\end{eqnarray}$$
Third, the tangential stresses at the free surface should be zero,
 $\left.\boldsymbol{k}\boldsymbol{\cdot }\unicode[STIX]{x1D64E}\boldsymbol{\cdot }\boldsymbol{e}_{z}\right|_{z=h_{0}}=0$
, where
 $\unicode[STIX]{x1D64E}=-p\unicode[STIX]{x1D644}+{\it\mu}\boldsymbol{{\rm\nabla}}{\it\delta}\boldsymbol{v}+{\it\mu}(\boldsymbol{{\rm\nabla}}{\it\delta}\boldsymbol{v})^{\text{T}}$
is the stress tensor. By replacing here the perturbed quantities, (4.1), we find
 $$\begin{eqnarray}\displaystyle \left.(D^{2}+k^{2})w\right|_{z=h_{0}}=0. & & \displaystyle\end{eqnarray}$$
Finally, the normal stress at the free surface must satisfy the generalized Laplace pressure jump,
 $$\begin{eqnarray}\displaystyle \left.\boldsymbol{e}_{z}\boldsymbol{\cdot }\unicode[STIX]{x1D64E}\boldsymbol{\cdot }\boldsymbol{e}_{z}\right|_{z=h_{0}}={\it\gamma}\mathscr{C}+{\it\Pi}, & & \displaystyle\end{eqnarray}$$
where
 $\mathscr{C}=-k^{2}{\it\zeta}$
is the first-order curvature of the perturbed free surface. Since
 $$\begin{eqnarray}\displaystyle {\it\zeta}=\left.\frac{w}{{\it\omega}}\right|_{z=h_{0}}, & & \displaystyle\end{eqnarray}$$
we have
 $$\begin{eqnarray}\displaystyle \left.(-p_{1}+2{\it\mu}Dw)\right|_{z=h_{0}}=\left.\frac{\text{d}{\it\Pi}}{\text{d}h}\right|_{h=h_{0}}{\it\zeta}-{\it\gamma}k^{2}{\it\zeta}. & & \displaystyle\end{eqnarray}$$
Notice that the term in
 $\text{d}{\it\Pi}/\text{d}h$
plays a role that is analogous to that of
 ${\it\rho}g$
in the Rayleigh–Taylor instability of a thin film. In order to obtain
 $p_{1}$
for this equation, we perform the scalar product of (4.2) by
 $\boldsymbol{k}$
, and using (4.5) we find
 $$\begin{eqnarray}\displaystyle p_{1}={\it\mu}\left(\frac{D^{2}}{k^{2}}-s^{2}\right)Dw. & & \displaystyle\end{eqnarray}$$
Then, by replacing this expression of
 $p_{1}$
at
 $z=h_{0}$
into (4.12), we finally write this boundary condition as
 $$\begin{eqnarray}\displaystyle \left.\frac{{\it\gamma}}{\ell ^{2}}(k^{2}\ell ^{2}-1)\frac{w}{{\it\omega}}\right|_{z=h_{0}}=\left.{\it\mu}\left(\frac{D^{2}}{k^{2}}-2-s^{2}\right)Dw\right|_{z=h_{0}}, & & \displaystyle\end{eqnarray}$$
where
 $\ell$
is defined by (3.17).
From the above boundary conditions, (4.7)–(4.9) and (4.14), it is possible to build up a matricial system to solve the four unknowns,
 $A_{i}$
(
 $i=1,\ldots ,4$
). Its determinant must be zero to avoid a trivial solution. This condition leads to
 $$\begin{eqnarray}\displaystyle & & \displaystyle K^{3} [-4(s+s^{3})+s(5+2s^{2}+s^{4})\cosh (K{\it\varepsilon})\cosh (s\,K{\it\varepsilon})\nonumber\\ \displaystyle & & \displaystyle \quad -\,(1+6s^{2}+s^{4})\sinh (K{\it\varepsilon})\sinh (s\,K{\it\varepsilon})]\nonumber\\ \displaystyle & & \displaystyle \quad +\,La(K^{2}-1)[s\cosh (s\,K{\it\varepsilon})\sinh (K{\it\varepsilon})-\cosh (K{\it\varepsilon})\sinh (s\,K{\it\varepsilon})]=0,\end{eqnarray}$$
with
 $K$
and
 $La$
defined in (3.22a−g
) and (3.28), respectively.
This expression is the dispersion relation of the problem, since it implicitly gives
 $s$
as a function of
 $K$
. The values of
 ${\it\omega}$
can be obtained through (4.5), which in dimensionless variables is
 $$\begin{eqnarray}\displaystyle {\it\Omega}={\it\omega}{\it\tau}=\frac{K^{2}}{{\it\varepsilon}^{3}La}(s^{2}-1). & & \displaystyle\end{eqnarray}$$
It can be shown that (4.15) is identical to that obtained in Kargupta et al. (Reference Kargupta, Sharma and Khanna2004) if slipping at the substrate is neglected once we take into account that
 ${\it\alpha}$
and
 ${\it\beta}$
in their equations (6) and (7) are
 $K{\it\varepsilon}$
and
 $s\,K{\it\varepsilon}$
, respectively (our
 $s$
corresponds to their
 $q$
).
In order to obtain the limit of (4.15) for
 ${\it\varepsilon}\ll 1$
, note first that
 $q$
in (3.26) of the long-wave model is related to
 $s$
in (4.4) by
 $$\begin{eqnarray}\displaystyle q^{2}=(1-s^{2})K^{2}{\it\varepsilon}^{2}, & & \displaystyle\end{eqnarray}$$
and that
 $K\,{\it\varepsilon}=2{\rm\pi}h_{0}/{\it\lambda}<<1$
in this limit. In order to keep a meaningful value of
 $q$
,
 $|s|\gg 1$
is required, which means that
 $q\approx \text{i}Ks{\it\varepsilon}$
. Thus, with these ingredients in mind when analysing the limiting behaviour of the dispersion relation given by (4.15), to the lowest meaningful order in
 ${\it\varepsilon}$
, we find
 $$\begin{eqnarray}\displaystyle La^{\ast }\,K^{2}(K^{2}-1)(\tan q-q)=q^{5}, & & \displaystyle\end{eqnarray}$$
which is the same expression as given by the long-wave model when (3.32) and (3.33) are combined.
5. Comparison between long wave and bidimensional models
In this section we study the effects of
 $La$
and
 ${\it\varepsilon}$
on the dispersion relation for the unstable region as given by the one-dimensional (1-D) long-wave approximation and the bidimensional (2-D) model. For the 1-D case, we focus on the solution of (3.32) and (3.33) for
 ${\it\varphi}={\rm\pi}/2$
, while for the 2-D case we numerically solve (4.15) together with (4.16).
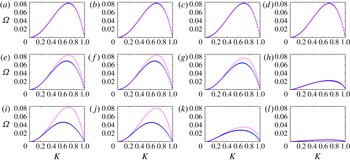
In figure 7 we show the comparison between 1-D and 2-D dispersion relations for given values of
 $La$
(columns) and
 ${\it\varepsilon}$
(rows). The inertial effects are shown along a given row (fixed
 ${\it\varepsilon}$
), with the first column being a viscous dominated flow and the fourth column corresponding to inertia dominated cases. For small
 ${\it\varepsilon}$
, as in first row where
 ${\it\varepsilon}=0.1$
, both dispersion relations are practically coincident for any value of
 $La$
, as expected and shown analytically in (4.18). In general, the long-wave model qualitatively predicts the same trends as the 2-D model. However, for
 ${\it\varepsilon}$
as large as
 ${\it\varepsilon}=0.5$
(second row), the quantitative comparison certainly depends on
 $La$
: the smaller
 $La$
, the larger is the departure between both models, i.e. 2-D effects become more important for flows with weak inertia. This effect is still more pronounced for larger
 ${\it\varepsilon}$
as seen in the third row for
 ${\it\varepsilon}=1$
. Also note that, for fixed
 $La$
, the position of the maximum shifts towards the left as
 ${\it\varepsilon}$
increases.
Dispersion relations,
 ${\it\Omega}$
as a function of
 $K$
, for different values of
 $La$
and
 ${\it\varepsilon}$
for the linearized problem: 2-D model (N–S solution, blue dots) and 1-D long-wave approximation with inertia (purple lines). For large
 $La$
(strong inertia) we obtain similar results for both models. For small
 $La$
(weak inertial effects) there are meaningful differences between both models (different
 ${\it\varepsilon}$
’s):
 ${\it\varepsilon}$
is constant for each row being 0.1 (a–d), 0.5 (e–h) and 1 (i–l) and
 $La$
is constant in each column and takes the values
 $10^{-2}$
(a,e,i), 1 (b,f,j),
 $10^{2}$
(c,g,k) and
 $10^{4}$
(d,h,l).

We focus now on the behaviour of the maximum of the dispersion relations, since its analysis provides interesting insight on the effects of both inertia and aspect ratio. While the behaviour for the 1-D model has been already described, the 2-D model results can be obtained noticing that for
 ${\it\Omega}={\it\Omega}_{max}$
:
 $$\begin{eqnarray}\displaystyle 0=\frac{\text{d}{\it\Omega}(s,K)}{\text{d}K}=\frac{\partial {\it\Omega}}{\partial K}+\frac{\partial {\it\Omega}}{\partial s}\frac{\text{d}s}{\text{d}K}. & & \displaystyle\end{eqnarray}$$
Since the dispersion relation satisfies
 $F(s,K)=0$
, one can calculate
 $$\begin{eqnarray}\displaystyle \frac{\text{d}s}{\text{d}K}=-\frac{\displaystyle \frac{\partial F}{\partial K}}{\displaystyle \frac{\partial F}{\partial s}}. & & \displaystyle\end{eqnarray}$$
Thus, using (4.16), it is possible to write
 $$\begin{eqnarray}\displaystyle 2K(s^{2}-1)\frac{\partial F}{\partial s}+2sK^{2}\frac{\partial F}{\partial K}=0, & & \displaystyle\end{eqnarray}$$
which we shall not write in full for brevity. By solving this expression in conjunction with (4.15) we are able to obtain
 ${\it\Omega}_{m}$
and
 $K_{m}$
as a function of both
 $La$
and
 ${\it\varepsilon}$
.
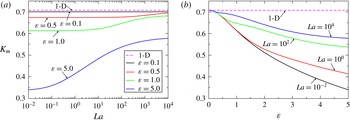
Wavenumber at the maximum growth rate,
 $K_{m}$
, as a function of: (a)
 $La$
for different
 ${\it\varepsilon}$
’s, and (b)
 ${\it\varepsilon}$
for different
 $La$
’s. The solid lines correspond to the 2-D model, and the dashed line to the 1-D (long wave) model,
 $K_{m}^{1D}=1/\sqrt{2}=0.707$
.

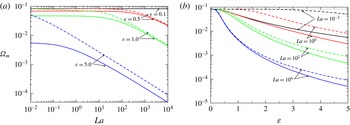
Maximum growth rates,
 ${\it\Omega}_{m}$
, as a function of: (a)
 $La$
for different
 ${\it\varepsilon}$
’s, and (b)
 ${\it\varepsilon}$
for different
 $La$
’s. The solid lines correspond to the 2-D model, and the dashed line to the 1-D (long wave) model (same colour implies same
 ${\it\varepsilon}$
in (a), and same
 $La$
in (b)). The upper dotted line in both figures is the purely viscous (
 $La=0$
) growth rate,
 ${\it\Omega}_{m,vis}=1/12=0.0833$
. In (a), the 1-D and 2-D models for
 ${\it\varepsilon}=0.1$
are graphically superimposed to the this value of
 ${\it\Omega}_{m}$
.

In figure 8 we show the wavenumber at the maximum growth rate,
 $K_{m}$
, as a function of
 $La$
for several aspect ratios
 ${\it\varepsilon}$
’s, and vice-versa. Recall that for the 1-D model, we simply have
 $K_{m}=1/\sqrt{2}$
, independently of both
 $La$
and
 ${\it\varepsilon}$
. For small
 $La$
, the departure between both models can be very large if
 ${\it\varepsilon}$
is not very small. In fact, the value of
 $K_{m}$
can be reduced even up to
 $50\,\%$
for
 ${\it\varepsilon}$
as large as
 ${\it\varepsilon}=5$
(see figure 8
a). The difference remains also for large
 $La$
, but it reduces for smaller
 ${\it\varepsilon}$
. This effect is clearly shown in figure 8(b) since, even if the departure increases for
 ${\it\varepsilon}$
increasing, it is smaller for larger
 $La$
’s. Therefore, the lubrication and the long-wave approximations predict larger distances between drops after breakup if the corresponding aspect ratio does not fulfil the requirement
 ${\it\varepsilon}\ll 1$
. However, this discrepancy is smaller for larger
 $La$
’s.
Figure 9 shows the maximum growth rate,
 ${\it\Omega}_{m}$
, as a function of
 $La$
for several aspect ratios
 ${\it\varepsilon}$
’s, and vice-versa. The curves for the 1-D model are obtained for the corresponding value of
 $La^{\ast }$
as given by (3.27). The difference in
 ${\it\Omega}_{m}$
between both models for small
 $La$
can be very large if
 ${\it\varepsilon}$
is sufficiently large (see figure 9
a). Instead, for large
 $La$
both models agree in a power law decrease of
 ${\it\Omega}_{m}$
with differences that increase for larger
 ${\it\varepsilon}$
, as expected.
The departures for small
 $La$
and large
 ${\it\varepsilon}$
are also seen in figure 9(b) which shows how the 1-D curves with smaller
 $La$
separate more and more from the corresponding 2-D curves for smaller
 $La$
’s. Thus, for small values of
 $La$
, the discrepancy in
 ${\it\Omega}_{m}$
between the 1-D and 2-D models can be very large, even if
 ${\it\varepsilon}$
is not strictly much less than one (see also figure 11). Note that even if both models tend to coincide as
 ${\it\varepsilon}\rightarrow 0$
(as expected) this coincidence occurs for smaller values of
 ${\it\varepsilon}$
as
 $La$
decreases.
6. Numerical simulations
In order to analyse the validity range of the predictions of both LSAs described above, we perform numerical simulations of the instability by solving the complete set of N–S equations. Here, we use the two-phase flow, moving mesh interface of COMSOL Multiphysics. It solves the full incompressible N–S equations using the Finite Element technique in a domain which deforms with the moving fluid interface by using the arbitrary Lagrangian–Eulerian (ALE) formulation. The interface displacement is smoothly propagated throughout the domain mesh using the Winslow smoothing algorithm. The main advantage of this technique compared to others such as the level set of phase field techniques is that the fluid interface is, and remains, sharp. The main drawback, on the other hand, is that the mesh connectivity must remain the same, which precludes the modelling of situations for which the topology might change. The default mesh used throughout is unstructured and has
 $2940$
triangular elements (P1 linear elements for both velocity and pressure). Automatic remeshing is enabled to allow the solution to proceed even for large domain deformation when the mesh becomes severely distorted. The mesh nodes are constrained to the plane of the boundary they belong to for all but the free surface.
We adapt the same physical boundary conditions used above to the complete (nonlinear) 2-D problem. Thus, we write the kinematic condition as:
 $$\begin{eqnarray}\displaystyle \left(\boldsymbol{v}-\frac{\partial h}{\partial t}\right)\boldsymbol{\cdot }\boldsymbol{n}=0, & & \displaystyle\end{eqnarray}$$
 $\boldsymbol{n}$
being the external unit normal vector. Both surface tension and disjoining pressure exert normal stresses at the liquid–air interface
 $$\begin{eqnarray}\displaystyle \unicode[STIX]{x1D64E}\boldsymbol{\cdot }\boldsymbol{n}=\left({\it\sigma}\mathscr{C}-{\it\kappa}f(h)\right)\boldsymbol{n}, & & \displaystyle\end{eqnarray}$$
where
 $\mathscr{C}=-\boldsymbol{{\rm\nabla}}_{s}\boldsymbol{\cdot }\boldsymbol{n}$
is the curvature of the free surface,
 ${\rm\nabla}_{s}=\unicode[STIX]{x1D644}_{s}\boldsymbol{\cdot }\boldsymbol{{\rm\nabla}}$
is the surface gradient operator and
 $\unicode[STIX]{x1D644}_{s}=\unicode[STIX]{x1D644}-\boldsymbol{n}\,\boldsymbol{n}$
the surface identity tensor. At the ends of the domain (
 $x=0$
and
 $x=d$
) periodic boundary conditions are applied for both the velocity field and shape of the free surface. On the liquid–solid interface, the no slip and no-penetration conditions (
 $\boldsymbol{v}=0$
) are applied.
Since we must have the same length scale in both
 $x$
and
 $z$
directions in the solution of the full nonlinear N–S equations, we define now a slightly different dimensionless set of units than in LSA for the long-wave approximation (see (3.22a−g
)). Thus, the dimensionless variables in the numerical simulations are given by:
 $$\begin{eqnarray}\displaystyle z=\ell \tilde{z},\quad x=\ell \tilde{x},\quad t={\it\tau}\tilde{t},\quad u=\frac{{\it\gamma}}{{\it\mu}}\tilde{u} ,\quad w=\frac{{\it\gamma}}{{\it\mu}}\tilde{w},\quad p=\frac{{\it\gamma}}{\ell }\tilde{p}, & & \displaystyle\end{eqnarray}$$
which yields the dimensionless form of N–S equations
 $$\begin{eqnarray}\displaystyle & \displaystyle La\left(\frac{\partial \tilde{u} }{\partial \tilde{t}}+\tilde{u} \frac{\partial \tilde{u} }{\partial \tilde{x}}+w\frac{\partial \tilde{u} }{\partial \tilde{z}}\right)=-\frac{\partial \tilde{p}}{\partial \tilde{x}}+\left(\frac{\partial ^{2}\tilde{u} }{\partial \tilde{x}^{2}}+\frac{\partial ^{2}\tilde{u} }{\partial \tilde{z}^{2}}\right), & \displaystyle\end{eqnarray}$$
 $$\begin{eqnarray}\displaystyle & \displaystyle La\left(\frac{\partial \tilde{w}}{\partial \tilde{t}}+\tilde{u} \frac{\partial \tilde{w}}{\partial \tilde{x}}+\tilde{w}\frac{\partial \tilde{w}}{\partial \tilde{z}}\right)=-\frac{\partial \tilde{p}}{\partial \tilde{z}}+\left(\frac{\partial ^{2}\tilde{w}}{\partial \tilde{x}^{2}}+\frac{\partial ^{2}\tilde{w}}{\partial \tilde{z}^{2}}\right). & \displaystyle\end{eqnarray}$$
 $$\begin{eqnarray}\displaystyle \tilde{\unicode[STIX]{x1D64E}}\boldsymbol{\cdot }\boldsymbol{n}=\left(\tilde{\mathscr{C}}-\frac{{\it\varepsilon}}{g_{0}}f(\tilde{h})\right)\boldsymbol{n}. & & \displaystyle\end{eqnarray}$$
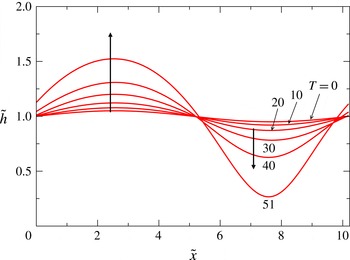
Time evolution of thickness profile for
 $La=1$
and
 ${\it\varepsilon}=1$
. We use
 $A_{0}=0.05$
.

In order to observe the evolution of the mode with maximum growth rate in the 2-D model, we choose the length of the domain size in
 $x$
-direction as
 $\tilde{d}=\tilde{{\it\lambda}}_{m}=2{\rm\pi}/K_{m}^{2D}$
. Note that this value is not coincident with
 $K_{m}^{1D}$
(see figure 8). Thus, we use the following monochromatic initial perturbation of the free surface
 $$\begin{eqnarray}\displaystyle \tilde{h}(x,t=0)={\it\varepsilon}+A_{0}\sin \left(\frac{2{\rm\pi}\tilde{x}}{\tilde{d}}\right), & & \displaystyle\end{eqnarray}$$
where
 $A_{0}$
is a small amplitude (
 $A_{0}=0.05$
in the present calculations). In figure 10 we show a time evolution of the thickness profile for
 $La=1$
and
 ${\it\varepsilon}=1$
(we use
 $(n,m)=(3,2)$
and
 $\tilde{h}_{\ast }=10^{-2}$
in all the following cases, unless otherwise stated). We carry on the simulation until the film becomes too close to
 $\tilde{h}_{\ast }$
, where the numerical method is unable to converge, although continuation is sometimes possible by using automatic remeshing.
We study the evolution of the instability by tracking the maximum and minimum amplitudes of the free-surface deformation by defining
 $$\begin{eqnarray}\displaystyle & \displaystyle A_{max}(\tilde{t})=\max _{0\leqslant \tilde{x}\leqslant \tilde{L}}\left|1-\frac{\tilde{h}(\tilde{t})}{{\it\varepsilon}}\right|, & \displaystyle\end{eqnarray}$$
 $$\begin{eqnarray}\displaystyle & \displaystyle A_{min}(\tilde{t})=\min _{0\leqslant \tilde{x}\leqslant \tilde{L}}\left|1-\frac{\tilde{h}(\tilde{t})}{{\it\varepsilon}}\right|. & \displaystyle\end{eqnarray}$$
These results are plotted in figure 11 for the same values of
 $La$
used in figure 7, but
 ${\it\varepsilon}=0.5,1,2$
. The numerical nonlinear solution of the problem shows that both
 $A_{max}$
and
 $A_{min}$
are practically coincident during a relatively long time of the evolution. Within the wide ranges of
 $La$
and
 ${\it\varepsilon}$
shown in figure 11, this behaviour is observed for at least two thirds of the total time required for the full development of the instability. This indicates that linear models, such as those presented previously, are relevant to describe the flow beyond the onset of the instability.
In order to compare the numerical results with the linear models, we plot in figure 11 the expected exponential behaviour as,
 $$\begin{eqnarray}\displaystyle A=0.05\,\text{e}^{{\it\alpha}\text{T}}, & & \displaystyle\end{eqnarray}$$
where
 ${\it\alpha}$
is given by the predicted growth rate for
 $K_{m}^{2D}$
. For the 1-D model,
 ${\it\alpha}$
is the corresponding growth rate for
 $K_{m}^{2D}$
, i.e.
 ${\it\alpha}={\it\Omega}^{1D}(K_{m}^{2D})$
, which in general does not coincide with the maximum growth rate within this approximation. For the 2-D model,
 ${\it\alpha}={\it\Omega}^{2D}(K_{m}^{2D})={\it\Omega}_{m}$
, which is indeed the absolute maximum for this approach. Moreover, after separation of
 $A_{max}$
and
 $A_{min}$
, we expect that
 $A_{max}$
remains closer to the exponential growth than
 $A_{min}$
, which is more strongly affected by the presence of the substrate. This effect is certainly observed in the numerical results.
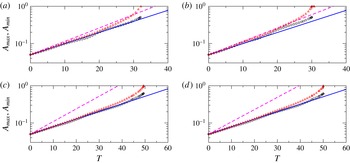
Time lines of the amplitudes
 $A_{max}$
(○) and
 $A_{min}$
(▵) with
 $T=\tilde{t}{\it\varepsilon}^{3}$
for different values of
 $La$
(a,c)
 $La=10^{-2}$
; (b,d)
 $La=10^{0}$
and
 ${\it\varepsilon}$
(a,b)
 ${\it\varepsilon}=0.5$
; (c,d)
 ${\it\varepsilon}=1$
. The lines correspond to the exponential behaviour
 $A=0.05\,\exp [{\it\Omega}_{m}T]$
, where
 ${\it\Omega}_{m}$
corresponds to the value given by either the 2-D (solid line) or 1-D (dashed line) model.

Figure 11 shows that for small
 $La$
, say
 $La=0.01$
and
 $1$
, there is a very good agreement with the exponential behaviour of the 2-D model prediction (solid blue lines). In general, the 1-D model is not a good approximation, except for very small
 ${\it\varepsilon}$
, as expected. For both models, we use
 $T_{0}=0$
since the behaviour of
 $A_{max}$
and
 $A_{min}$
is of the exponential type from the very beginning. This type of growth is also observed for
 $La=100$
and
 ${\it\varepsilon}=0.5$
, but
 $T_{0}\neq 0$
is needed for large
 ${\it\varepsilon}$
, thus indicating the presence of a very early stage with slower (non-exponential) growth. This effect is still more pronounced for
 $La$
as large as
 $La=10^{4}$
. In these cases, where there is still an acceptable agreement between the 2-D model and the numerics for relatively large
 ${\it\varepsilon}$
. However, for this very large value of
 $La$
, as
 ${\it\varepsilon}$
is decreased, neither the 1-D nor 2-D models are able to capture the actual evolution of the complete nonlinear problem. This issue deserves further investigation, which is out of the scope of the present paper and remains for future work.
It is worth noting that the exponents
 $n$
and
 $m$
of the disjoining pressure in (2.3) do not a play a role in both linear analyses performed here. Their influence in this stage is somehow hidden in the length scale,
 $\ell$
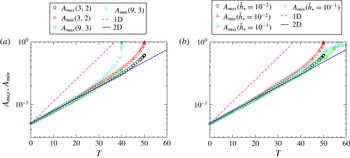
, defined in (3.17). However, some effects are expected in the numerical solution of the fully nonlinear N–S equations, since they appear in the boundary condition given by (6.6). Figure 12a shows a comparison of the time evolution of
 $A_{max}$
and
 $A_{min}$
for
 $(n,m)=(3,2)$
and
 $(9,3)$
, which are typical pairs of the exponents used in the literature (Schwartz Reference Schwartz1998). Clearly, both cases are practically coincident in the linear stage, and are in agreement with the linear 2-D model. For larger times, the corresponding nonlinear regimes strongly differ, thus leading to different breakup times, so that the effect of the exponents is limited to the short final nonlinear stage. Similarly, figure 12(b) shows the same time lines for two different values of
 $\tilde{h}_{\ast }$
and a given pair of
 $(n,m)$
. Also in this case, only the nonlinear stage of the evolution changes for different thicknesses
 $\tilde{h}_{\ast }$
, without any significant change of the early linear stage. For
 $\tilde{h}_{\ast }$
as small as
 $\tilde{h}_{\ast }=10^{-3}$
, no difference is observed either in the linear or in the nonlinear stages. This so because
 $\tilde{h}_{\ast }$
becomes negligible with respect to
 $\tilde{h}_{0}$
.
Time lines of the amplitudes
 $A_{max}$
and
 $A_{min}$
for
 $La=1$
and
 ${\it\varepsilon}=1$
for: (a) two different pairs of exponents
 $(n,m)$
and
 $\tilde{h}_{\ast }=10^{-2}$
, (b) two different values of
 $\tilde{h}_{\ast }$
and exponents
 $(n,m)=(3,2)$
. Symbols indicate numerical simulations, lines the predictions of linear models.

7. Summary and conclusions
In this work, we have developed three different approaches to study the instability of a flat liquid thin film under partial wetting conditions, and subject to intermolecular forces (disjoining pressure): long-wave 1-D model (with inertia), linear 2-D model, and fully nonlinear numerical simulations. Firstly, we have extended the purely viscous analysis within the lubrication approximation to one where inertial effects are taken into account, which we call for brevity the 1-D model. The LSA of this model shows that inertia does not lead to new regions of instability compared with the purely viscous case. Instead, it adds new stable modes: some which are exponentially decaying, and others which are damped oscillations. The former extend over the same range of the unstable modes and even beyond, while the latter appear for larger wavenumbers. In the unstable region of most interest here, we find that both the marginal wavenumber and that of the maximum growth rate do not change at all with the addition of inertia. However, the results clearly show that the growth rates of the instability decrease as inertial effects are stronger. The intensity of these effects is here quantified by a single parameter, namely the modified Laplace number,
 $La^{\ast }=La\,{\it\varepsilon}^{5}$
. Therefore, the approximation can be applied only for large
 $La$
, since
 ${\it\varepsilon}\ll 1$
is required for the approach to be valid.
Secondly, we develop a LSA of the N–S equations, so that the restriction of small aspect ratio,
 ${\it\varepsilon}$
, is no longer required. This calculation, called for brevity the 2-D model, is particularly useful to assess the accuracy of the 1-D model predictions. The main difference between these models is the way that inertia is treated. In the linear 1-D model, the convective terms for the horizontal direction are still taken into account, while horizontal and vertical convective terms are neglected in the linear 2-D model, although the viscous Laplacian term is now fully conserved for both directions. Thus, we have now two independent parameters to characterize the flow, namely
 $La$
and
 ${\it\varepsilon}$
. The 2-D model shows that the marginal wavenumber remains the same as in the 1-D model, and does not depend on
 $La$
. However, unlike the 1-D model, the 2-D model shows that
 $K_{m}$
is not constant, and decreases as
 $La$
increases. This is an important result, since it shows that inertia can modify the distance between the final drops, which must be more separated with respect to the purely viscous case.
With respect to the dependence of the growth rates with
 $La$
, the 2-D model also shows that they decrease for increasing
 $La$
, but the strength of the effect is greater than what is predicted by the 1-D model. Interestingly, the discrepancies between both models decrease as
 $La$
increases, i.e. for larger inertial effects. Note also that both models capture the main scaling of the dimensional growth rate,
 ${\it\omega}$
, with the aspect ratio
 ${\it\varepsilon}$
. Thus, we can write,
 $$\begin{eqnarray}\displaystyle {\it\omega}_{1}(k)=\frac{{\it\varepsilon}^{3}}{{\it\tau}}{\it\Omega}_{1}(k\ell ;La\,{\it\varepsilon}^{5}),\quad {\it\omega}_{2}(k)=\frac{{\it\varepsilon}^{3}}{{\it\tau}}{\it\Omega}_{2}(k\ell ;La,{\it\varepsilon}), & & \displaystyle\end{eqnarray}$$
where the subscripts
 $1$
and
 $2$
correspond to the 1-D and 2-D models, respectively.
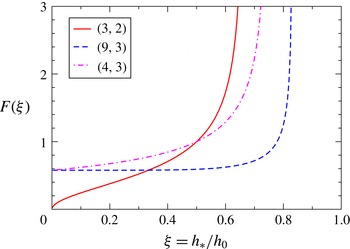
Function
 $F({\it\xi})$
that determines the influence of
 $h_{\ast }$
on the characteristic length scale,
 $\ell$
.

Finally, we are concerned now with obtaining a prediction of the both
 $k_{m}$
and
 ${\it\omega}_{m}$
as a function of the film thickness,
 $h_{0}$
, for a given experimental configuration. In order to do so, we recall that (Israelachvili Reference Israelachvili1992)
 $$\begin{eqnarray}\displaystyle {\it\kappa}=\frac{A}{6{\rm\pi}h_{\ast }^{3}}, & & \displaystyle\end{eqnarray}$$
where
 $A$
is the Hamaker constant. Thus, the characteristic length,
 $\ell$
, given by (3.17) can be written as
 $$\begin{eqnarray}\displaystyle \ell =F({\it\xi})\frac{h_{0}^{2}}{L}, & & \displaystyle\end{eqnarray}$$
where
 $$\begin{eqnarray}\displaystyle L=\sqrt{\frac{A}{6{\rm\pi}{\it\gamma}}},\quad F({\it\xi})=\sqrt{\frac{{\it\xi}^{3}}{g_{0}({\it\xi})}}, & & \displaystyle\end{eqnarray}$$
and
 ${\it\xi}=h_{\ast }/h_{0}$
. The function
 $F({\it\xi})$
, which describes the effects of
 $h_{\ast }$
, is shown in figure 13 for three usual values of
 $(n,m)$
. Interestingly, the cases with
 $m=3$
and large
 $n$
present a practically constant region for
 ${\it\xi}<0.5$
, which is a typical range in experiments. In these cases, we notice that
 $\ell \propto h_{0}^{2}$
, thus
 ${\it\varepsilon}\propto h_{0}^{-1}$
and
 $La\propto h_{0}^{2}$
. Instead, if
 $m<3$
, say
 $m=2$
, the behaviour is different since
 $F\rightarrow 0$
for decreasing
 $h_{\ast }$
. For
 $(3,2)$
, we have
 $\ell \propto h_{0}^{3/2}$
, thus
 ${\it\varepsilon}\propto h_{0}^{-1/2}$
and
 $La\propto h_{0}^{3/2}$
.
These results should be taken into account when analysing experimental data within a given hydrodynamic model. For instance, the lubrication approximation would not become more valid as
 $h_{0}$
decreases (as could be expected a priori) since
 ${\it\varepsilon}$
increases for thinner films. In fact, let us consider the data from the experiments with melted copper films on a
 $\text{SiO}_{2}$
substrate reported in González et al. (Reference González, Diez, Wu, Fowlkes, Rack and Kondic2013). In this case, we have
 ${\it\gamma}=1.304~\text{N}~\text{m}^{-1}$
,
 ${\it\mu}=0.00438~\text{Pa}~\text{s}$
, and the experiments could be fitted with a purely viscous lubrication model using
 $A=2.58\times 10^{-18}~\text{J}$
,
 $h_{\ast }=0.1~\text{nm}$
and
 $(n,m)=(3,2)$
. Thus, we calculate the corresponding values of
 ${\it\varepsilon}$
and
 $La$
for film thickness,
 $h_{0}$
, in the interval
 $(1,100)~\text{nm}$
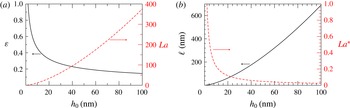
, as shown figure 14(a). Note that even if inertial effects increase as
 $h_{0}$
increases,
 ${\it\varepsilon}$
decreases even faster, so that lubrication approximation assumptions apply for larger
 $h_{0}$
’s (see also
 $La^{\ast }$
in figure 14
b). Consistently, figure 14(b) indicates that the length
 $\ell$
(proportional to the critical wavelength) increases with
 $h_{0}$
, so that wavelengths of some hundreds of nanometres should be expected for these film thicknesses.
Dependence of the dimensionless parameters
 ${\it\varepsilon}$
,
 $La$
,
 $La^{\ast }$
, and the characteristic length scale,
 $\ell$
, as a function of the film thickness,
 $h_{0}$
, for melted copper films.

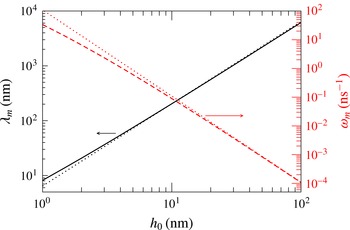
In particular, we show the wavelength of maximum growth rate,
 ${\it\lambda}_{m}$
, as well as the corresponding growth,
 ${\it\omega}_{m}$
, as a function of
 $h_{0}$
in figure 15. The asymptotic power laws for large
 $h_{0}$
, given by the lubrication approximation where
 $K_{m}=1/\sqrt{2}$
and
 ${\it\Omega}_{m}=1/12$
are (see also (3.22a−g
)),
 $$\begin{eqnarray}\displaystyle {\it\lambda}_{m}=2{\rm\pi}\sqrt{\frac{L^{2}}{h_{\ast }}}h_{0}^{3/2},\quad {\it\omega}_{m}=\frac{{\it\gamma}}{3{\it\mu}}\frac{L^{4}}{h_{\ast }^{2}}h_{0}^{-3}. & & \displaystyle\end{eqnarray}$$
These expressions are plotted as dotted lines in figure 15. Therefore, we conclude that both inertial and bidimensional effects are not significant if
 $h_{0}\gtrsim 20h_{\ast }$
, and it is thus safe to use lubrication approximation results to describe the instability, even for large
 $La$
, provided
 $h_{0}\gg h_{\ast }$
, as in the experiments reported by González et al. (Reference González, Diez, Wu, Fowlkes, Rack and Kondic2013). However, for very thin nanometric films with
 $h_{0}\lesssim 10h_{\ast }$
, these effects should be taken into account, especially when analysing the growth rates of the unstable modes. The effects of inertia in the context of nanometric problems has recently been discussed in Fowlkes et al. (Reference Fowlkes, Roberts, Wu, Diez, González, Hartnett, Mahady, Afkhami, Kondic and Rack2014), where they are considered as important during the instability development of a nickel filament on silicon oxide, and the resulting formation of drops with satellite droplets. The typical physical parameters for nickel are very similar to those of the copper mentioned here.
Wavelength of maximum growth rate,
 ${\it\lambda}_{m}$
, and the corresponding growth,
 ${\it\omega}_{m}$
, as a function of the film thickness,
 $h_{0}$
, for melted copper films.

Naturally, the inertial and dimensional effects studied here are expected to be more important for smaller viscosity,
 ${\it\mu}$
. Regarding the microscopic parameters, one should consider materials with larger values of the Hamaker constant,
 $A$
, and smaller values of the equilibrium thickness,
 $h_{\star }$
. Small variations of these numbers in this direction can produce large increments of
 $La$
and
 ${\it\varepsilon}$
, and consequently, the approaches developed here could become relevant to describe these effects.
Acknowledgements
A.G.G. and J.A.D. acknowledge support from Consejo Nacional de Investigaciones Científicas y Técnicas de la República Argentina (CONICET, Argentina) with grant PIP 844/2011 and Agencia Nacional de Promoción de Científica y Tecnológica (ANPCyT, Argentina) with grant PICT 931/2012. M.S. gratefully acknowledges the College of Engineering at University of Canterbury for its financial support to visit A.G.G. and J.A.D. in Argentina.