I. INTRODUCTION
Hydrogen storage is an important aspect in enabling the so-called ‘hydrogen economy’. Reference Sakintuna, Lamari-Darkrim and Hirscher1 One of the current challenges is to develop a safe and efficient reversible hydrogen storage system. Magnesium and its alloys provide great advantages in terms of light weight, low cost, and excellent storage capacity Reference Züttel, Hirscher, Panella, Yvon, Orimo, Bogdanović, Felderhoff, Schüth, Borgschulte, Goetze, Suda and Kelly2 e.g., 7.6 wt% H/Mg or 3.6 wt% H/Mg2Ni though still being limited by their slow kinetics of hydrogen sorption and high temperature of desorption. Therefore, it is necessary to overcome the hurdle of sluggish kinetic performance for Mg alloys to gain further commercial significance.
Current strategies to improve the hydrogenation properties of Mg-based alloys can be categorized into either the fabrication of ultra-fine microstructures or the introduction of catalytic elements. In the first approach, numerous studies have used high energy ball milling (HEBM), Reference Zaluski, Zaluska and Ström-Olsen3–Reference Vyas, Jain, Khan, Kulshrestha, Jain and Jain8 cold rolling, Reference Amira and Huot9 accumulative roll-bonding, Reference Danaie, Mauer, Mitlin and Huot10 equal channel angular pressing, Reference Skripnyuk, Buchman, Rabkin, Estrin, Popov and Jorgensen11 etc. for this purpose. The latter approach deals with adding alloying elements including e.g., transition metals, Reference Cho, Aminorroaya, Liu and Dahle12 rare earth elements, Reference Kalinichenka, Röntzsch, Riedl, Weißgärber and Kieback13 or other catalysts, Reference Polanski and Bystrzycki14,Reference Janot, Aymard, Rougier, Nazri and Tarascon15 to improve the hydrogen sorption kinetics and achieve a lower temperature of dehydrogenation.
Previous studies have indicated the catalytic effect of alloying Mg with Ni to achieve better kinetics via the introduction of the Mg2Ni phase. Reference Reilly and Wiswall16–Reference Schlapbach, Shaltiel and Oelhafen19 Attempts have been made to further improve the reaction kinetics of Mg–Ni alloys by doping the Mg2Ni with rare-earth elements e.g., Y Reference Song, Li, Zhang, Kou and Xue20 and Nd Reference Xie, Li, Zeng, Sun and Qu21 or through severe plastic deformation methods and HEBM. Reference Zaluski, Zaluska and Ström-Olsen3,Reference Révész, Gajdics, Varga, Krállics, Péter and Spassov22,Reference Hongo, Edalati, Arita, Matsuda, Akiba and Horita23 In earlier work, Reference Nogita, Ockert, Pierce, Greaves, Gourlay and Dahle24 we have indicated the effect of elemental Na doping in modifying the eutectic microstructure and inducing crystallographic defects within the eutectic Mg2Ni and thus, creating a synergistic effect to further enhance the hydrogen sorption of hypoeutectic Mg–Ni alloys. However, in those studies, Mg2Ni was only present as a minor fraction of the microstructure and mainly provided a catalytic effect for the hydrogen absorption in Mg–Ni alloys.
The current study aims to provide further insights into the governing mechanisms of Na-induced kinetic improvements in the hypereutectic Mg–Ni alloys where Mg2Ni becomes the dominant phase of interest. In particular, the relation between microstructural/crystallographic features and corresponding hydrogenation behaviors will be investigated. It is anticipated the results will be beneficial for systems utilizing Mg2Ni either as an alternative hydrogen storage medium to Mg or functioning as a catalyst for the hydrogenation of Mg-based alloys.
II. EXPERIMENTAL
A. Materials synthesis
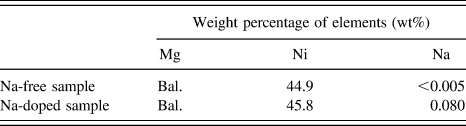
The alloy under investigation was prepared by induction melting of pure magnesium (99.9%) and nickel (99.8%) to a nominal composition of 55 wt% Mg–45 wt% Ni under a protective gas mixture (SF6 and CO2). Addition of 0.2 wt% elemental sodium was made shortly before the casting. The final chemical composition is shown in Table I for both samples without/with Na. This corresponds to a hyper-eutectic Mg2Ni-rich composition based on the Mg–Ni phase diagram. Reference Clark25 Samples were then prepared for powder diffraction measurement by means of mechanical grinding and selective sieving for a particle size of less than 300 µm. After passing through a range of sieve sizes, the effective particle size was determined approximately as 134(±10) and 111(±10) µm for samples without and with Na, respectively (detailed results can be found in Appendix A). It is anticipated that a particle's size may have a significant effect on the alloy's hydriding mechanism in bulk samples versus nanoparticles. An example can be found elsewhere for the dehydriding mechanism of MgH2 bulk and thin samples. Reference Nogita, Tran, Yamamoto, Tanaka, McDonald, Gourlay, Yasuda and Matsumura26
Chemical compositions of the experimental samples.

Bal. = Balance.
B. Microstructure characterization
The microstructure of the materials was characterized using a scanning electron microscope (SEM; JEOL-6610, JEOL Ltd., Tokyo, Japan). To further investigate crystallographic defects such as dislocations, a transmission electron microscope (TEM; JEOL-2100, JEOL Ltd.) was used in association with focused ion beam milling (FEI Quanta 3D Dual-beam FIB, FEI Company, Hillsboro, Oregon) and also Twin-Jet Polishing (Struers TenuPol-5, Struers, Brisbane, Australia).
To prepare partially hydrided samples for SEM characterization, a Sieverts type hydrogen testing rig (Suzuki-shokan, Tokyo, Japan) was used under conditions of 340 °C and 1 MPa pure H2.
C. Surface analysis with x-ray photoelectron spectroscopy (XPS)
The surface analysis of samples was carried out using XPS (Kratos Axis Ultra XPS [Kratos Analytical, Manchester, United Kingdom] incorporated with a 165 mm hemispherical electron energy analyzer) for survey scans (pass energy of 160). Since air exposure may have a significant effect on the surface chemistry of the materials, XPS samples were prepared in the same manner described above as for the synchrotron XRD and kept under an Ar atmosphere for one day prior to the analysis. The obtained data was analyzed using the CasaXPS software (version 2.3.14) with a Shirley baseline fitting. The XPS technique provides information of the outer most 5–10 nm atomic layers of the samples. For calibration of the binding energy, C 1s (C–C bond) at 286.5 eV was used.
D. In situ synchrotron XRD experiments
For in situ XRD experiments, the powdered sample was loaded into a quartz capillary of 700 µm diameter within a gas flow cell and measured using the powder diffraction beamline at the Australian synchrotron facility. The flow cell was connected to a hydrogen gas bottle with temperature controlled via a hot air blower. Prior to measurements, the capillary containing powdered sample was vacuumed with a turbo pump and flushed with H2 (99.99%) three times at room temperature to minimize any air contamination. In situ XRD experiments were then conducted while the sample was simultaneously pressurized under a 2 MPa hydrogen atmosphere and heated isothermally at 350 °C. The ramp rate of temperature was 100 °C/min. Each data point was taken based on an average data recording over 5 min periods. A schematic presentation of the experimental set-up can be found elsewhere. Reference Tran, McDonald, Gu and Nogita27
For calibration purpose, a LaB6 660b National Institute of Standards and Technology (NIST) standard was used and the refined wave length was 0.6882 Å. The obtained XRD data were search-matched using the EVA software (Bruker-AXS) to determine the phase ID based on PDF-2-Release 2012 ICDD database. Rietveld refinement was conducted with TOPAS 4.2 software (Bruker-AXS) to obtain quantitative phase analysis. As a reference, the following crystallographic information files were used as starting structure models: # 052260 (Mg, P63/mmc), # 161962 (MgH2, P42/mnm), # 162411 (Mg2Ni, P
6222), # 638293 (Mg2NiH0.3, P
6222), and # 162412 (Mg2NiH4,
 $Fm\overline {\rm{3}} m$
). The peak shapes were described using the fundamental parameter type.
III. RESULTS
A. Microstructural characterization by SEM/TEM
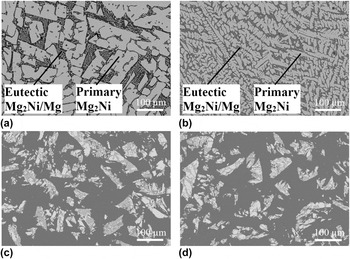
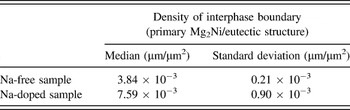
The microstructures of the alloys are shown in Fig. 1 in both as-cast [Figs. 1(a) and 1(b)] and powdered [Figs. 1(c) and 1(d)] forms for samples without and with Na, respectively. In these micrographs, the dominant white blocks are primary Mg2Ni while the lamellar structure of eutectic Mg2Ni/Mg occupies the gap between the primary Mg2Ni grains. With Na doping, the Mg2Ni appears dendritic with a smooth boundary [Fig. 1(b)] in contrast to its typical faceted shape in the Na-free sample [Fig. 1(a)]. The addition of alkaline elements prior to casting of alloys is a well-established strategy to achieve a refinement of a faceted phase via the twin-plane re-entrant edge mechanism Reference Nogita, Ockert, Pierce, Greaves, Gourlay and Dahle24,Reference Lu and Hellawell28–Reference Nogita and Dahle30 in other systems. Examples include the refinement of eutectic Al–Si with Na Reference Lu and Hellawell28 or Sr modification, Reference Shamsuzzoha and Hogan29 and the hypoeutectic Mg–Ni system with Na Reference Nogita, Ockert, Pierce, Greaves, Gourlay and Dahle24,Reference Nogita and Dahle30 or Eu and Ca. Reference Nogita and Dahle30 Theoretically, the growth morphology of a phase can usually be predicted by the Jackson parameter β = ΔS f/R where ∆S f is the melting entropy and R is the gas constant. Reference Kurz and Fisher31 In the Mg–Ni system, β is calculated as 1.9 for the Mg2Ni and this value is very close to the threshold value β = 2.30 Therefore, it is expected that a small change in the alloy's composition with Na doping can significantly affect the morphology of Mg2Ni as seen in Fig. 1. In addition, based on a statistical estimation, it is estimated that Na doping results in a two-fold increase of the interphase boundary density (primary Mg2Ni/eutectic structure) as shown in Table II. Detailed calculations can be found in Appendix B.
SEM images of as-cast samples (a) without Na, (b) with Na; and powdered samples (c) without Na, (d) with Na.

A summary of the measured densities for interphase boundary (primary Mg2Ni/eutectic structure).

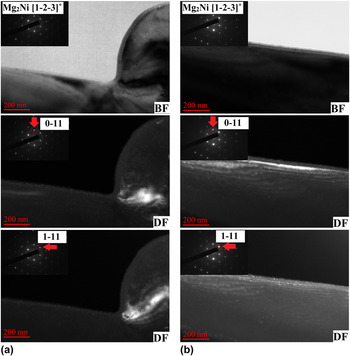
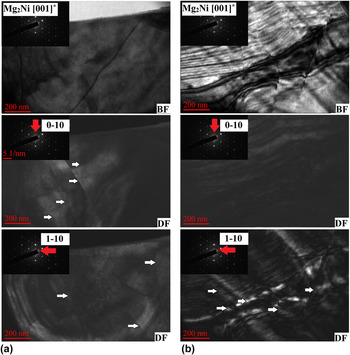
Further TEM characterization in both bright field (BF) and dark field (DF) modes of the primary Mg2Ni grains without and with Na are shown in Figs. 2 and 3, respectively. This aims to characterize the presence of any crystallographic defects/features associated with Na doping. For each alloy, different locations on the same sample are randomly examined. The zone axes used for observation are Mg2Ni [1−2−3]* and Mg2Ni [001]* for the sample without and with Na, respectively. In Na-doped Mg2Ni, there are dislocations with spacing of about 200 nm whereas no such distinct features are observed as for the case of Na-free Mg2Ni in the inspected regions. To avoid a condition of dislocation invisibility (e.g.,
 $\overrightarrow g \cdot \overrightarrow b = 0$
where
 $\overrightarrow g$
is the reciprocal lattice vector and
 $\overrightarrow b$
is the Burgers vector of dislocation), multiple different diffraction spots
 $\left( {\overrightarrow g } \right)$
were used to obtain the DF images (e.g., Mg2Ni
 $\overrightarrow g = 0-11$
and 1–11 for the Na-free sample in Fig. 2 and Mg2Ni
 $\overrightarrow g = 0-10$
and 1–10 for the Na-doped sample in Fig. 3). Although TEM images only show local areas and may not necessarily represent the entire bulk material; other evidence of Na-induced lattice expansion based on XRD analysis supports a higher density of dislocations and is anticipated for the sample with Na doping. These results will be discussed in the following sections.
TEM characterisation of Mg2Ni phase in both BF and DF modes for the Na-free sample at two different locations (a) and (b).

TEM characterisation of Mg2Ni phase in both BF and DF modes showing dislocations (white arrows) for the Na-doped sample at two different locations (a) and (b).

B. Surface analysis (XPS)
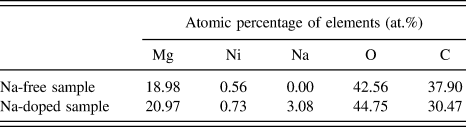
Table III shows the surface composition obtained by the XPS survey scan for the studied alloys. The surface composition of Mg/Ni is approximately Mg:Ni ∼ 30:1 (Table III) and significantly larger than the stoichiometric ratio (Mg:Ni = 2:1) in the Mg2Ni intermetallic. This indicates that Mg is selectively oxidized while leaving Ni in the metallic state. As a result, the catalytic effect of Ni in favor of hydrogen molecule dissociation is still retained in Mg–Ni alloys in good agreement with other studies. Reference Schlapbach, Shaltiel and Oelhafen19 Additionally, Ni is also found in a slightly higher concentration in the Na-doped sample compared to its Na-free equivalent (0.73 and 0.56 at.%, respectively). Another notable point is the significant enrichment of Na at the surface (3.08 at.% from Table III) as compared to its average bulk concentration (0.08 wt% or 0.12 at.% of Na from Table I) in the Na-doped sample.
Surface composition of Mg–Ni alloys based on XPS survey scan analysis.

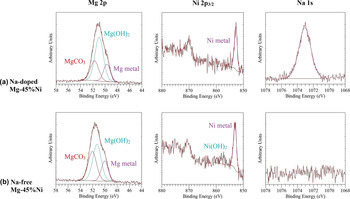
Further XPS spectra obtained using high resolution scans are presented in Fig. 4. The Mg 2p spectrum is deconvoluted into three main components including metallic Mg (49.7–50.0 eV), Mg2+ in the form of either MgO or Mg(OH)2 (51.0–51.3 eV) and Mg2+ in Mg2CO3 (51.7–52.1 eV). Reference Yao, Li and Wee32 Since the chemical shift between metallic Mg in pure metal and in Mg2Ni is less than 0.2 eV, the exact chemical state of metallic Mg cannot be easily determined. Reference Schlapbach, Shaltiel and Oelhafen19 It is notable that Mg still partially retains in a metallic state after being exposed to atmospheric conditions. The Ni 2p 3/2 spectra in the Mg–45%Ni samples (with/without Na) consists of metallic Ni in the Mg2Ni at about 852.8–853.1 eV (Ref. Reference Hillebrecht, Fuggle, Bennett, Zołnierek and Freiburg33) and a minor unidentified peak at 857.6 eV. For comparison, the closest value corresponding to Ni(OH)2 is reported at 856.5 eV. Reference Kim and Winograd34 In the Na-doped sample, Na 1s is found at about 1073.06 eV which is largely beyond the referenced values obtained for other Na-containing compounds e.g., NaHCO3 (1071.3 eV), Reference Briggs, Wanger, Riggs, Davis, Moulder and Muilenberg35 NaHCO2 (1071.1 eV), Reference Briggs, Wanger, Riggs, Davis, Moulder and Muilenberg35 NaN3 (1070.8 eV), Reference Sharma, Gora, Rimstidt and Staley36 Na (1070.8 eV) Reference Steiner, Höchst and Hüfner37 but quite close to that of NaOH (1072.59 eV). Reference Citrin38 We speculate that Na may exist in a Mg–Ni–Na co-segregation form and a Na-modified surface likely plays an important role in understanding the alloys' interaction with hydrogen.
Mg 2p, Ni 2p3/2 and Na 1s XPS spectra of as-prepared samples for (a) Na-doped Mg–45%Ni and (b) Na-free Mg–45%Ni.

C. Effect of Na on the lattice expansion of the Mg2Ni and Mg as a function of temperature
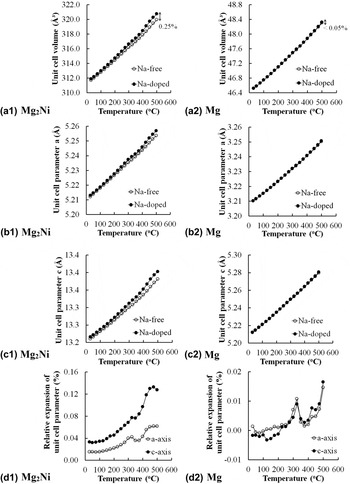
The doping of impurities in a solid usually causes an expansion/contraction of the lattice. Figure 5 demonstrates the lattice expansion phenomena as a function of temperature in the Mg2Ni and Mg phases for both samples with/without Na based on XRD analysis. At a glance, it is observed that the hexagonal Mg2Ni unit cell (space group: P
6222) expands more significantly with Na doping compared to that of hexagonal Mg (space group: P63/mmc) in terms of unit cell volume [Fig. 5(a1) and (a2)], lattice parameter a [Figure 5(b1) and (b2)] and lattice parameter c [Fig. 5(c1) and (c2)]. The behavior becomes more pronounced at elevated temperatures. For example, at 500 °C the volumetric expansion of the Mg2Ni unit cell due to Na can be up to approximately 0.25% [Fig. 5(a1)] compared to the change of less than 0.05% for Mg [Fig. 5(a2)]. This suggests that Na mainly resides within the Mg2Ni lattice in contrast to much smaller Na concentrations in the Mg phase. In addition, the Mg2Ni unit cell also exhibits anisotropic expansion due to Na doping with a greater effect along the c-axis compared to the a-axis [Fig. 5(d1)]. This is evaluated based on the relative expansion of the unit cell parameter between the sample with and without Na doping at a given temperature. For example, the percentage of relative expansion of the Mg2Ni unit cell parameter a is calculated as
 ${{{a_{{\rm{Na - doped}}\left( {{\rm{M}}{{\rm{g}}_2}{\rm{Ni}}} \right)}} - {a_{{\rm{Na - free}}\left( {{\rm{M}}{{\rm{g}}_2}{\rm{Ni}}} \right)}}} \over {{a_{{\rm{Na - free}}\left( {{\rm{M}}{{\rm{g}}_2}{\rm{Ni}}} \right)}}}} \times 100\%$
. In the case of the Mg unit cell, these values are an order of magnitude lower than that of Mg2Ni [Fig. 5(d2)]. In summary, Na doping has a significant effect on the lattice expansion properties of Mg2Ni but a much smaller effect on the Mg phase.
Lattice expansion properties as a function of temperature for (a1, a2) unit cell volume; (b1, b2) unit cell parameter a; (c1, c2), unit cell parameter c and (d1, d2) relative expansion of unit cell parameters for the Mg2Ni and Mg, respectively (the error bar is smaller than the displayed symbols).

D. First hydrogen absorption behavior of Mg–Ni alloys
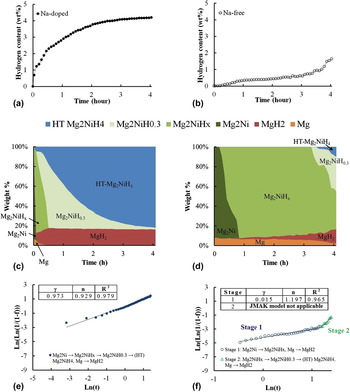
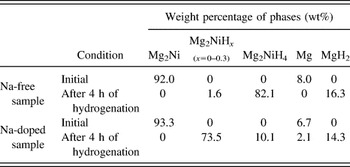
In situ synchrotron XRD is a powerful technique to observe the crystallographic phase transformation during the hydrogen absorption reaction as has been demonstrated successfully in our previous work. Reference Tran, McDonald, Gu and Nogita27 Details of the Rietveld refinement method to obtain the quantitative phase composition based on the XRD spectra of samples can be found in the reference therein for Mg–Ni alloys. Reference Tran, McDonald, Gu and Nogita27 The hydrogen absorption curves can be found in Figs. 6(a) and 6(b), where the Na-doped sample is observed to rapidly absorb hydrogen as compared to the much slower kinetics in its Na-free equivalent. It should also be noted that the starting composition is very much similar for both samples i.e., samples containing about ∼92 wt% of Mg2Ni and ∼8 wt% of Mg (or 85% of Mg2Ni and 15% of Mg by volume) (Table IV). However, their behaviors with respect to hydrogen absorption are remarkably different. Under the same time frame of 4 h, the Na-doped sample has been almost fully hydrided whereas only a small fraction of the hydride phases was observed in the sample without Na as shown in Table IV. This indicates a significant improvement of initial hydrogenation with Na doped Mg–Ni alloys as compared to other conventional alloy systems under similar conditions and time frame e.g., improved hydrogen absorption property of Mg2Ni with yttrium addition (3 MPa and 350 °C) Reference Song, Li, Zhang, Kou and Xue20 or via an isothermal evaporation casting process. Reference Hsu, Lee, Jeng and Lin39
(a, b) Hydrogen absorption curves; (c, d) evolution of constituent phases during hydrogen absorption; (e, f) evaluation of the JMAK model for Na-doped and Na-free samples, respectively (the error bar is smaller than the displayed symbols).

Phase composition for the samples with/without Na under the initial condition and after 4 h of hydrogenation.

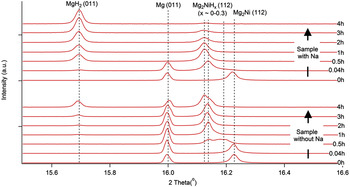
On a closer look, one can observe the evolution of hydrogen solid solution in the Mg2Ni phase [Figs. 6(c) and 6(d)]. It has been generally agreed that the stable solid solution of hydrogen within the Mg2Ni, namely Mg2NiH0.3, appears during the phase transition from Mg2Ni to high temperature (HT) Mg2NiH4. Reference Reilly and Wiswall16,Reference Zeng, Klassen, Oelerich and Bormann40 For the Na-doped sample, this stable solid solution Mg2NiH0.3 is quickly formed within the first 5 min of the reaction and followed by the appearance of (HT) Mg2NiH4 [Fig. 6(c)]. In contrast, for the Na-free sample, this process is markedly delayed for more than 3 h [Fig. 6(d)] and proceeds through a continuous range of multiple intermediate hydrogen solubilities i.e., Mg2NiH x (x ∼ 0–0.3). This is evidenced by an expansion of the Mg2Ni unit cell volume while still maintaining the same crystal structure and space group (e.g., P 6222). This corresponds to the shifting of the Mg2Ni peaks toward the low angle region as observed in Fig. 7. In particular, the Mg2NiH x (112) peaks have been located at three different positions depending on the hydrogen content and the lowest angle one seems to be the saturation point for hydrogen solubility in the Mg2Ni (Fig. 7). We believe that this corresponds to the Mg2NiH0.3 composition. In addition, the original Mg2Ni (112) peak is observed to be slightly shifted for the Na-doped alloy as compared to its Na-free counterpart. During the analysis, the XRD peaks of Mg (011) and MgH2 (011) were used as the references to distinguish the peak positions e.g., between that of Mg2Ni (112) and Mg2NiH x (112).
Peak shifting behaviour of the solid solution Mg2NiH x on a typical XRD spectrum over the course of hydrogenation for samples with/without Na as a function of time (0, 0.04, 0.5, 1, 2, 3 and 4 h).

The nucleation and growth Johnson–Mehl–Avrami–Kolmogorov (JMAK) model Reference Avrami41–Reference Avrami and Granulation43 is applied to evaluate the kinetics of hydrogenation under an isobaric–isothermal condition.
 $$f = 1 - \exp \left( { - \gamma {t^n}} \right)\quad ,$$
where γ is associated with the activation energy, n is related to the critical rate-limiting step and t is the time. γ can also be expressed in terms of the activation energy
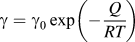 $\gamma = {\gamma _{\rm{0}}}\,\exp \left( { - {Q \over {RT}}} \right)$
(where γ0: constant, Q: activation energy, R: gas constant, and T: absolute temperature) and a larger value of γ means a lower activation energy Q. Alternatively, the model can also be presented in the following linear form:
 $\ln \left( {\ln \left( {{1 \over {1 - f}}} \right) = n\,\ln \,t + \ln \,\gamma } \right)$
. Figures 6(e) and 6(f)) show the model fitting to the observed hydrogen absorption curves and the associated values for γ, n, and R
2. In a good agreement with the mathematical fitting, the hydrogenation of Na-doped Mg–Ni alloy follows a single process of hydride nucleation, growth, and impingement
Reference Tien, Tanniru, Wu and Ebrahimi44
with a relatively low activation energy barrier (γ = 0.973). In contrast, the hydrogenation of Na-free Mg–Ni alloy can be divided into two stages (stage 1 and 2) with a much higher activation energy barriers (γ = 0.015 for stage 1). The deviation from linearity in stage 2 may indicate that the nucleation and growth model (JMAK) is no longer applicable.
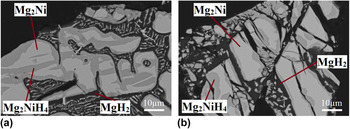
In order to gain more insights into the morphology of hydride formation, partially hydrided samples underwent the same time frame of hydrogenation for both alloys and are characterized in the SEM back scattered mode (Fig. 8). This result can support the prediction by JMAK model as described above. For Na-doped Mg–Ni alloy, the nucleation of Mg2NiH4 occurs not only on the surface but also within the Mg2Ni matrix and at certain preferable locations. The hydrides then grow and impinge with each other as seen in Fig. 8(a). In contrast, the nucleation and growth of Mg2NiH4 hydride only takes place on the surface of the primary Mg2Ni grain [Fig. 8(b)] for Na-free alloy. The early impingement of hydride limits the subsequent hydrogen diffusion through the thicken hydride layers surrounding the outer surface.
Microstructure of partially hydrided samples underwent the same timeframe for samples (a) with and (b) without Na, respectively.

E. Orientation relationship (OR) between Mg2Ni/LT (low temperature) Mg2NiH4
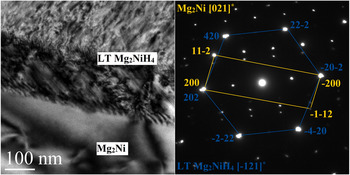
A TEM sample containing the interface between Mg2Ni and LT Mg2NiH4 was prepared from the partially hydrided Na-doped Mg2Ni using the FIB technique. Figure 9 shows the low indexed electron diffraction patterns from Mg2Ni [021]* and LT Mg2NiH4 [−121]* taken from the same selected area. Based on the overlapping diffraction spots, the crystallographic ORs between Mg2Ni and LT Mg2NiH4 has been determined as Mg2Ni (200)//LT Mg2NiH4 (202) (plane) and Mg2Ni [021]//LT Mg2NiH4 [−121]. The corresponding d-spacing values are 2.2598 and 2.2484 Å with a 0.5% difference, respectively. This represents a low strain situation facilitating the transformation from Mg2Ni into the Mg2NiH4.
A TEM BF image and selected area electron diffraction patterns at the Mg2Ni/LT Mg2NiH4 interface.

IV. DISCUSSION
Hydrogen atom tends to segregate to the neighborhood of defects, and this results in a decrease of the overall free energy. Several studies have suggested that the presence of a high defect density can be attributed to an increase of hydrogen diffusion in materials e.g., dislocations in Pd, Reference Deutges, Barth, Chen, Borchers and Kirchheim45 deformation twinning in ball-milled MgH2, Reference Danaie, Tao, Kalisvaart and Mitlin46 high angle grain boundaries in polycrystalline Ni, Reference Brass and Chanfreau47,Reference Oudriss, Creus, Bouhattate, Conforto, Berziou, Savall and Feaugas48 cracks, and grain boundaries in severely deformed TiFe Reference Edalati, Matsuda, Arita, Daio, Akiba and Horita49 and stacking faults in Mg2Ni processed by high-pressure torsion. Reference Hongo, Edalati, Arita, Matsuda, Akiba and Horita23 As shown in Fig. 6, the hydrogen diffusivity appears to increase significantly in the Na-doped Mg–Ni alloy as compared to its Na-free equivalent. This is evidenced from the rapid formation of the stable solid solution Mg2NiH0.3 in the early hydrogenation stages as well as the subsequent nucleation and growth of hydrides. To explain the observed effect, three main factors including the interphase boundary, dislocations and lattice distortions, and the chemical effect of Na will be considered.
According to Čermák et al., Reference Čermák and Král50 the hydrogen diffusion diffusivity along the interphase boundary MgH2/Mg2NiH4 is on a much greater order of magnitude as compared to lattice diffusivity (e.g., D interphase ∼ 1.5 × 10⁴ D overall). Therefore, a larger density of interphase boundary will generally result in a faster penetration of hydrogen into the bulk material. As shown in Table II, the interphase boundary (primary Mg2Ni/eutectic structure) increases by a factor of two with Na doping and this likely plays an important role in the improved hydrogen diffusivity of Na-doped Mg–Ni alloys.
In addition, other crystallographic features including dislocations (Fig. 3) or lattice distortion sites (due to Na-induced lattice expansion effect as shown in Fig. 5) also potentially serve as either hydrogen diffusion pathways or nucleation sites for hydrides. Further supporting evidence is provided by examining the formation morphology of the hydride Mg2NiH4 upon hydrogenation [Figs. 8(a) and 8(b)]. For Na-doped Mg2Ni, the nucleation and growth of Mg2NiH4 occurs at certain preferred locations and these may be associated with the dislocations or lattice distorted sites [Fig. 8(a)]. The combined effect of lattice defects and high interphase boundary density may explain the reduced activation energy barrier for the hydride nucleation and growth as suggested by the JMAK model in Figs. 6(e) and (f). In contrast, with fewer favorable diffusion pathways in Na-free alloy, the Mg2NiH4 hydride only forms on the outer surface of Mg2Ni grains and thus tends to hinder further hydrogen absorption into the bulk [Fig. 8(b)]. The transition from stage 1 into stage 2 according to the JMAK model evaluation for Na-free alloy [Fig. 6(f)] may be associated with the impingement of the near-surface Mg2NiH4 colonies. In fact, it may also indicate deviation from the nucleation and growth (JMAK) model in a later stage and a hydrogen diffusion phenomenon through the Mg2NiH4 has become dominant instead. As a result, the energy barrier for hydrogenation markedly increases because the hydrogen diffusivity in Mg2NiH4 (D ∼ 10−13 to 10−16 m2/s) Reference Čermák and Král50 is a few orders of magnitude lower than that of the Mg2NiH0.3 (D = 3.7 × 10⁻¹¹ m2/s). Reference Töpler, Buchner, Säufferer, Knorr and Prandl51
Although the introduction of crystallographic defects is naturally considered beneficial as they provide easy pathways for hydrogen diffusion, a Na-modified surface may also play a certain role in facilitating hydrogenation. It is well known that Ni acts as a catalyst for the dissociation of hydrogen molecules. Reference Reilly and Wiswall16–Reference Schlapbach, Shaltiel and Oelhafen19,Reference Jensen, Andreasen, Vegge, Andreasen, Ståhl, Pedersen, Nielsen, Molenbroek and Flemming52–Reference Friedlmeier and Groll54 In the case of Mg–Ni alloys with/without Na, Mg oxidizes preferentially while leaving Ni available in the metallic state for hydrogen dissociation. Reference Schlapbach, Shaltiel and Oelhafen19 However, the catalytic effect of Ni alone is still not sufficient for a fast kinetics of hydrogenation. With the enrichment of Na+ cation, the alloys' surface become more electropositive and thus, the hydrogen-surface metal bonding is increased towards easier hydrogen adsorption. As a result, the Na-doped Mg2Ni is rapidly saturated with its stable hydrogen solid solution Mg2NiH0.3 in the early stage of hydrogenation [Fig. 6(c)] while the process is much slower for its Na-free counterpart [Fig. 6(d)]. In an analogy to our case, owing to their highly electropositive characteristic, doping with alkaline metals (e.g., Li, K, Na, or Ba) has also been studied in other carbon-based hydrogen storage systems, Reference Chandrakumar and Ghosh55–Reference Ward, Teprovich, Compton, Schwartz, Veith and Zidan57 metal–organic frameworks, Reference Chu, Chen and Lee58 Na-decorated graphyne Reference Liu, Liu, Wang, Hao and Jiao59 and Ba-modified Ni surface. Reference Rao, Prabhakaran and Rao60
V. CONCLUSION
The effects of Na doping on the hydrogenation of bulk Mg2Ni under an isobaric–isothermal condition of 2 MPa H2 and 350 °C were investigated. In summary, the associated findings include:
-
(1) Na doping changes the solidification mechanism of Mg–Ni alloys and promotes a dendritic growth morphology of the primary Mg2Ni. As a result, a finer microstructure with a two-fold increase of the interphase Mg/Mg2Ni grain boundary becomes greatly favorable for hydrogen diffusion.
-
(2) Expansion of the unit cell and introduction of dislocations are found to be associated with Na. Furthermore, it is suggested that the synergistic effect of Ni catalyst and electropositive nature of Na+ cations present on the alloys' surface helps to increase the hydrogen–metal bonding strength facilitating improved hydrogen adsorption/dissociation.
-
(3) The hydrogenation of both Mg–Ni alloys with/without Na occurs via the nucleation, growth and impingement of hydrides. However, microstructural features and crystallographic defects/distorted lattice sites induced by Na doping influence the morphology of hydride formation. By using the JMAK model evaluation, further insights into hydrogenation mechanisms are also provided.
-
(4) The crystallographic ORs between Mg2Ni and LT Mg2NiH4 has been determined as Mg2Ni (200)//LT Mg2NiH4 (202) (plane) and Mg2Ni [021]//LT Mg2NiH4 [−121].
-
(5) Owing to the high resolution of in situ synchrotron powder x-ray diffraction data, we are able to observe the gradual transition from Mg2Ni into Mg2NiH0.3 in real-time.
It is anticipated that the current study will provide a significant impact for the development of large scale commercial hydrogen storage systems.
Supplementary Material
To view supplementary material for this article, please visit http://dx.doi.org/10.1557/jmr.2016.123.
ACKNOWLEDGMENTS
The experiment was conducted at the Australian Synchrotron on the Powder Diffraction beamline under proposal No. AS143/PD/8506. The authors would like to thank Mr. Jonathan Read, The University of Queensland (UQ) for his kind assistance with the experiment and Dr. Barry Wood, UQ for the XPS analysis. The authors acknowledge the facilities, and the scientific and technical assistance, of the Australian Microscopy & Microanalysis Research Facility at the Centre for Microscopy and Microanalysis, UQ. X.Q.T is financially supported by the University of Queensland Graduate School International Travel Award (GSITA) and Kyushu University visiting graduate research program.