Implications
The fall in dairy cows’ fertility is related, in part, to the strong genetic selection for milk production. It has been shown that several bovine Quantitative Trait Loci (QTL) affected female fertility. However, other physiological roles of these QTLs are not clearly established. As the effect of a high milk production is associated with the negative energy balance at the beginning of lactation (high needs for energy and limited postpartum feed intake), we studied several zootechnical and metabolic parameters in dairy cows carrying contrasting haplotypes at one female fertility QTL located on the BTA3, and presenting a phenotypic difference in fertility. These experiments are of particularly strong interest with the development of genomic selection.
Introduction
In dairy cows, a continuous decrease in reproductive performances has been observed (Darwash et al., Reference Darwash, Lamming and Woolliams1999; Lucy, Reference Lucy2001), simultaneously with the increase of milk production owing to genetic selection because of the negative genetic correlation evidenced between milk production traits and fertility traits (Barbat et al., Reference Barbat, Le Mézec, Ducrocq, Mattalia, Fritz, Boichard, Ponsart and Humblot2010). However, fertility is a multi-factorial trait, and other factors concerning physiology, nutrition and management of cows strongly influence reproductive efficiency. Generally, the peak in milk production occurs before the maximum dry matter intake (DMI) is reached (Ingvartsen and Andersen, Reference Ingvartsen and Andersen2000), and a genetic negative correlation between live weight and milk yield (MY) has been reported (Veerkamp et al., Reference Veerkamp, Oldenbroek, Van Der Gaast and Werf2000). Therefore, very soon after parturition, dairy cows enter into negative energy balance (NEB). It is well established that NEB reduces reproductive efficiency (Jorritsma et al., Reference Jorritsma, Wensing, Kruip, Vos and Noordhuizen2003; Butler, Reference Butler2005). After calving, body fat reserves are mobilized, and use of available nutrients for milk production is prioritized at the expense of subsequent reproductive functions (Lucy, Reference Lucy2003; Leroy et al., Reference Leroy, Vanholder, Van Knegsel, Garcia-Ispierto and Bols2008).
It is well known that nutrition and metabolic processes are linked to the reproductive process through signalling molecules and hormones (Chagas et al., Reference Chagas, Bass, Blache, Burke, Kay, Lindsay, Lucy, Martin, Meier, Rhodes, Roche, Thatcher and Webb2007). During this period of NEB, an increase in plasma concentration of non-esterified fatty acids (NEFA) and β-hydroxybutyrate (BHBA) (Ingvartsen and Andersen, Reference Ingvartsen and Andersen2000; Aeberhard et al., Reference Aeberhard, Bruckmaier and Blum2001; Busato et al., Reference Busato, Faissler, Küpfer and Blum2002) is accompanied by a decrease in plasma concentration of insulin, IGF-1 and glucose (Aeberhard et al., Reference Aeberhard, Bruckmaier and Blum2001; Accorsi et al., Reference Accorsi, Govoni, Gaiani, Pezzi, Seren and Tamanini2005). These metabolic changes are negatively correlated with reproductive traits. Ospina et al. (Reference Ospina, Nydam, Stokol and Overton2010) showed that high concentrations of both NEFA and BHBA resulted in decreased rates of conception. Cows in severe NEB had higher NEFA levels and a longer interval to first ovulation (Roche et al., Reference Roche, Mackey and Diskin2000). Oikonomou et al. (Reference Oikonomou, Arsenos, Valergakis, Tsiaras, Zygoyiannis and Banos2008) reported a negative genetic correlation between NEFA or BHBA concentration and first-service conception rate. Moreover, a positive genetic correlation between body condition score and first-service conception rate has been reported (Veerkamp et al., Reference Veerkamp, Koenen and De Jong2001; Oikonomou et al., Reference Oikonomou, Arsenos, Valergakis, Tsiaras, Zygoyiannis and Banos2008). High-merit dairy cows had delayed first ovulation and commencement of normal luteal activity compared with low-merit cows, in association with lower plasma glucose and insulin concentrations (Gutierrez et al., Reference Gutierrez, Gong, Bramley and Webb2006). Moreover, cows with a non-ovulatory dominant follicle during the first follicular wave postpartum had a lower serum concentration of IGF-1 (Beam and Butler, Reference Beam and Butler1998). These data suggest that the selection for high-yielding dairy cows has probably induced hormonal and metabolic variations, which could change nutrient partition and priority between functions, at the detriment of reproduction.
All the fertility parameters are of low heritability but show a high genetic variation. In order to identify genes involved in the declining fertility of dairy cows or causal mutations, a program of detection of quantitative trait loci (QTL) affecting economic traits was carried out in France by Boichard et al. (Reference Boichard, Grohs, Bourgeois, Cerqueira, Faugeras, Neau, Rupp, Amigues, Boscher and Leveziel2003). Various QTLs affecting female fertility (QTL-F-Fert) were detected, and one located on the BTA3 (Guillaume et al., Reference Guillaume, Gautier, Ben Jemaa, Fritz, Eggen, Boichard and Druet2007; Ben Jemaa et al., Reference Ben Jemaa, Fritz, Guillaume, Druet, Denis, Eggen and Gautier2008) was finely mapped (Druet et al., Reference Druet, Fritz, Boussaha, Ben-Jemaa, Guillaume, Derbala, Zelenika, Lechner, Charon, Boichard, Gut, Eggen and Gautier2008). This QTL was shown to affect early reproductive events (Guillaume et al., Reference Guillaume, Gautier, Ben Jemaa, Fritz, Eggen, Boichard and Druet2007) and explained 14% of the total genetic variance (Ben Jemaa et al., Reference Ben Jemaa, Fritz, Guillaume, Druet, Denis, Eggen and Gautier2008). We have recently phenotyped dairy cows selected for their haplotype at this QTL-F-Fert-BTA3 for ovarian parameters and fertility. We showed that cows carrying the supposedly unfavourable haplotype ‘fertil−’ had a lower conception rate after the first artificial insemination (AI1) than cows carrying the supposedly favourable haplotype ‘fertil+’. This was observed without differences in the length of the cycle before AI1 or the number of follicular waves (Coyral-Castel et al., Reference Coyral-Castel, Ramé, Monniaux, Fréret, Fabre-Nys, Fritz, Monget, Dupont and Dupont2011).
As fertility parameters could be affected by energy balance and metabolic changes, we investigated whether the differences in fertility observed between the two haplotypes of one QTL-F-Fert-BTA3 were related to phenotypic variations in live body weight (LBW), DMI, milk yield, eating behaviour and plasma metabolites during the first lactation of ‘fertil+’ and ‘fertil−’ dairy cows.
Material and methods
Animals
The cows studied in this experiment were previously described by Coyral-Castel et al. (Reference Coyral-Castel, Ramé, Monniaux, Fréret, Fabre-Nys, Fritz, Monget, Dupont and Dupont2011). In brief, 41 homozygous Holstein cows for one QTL-F-Fert-BTA3, 23 carrying the favourable haplotype ‘fertil+’ and 18 carrying the unfavourable haplotype ‘fertil−’ were managed in loose housing and examined during their first lactation. Primiparous cows were artificially inseminated from 50 days postpartum, 12 h after heat detection with the semen of the same bull. Cows were re-inseminated until they became pregnant. For each cow, breeding value (BV) for MY, milk fat and protein content were estimated from its ancestry. Records on parents (sire and mother) were used to estimate BV of each cow. BV for MY (204.2 ± 86.7 for ‘fertil+’ v. 319.7 ± 90.3 for ‘fertil−’ cows), BV for milk fat content (−0.5 ± 0.4 for ‘fertil+’ v. −0.76 ± 0.46 for ‘fertil−’ cows) and empty body weight (EBW) at the first week postpartum (wkpp1; 531 ± 8 kg for ‘fertil+’ v. 511 ± 9 kg for ‘fertil−’ cows) were similar between ‘fertil+’ and ‘fertil−’ cows (P > 0.10), whereas BV for milk protein content (0.23 ± 0.14 for ‘fertil+’ v. −0.12 ± 0.13 for ‘fertil−’ cows) tended to be higher in ‘fertil+’ than in ‘fertil−’ cows (P = 0.086). At calving, the age of ‘fertil+’ and ‘fertil−’ cows was similar (28.28 ± 0.37 months v. 27.95 ± 0.44 months, respectively, P = 0.55).
BW, MY and feeding
After each milking, cows were automatically weighted (software RIC version RW1.7). Only the morningLBW was used for weight analyses, because the afternoon BW was more variable. As LBW is affected by digestive contents, the estimation of EBW was corrected for the digestive tract content. A change of 4.5 kg of digestive contents per kg of DMI was assumed (Rémond, Reference Rémond1988). Variation of EBW was calculated day after day: EBW of the previous day was taken as reference weight. Energy balance was calculated according to the INRA method (INRA, 2007).
All cows were milked twice daily. At the entrance of the milking parlour, the cows were identified by an electronic collar and MY of each cow was automatically recorded (software Manufeed 500 pro, vc5 version 2.011.14). Twice weekly, samples composed of 1/3 of the afternoon milking, and 2/3 of the following morning's milking were analysed to determine milk fat and protein contents (g/l). This mixing represented proportionality over the day.
Primiparous cows were fed ad libitum with two total mixed rations (TMR) according to their stage of lactation using the INRA French feeding system (INRA, 2007). The first diet, distributed from calving to the 4th month of lactation, and the second diet, distributed until the dry period, were detailed in Table S2A. DMI was determined from the intake of fresh matter and the dry matter content of each feed of the ration. A sample of corn silage was taken once a week and samples of concentrate were taken in each new delivery. The chemical composition of each feed (described in Table S2B) was determined on dried samples ground through a 0.8 mm screen. Ash was determined by incineration at 550°C for 5 h (AFNOR, 1997), and total N was determined by a Dumas method (AFNOR, 1997). The cell-wall constituents (NDF and ADF) were analysed sequentially on a Fibersac analyzer (Ankom Technology Corporation, Fairport, NY, USA), according to the method of Van Soest et al. (Reference Van Soest, Robertson and Lewis1991), with α-amylase but without sodium sulfite in the neutral detergent solution, and were corrected for residual ash. The cellulase digestibility was determined according to the procedure of Aufrère and Michalet-Doreau (Reference Aufrère and Michalet-Doreau1988). Fat content was measured by ether extraction. The dry matter (DM) content of corn silages was corrected for losses of volatile products (volatile fatty acids, alcohol and NH4+). The feeding values of the different feeds were calculated using chemical composition according to the methods defined in INRA feeding systems (INRA, 2007). Energy balance corresponds to the difference between energy needs for body maintenance, pregnancy and lactation, and energy intake.
Eating behaviour
The TMR was distributed twice daily, at ∼0900 h and 1500 h, and each cow had access to several defined feeders (Insentec B.V., Marknesse, The Netherlands). On average, there was one feeder for two cows. When a cow arrived in front of the feeder, it was recognized by a unique passive transponder attached to her ear tag. If the cow was allowed, the feeder opened and the quantity of food eaten by the cow was automatically recorded (software RIC version RW1.7). The time of opening and closing of the feeder was also recorded, allowing the determination of the number of visits to the feeder, the time spent at the feeder, the eating rate, the duration of each visit and the intake per visit. About 10 incomplete days (<20 h of recording) and visits with no intake (0 g/visit) were excluded from the analyses.
Plasma metabolites and hormones assays
Blood samples were taken from the tail before diet distribution, once weekly from 4 weeks before calving until 4 months after calving. Plasmas were stored at −20°C until assay. NEFA and glucose were determined by enzymatic colorimetry on a multiparameter analyser (KONE instruments corporation, Espoo, Finland). Plasma insulin was measured by RIA from 100 μl of undiluted plasma as previously described (Salazar-Ortiz et al., Reference Salazar-Ortiz, Camous, Briant, Lardic, Chesneau and Guillaume2011). All samples were analysed in a unique assay and the coefficient of variation for a sample at 1.25 ng/ml was 6%.
Statistical analyses
Mean age at calving, mean EBW at the first wkpp and mean BVs for milk production and protein/fat content were compared between haplotypes with a Student T-test (TTEST procedure of the SAS software; SAS Institute Inc., 2009). Results are presented as means ± s.e. Data for zootechnical parameters (BW, milk yield, food intake, energy balance and eating behaviour) were available from the 1st to the 40th wkpp. Data for plasma concentrations of NEFA, glucose and insulin were available from 4 weeks before calving to the 16th wkpp. All these data were analysed using a linear mixed model, with the MIXED procedure of the SAS software (SAS Institute Inc., 2009) for repeated measurements. The model included the fixed effects of haplotype, week postpartum or peripartum and the interaction between haplotype and week postpartum or peripartum. A repeated effect of time (week postpartum or peripartum) within animals was taken into account with an AR(1) covariance structure (repeated statement of the MIXED procedure). For analyses of DMI, MY, milk fat and protein contents, two covariates, EBW wkpp1 and BV, were also included in the model. Least square means (lsmeans) estimated by the model were subsequently compared between haplotypes at each week postpartum or peripartum with a Student T-test (lsmeans statement of the MIXED procedure). Results are presented in graphs as lsmeans ± s.e.
Results
BW, MY and food intake
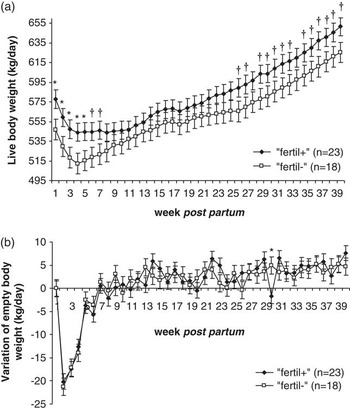
At the beginning of lactation, ‘fertil+’ cows were significantly heavier than ‘fertil−’ primiparous cows (Figure 1a), whereas BWs 1 week before calving and BWs of calves were not significantly different (data not shown). LBW of ‘fertil+’ cows tended to be higher in the last third of lactation (Figure 1a). However, variation in EBW was similar for the two haplotypes in the whole lactation (Figure 1b, Table 1).
Changes in (a) live BW and (b) variation in empty BW of ‘fertil+’ ( $$\[--><$>\blacklozenge$$$) and ‘fertil−’ (□) primiparous cows between week postpartum 1 and week postpartum 40. No covariates were taken into account for statistical analyses. Results are presented as lsmeans ± s.e. †P < 0.10, *P < 0.05.

Zootechnical and nutritional parameters for the two haplotypes

lsmeans = least square means; wkpp = week postpartum; LBW = live body weight; EBW = empty body weight; MY = milk yield; BV = breeding value; FC = fat content; PC = protein content; DMI = dry matter intake.
Results are presented as lsmeans.
P-values of the effects of haplotype, wkpp, interaction between haplotype and wkpp, covariates included in the mixed model for each studied parameter.
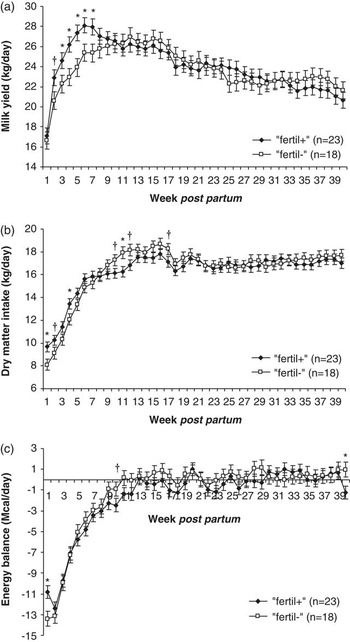
We also observed in early lactation that the MY was significantly higher in ‘fertil+’ as compared with ‘fertil−’ cows, using EBW wkpp1 and BV for milk as significant covariates (Figure 2a, Table 1). However, the length of the lactation and the 305-day MY were similar between ‘fertil+’ and ‘fertil−’ cows (respectively, 311.61 ± 7.19 days v. 330.05 ± 11.37 days, P > 0.10 and 7112 ± 257.5 kg v. 7169.1 ± 227.6 kg, P > 0.10). Milk fat content was significantly higher for ‘fertil−’ than ‘fertil+’ cows during the first lactation (Table 1), whereas milk protein content was similar for the two haplotypes throughout the lactation, with respectively BV for milk fat content (P < 0.01) and protein content (P < 0.01), and EBW wkpp1 (P < 0.05 for fat content but P > 0.10 for protein content) used as covariates in statistical analysis (Table 1).
Changes in (a) milk yield (MY), (b) dry matter intake (DMI) and (c) energy balance of ‘fertil+’ ( $$\[--><$>\blacklozenge$$$) and ‘fertil−’ (□) primiparous cows between week postpartum 1 and week postpartum 40. Empty BW of week postpartum 1 and breeding value (BV) for milk were used as covariates for MY and DMI. Results are presented as lsmeans ± s.e. †P < 0.10, *P < 0.05.

Finally, DMI seemed to be slightly higher in ‘fertil+’ than in ‘fertil−’ cows in the beginning of lactation (wkpp1 and wkpp4 P < 0.05, wkpp2 P < 0.10), with EBW wkpp1 and BV for milk used as significant covariates in statistical analyses (Figure 2b, Table 1). Around the 9th wkpp, this trend reversed and the DMI of ‘fertil−’ cows became higher than that of ‘fertil+’ for 3 weeks (wkpp10 and wkpp12 P < 0.10 and wkpp11 P < 0.05, Figure 2b). Energy balance was similar for the two haplotypes over the whole lactation, except in the first wkpp when it was more negative for ‘fertil−’ than for ‘fertil+’ primiparous cows (Figure 2c, Table 1).
Eating behaviour
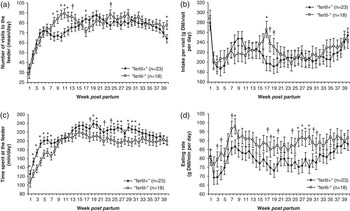
The number of visits to the feeder per day was similar between the two haplotypes, averaged over the lactation (Table 1), but it was higher for ‘fertil−’ cows between wkpp8 and wkpp13 (Figure 3a). However, intake per visit was similar for the two haplotypes except in wkpp17, wkpp18 and wkpp19 (Figure 3b), using EBW wkpp1 (P < 0.01) and BV for milk (P > 0.10) as covariates (Table 1). The time spent at the feeder was longer in ‘fertil+’ than in ‘fertil−’ cows over the whole lactation (Figure 3c, Table 1), and particularly at the beginning of lactation (from wkpp1 to wkpp7) and in the second half of the lactation (from wkpp18 to wkpp32). Eating rate was higher in ‘fertil−’ than in ‘fertil+’ primiparous cows during the whole lactation (Table 1, Figure 3d).
Eating behaviour of ‘fertil+’ ( $$\[--><$>\blacklozenge$$$) and ‘fertil−’ (□) primiparous cows between week postpartum 1 and the week postpartum 40. (a) number of visits to the feeder per day, (b) intake per visit, (c) time spent at the feeder per day and (d) eating rate. No covariates were taken into account for statistical analyses, except for dry matter intake (DMI) per visit where empty BW week postpartum 1 and breeding value for milk were taken as covariates. Results are presented as lsmeans ± s.e. †P < 0.10, *P < 0.05.

Plasma concentrations of metabolites and insulin
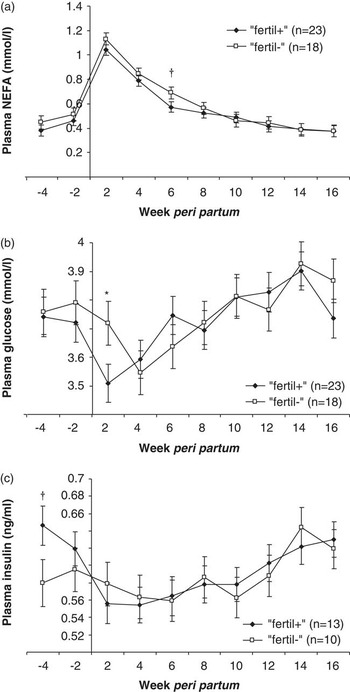
Plasma concentration of NEFA (Figure 4a) was significantly increased after calving (i.e. between 2 weeks before calving and wkpp2) in the two haplotypes. Plasma concentration of NEFA was similar for the two haplotypes, from 4 weeks before calving to wkpp16, except in wkpp6 when it tended to be higher in ‘fertil−’ than in ‘fertil+’ primiparous cows (P = 0.083). Plasma concentration of glucose (Figure 4b) was significantly lower in ‘fertil+’ than in ‘fertil−’ cows in wkpp2. We observed a significant decrease in glucose concentration between 2 weeks before calving and wkpp2 for ‘fertil+’ and wkpp4 for ‘fertil−’ cows. Finally, plasma insulin concentration (Figure 4c) was significantly higher in ‘fertil+’ than in ‘fertil−’ primiparous cows in the 4th week before calving. Then, this concentration was similar between the two groups from 2 weeks before calving to wkpp16. We observed a significant decrease in insulin concentration between 2 weeks before calving and wkpp2 to wkpp6 in ‘fertil+’ primiparous cows.
Plasma concentrations of (a) non-esterified fatty acids (NEFA), (b) glucose and (c) insulin of ‘fertil+’ ( $$\[--><$>\blacklozenge$$$) and ‘fertil−’ (□) primiparous cows from 4 weeks before calving to week postpartum 16. No covariates were taken into account for statistical analyses. Blood samples were collected weekly before the morning diet distribution. †P < 0.10, *P < 0.05. Results are presented as lsmeans ± s.e.

Discussion
The aim of the present study was to phenotype a small group of dairy cows selected for their haplotype ‘fertil+’ or ‘fertil−’ at one QTL located on the BTA3 and affecting female fertility for performance, eating behaviour and plasma metabolites during their first lactation. This work aimed to determine whether the difference of fertility between ‘fertil+’ and ‘fertil−’ animals was due to changes in energy balance. These ‘fertil+’ and ‘fertil−’ cows had been previously characterized for ovarian parameters by Coyral-Castel et al. (Reference Coyral-Castel, Ramé, Monniaux, Fréret, Fabre-Nys, Fritz, Monget, Dupont and Dupont2011). Postpartum anovulation was significantly longer in ‘fertil−’ than in ‘fertil+’ primiparous cows (29.28 ± 3.46 days v. 20.71 ± 1.27 days, respectively, P = 0.02; Coyral-Castel et al., Reference Coyral-Castel, Ramé, Monniaux, Fréret, Fabre-Nys, Fritz, Monget, Dupont and Dupont2011). Moreover, ‘fertil+’ presented a significantly higher pregnancy rate 35 days after the first AI than ‘fertil−’ primiparous cows (70% v. 39%, respectively, P = 0.05), and the same tendency was observed at 90 days after AI1 (65% v. 39%, respectively, P = 0.09; Coyral-Castel et al., Reference Coyral-Castel, Ramé, Monniaux, Fréret, Fabre-Nys, Fritz, Monget, Dupont and Dupont2011). As the number of cows is quite low, our work leads to more questions than affirmative answers. In the present study, we observed that LBW and MY were significantly higher in ‘fertil+’ primiparous cows than in ‘fertil−’ cows at the beginning of lactation. Energy balance and DMI were significantly higher in ‘fertil+’ cows than in ‘fertil−’ cows in the first week after calving. When DMI of ‘fertil−’ became higher than ‘fertil+’ cows, MY was similar for the two haplotypes. Cows resumed BW by about wkpp7 while they were still in NEB, and when energy balance became positive, it remained close to zero. The profile of variation of EBW was consistent with energy balance as suggested by the good relationship between energy balance and EBW change (‘fertil+’ R 2 = 0.86 and ‘fertil−’ R 2 = 0.89).
In the past few decades, infertility has often been linked to the increasing MY of high-producing dairy cattle. In our study, we found that ‘fertil+’ animals had a better fertility but had a higher MY increase in the beginning of lactation. MY and reproductive efficiency are not well correlated genetically (Pryce et al., Reference Pryce, Royal, Garnsworthy and Mao2004), and it is difficult to determine which mechanisms are related to the effect of milk production on fertility. In the literature, the data are controversial. Espe (Reference Espe1946) reported that lactation tends to suppress the normal functioning of the bovine ovary, whereas Clapp (Reference Clapp1937) and Dickinson (Reference Dickinson1942) believe that high production may inhibit the estrous cycle rather than prevent conception following mating. However, in more recent studies, it has been possible in extensive studies to link high milk production in individual cows to high fertility (Lucy, Reference Lucy2001; López-Gatius et al., Reference López-Gatius, García-Ispierto, Santolaria, Yániz, Nogareda and López-Béjar2006). However, the mechanisms that are related to the effect of milk production on fertility are unclear.
In the present study, we showed that ‘fertil+’ primiparous cows ate significantly more slowly and spent significantly more time at the feeder than ‘fertil−’ cows on the 40 weeks of lactation, with a similar number of visits to the feeder and intakes per visit. Globally, eating rate and time spent at the feeder were in agreement with those reported by Friggens et al. (Reference Friggens, Nielsen, Kyriazakis, Tolkamp and Emmans1998) in multiparous Holstein-Friesian cows with a low-concentrate total mixed diet. However, the number of visits was higher in our study than in that of Friggens et al. (Reference Friggens, Nielsen, Kyriazakis, Tolkamp and Emmans1998), probably because of a lower duration of visits to the feeder in our experiment (data not shown). However, visit characteristics depend on a large number of factors, such as the place of a cow in the social hierarchy of the group (Tolkamp et al, Reference Tolkamp, Schweitzer and Kyriazakis2000). With the computerized feeders used in Tolkamp et al. (Reference Tolkamp, Schweitzer and Kyriazakis2000), as in our experiment, the daily number and average size of short feeding bouts that were recorded were very sensitive to changes in experimental conditions. These authors concluded that meals are a more biologically relevant unit for the analysis of short-term feeding behaviour than visits. Therefore, the differences we observed in traits associated with visits may disappear if the same analysis was performed on the basis of meals. Recent studies showed that eating rate was affected by animal characteristics such as parity (Azizi et al., Reference Azizi, Kaufmann and Hasselmann2009 and Reference Azizi, Hasselmann and Kaufmann2010), MY level (Azizi et al., Reference Azizi, Kaufmann and Hasselmann2009), lactation stage (Abrahamse et al., Reference Abrahamse, Vlaeminck, Tamminga and Dijkstra2008; Azizi et al., Reference Azizi, Hasselmann and Kaufmann2010) and diet composition (Baumont, Reference Baumont1996; Friggens et al., Reference Friggens, Nielsen, Kyriazakis, Tolkamp and Emmans1998; Abrahamse et al., Reference Abrahamse, Vlaeminck, Tamminga and Dijkstra2008). Thus, in our study, we observed that eating rate could be affected by the haplotype at one QTL-F-Fert-BTA3. We also observed, as expected, mainly for ‘fertil+’ cows, that eating rate was dependent on DMI and LBW. Differences in eating rate between the two haplotypes were not related to other phenotypic characteristics and could probably be because of the haplotypes at the studied QTL-F-Fert-BTA3. Indeed, in this QTL, some genes coding for olfactory receptors are present. We can hypothesize that these genes are differently regulated in ‘fertil+’ and ‘fertil−’ cows and could contribute to explain the difference in eating rate by affecting selection activity or directly the control of eating behaviour.
As expected (Ingvartsen and Andersen, Reference Ingvartsen and Andersen2000), we observed in our two haplotypes an increase in plasma NEFA levels after calving, with no differences between ‘fertil+’ and ‘fertil−’ cows. Plasma NEFA tended to be lower in ‘fertil+’ than in ‘fertil−’ cows in wkpp6, during which MY of ‘fertil+’ cows was the highest. Thus, we cannot affirm that there was no difference of mobilization of fat reserves between the two groups, but these differences are probably too small to explain the difference observed for fertility parameters. Plasma glucose decreases after calving (Ingvartsen and Andersen, Reference Ingvartsen and Andersen2000) because it is used for milk production. This decrease was observed in our study but was delayed by about 2 weeks in ‘fertil−’ compared with ‘fertil+’ primiparous cows. Moreover, ‘fertil+’ cows’ plasma glucose concentration was lower in wkpp2 than in ‘fertil−’ cows, and MY was higher and increased more rapidly in ‘fertil+’ than in ‘fertil−’ cows. These results suggest that ‘fertil+’ primiparous cows have lower plasma glucose, probably because MY increases are greater in this haplotype than in ‘fertil−’ animals. At the same time, we observed a decrease in plasma insulin concentration in ‘fertil+’ but not in ‘fertil−’ primiparous cows. However, these differences are the reverse of what would explain the better reproductive performance of ‘fertil+’ cows. Indeed, it is well known that insulin can influence dairy cow fertility by interacting with reproductive hormones that control ovarian function and reproductive events (Butler, Reference Butler2003; Webb et al., Reference Webb, Garnsworthy, Gong and Armstrong2004; Garnsworthy et al., Reference Garnsworthy, Sinclair and Webb2008). In previous studies, it has been shown that high plasma insulin is associated with earlier resumption of postpartum estrous cycles but have detrimental effects on oocyte developmental competence (Garnsworthy et al., Reference Garnsworthy, Sinclair and Webb2008). In ‘fertil−’ cows, plasma insulin was stable after calving, whereas plasma glucose decreased, with a delay compared with ‘fertil+’ cows. We can also hypothesize that ‘fertil−’ cows have a different sensitivity to insulin compared with ‘fertil+’ primiparous cows. To check this hypothesis, we could perform glucose and insulin tolerance tests in our two haplotypes. Indeed, these tests allow the determination of glucose-stimulated insulin increase and insulin-induced glucose decline (Kerestes et al., Reference Kerestes, Faigl, Kulcsár, Balogh, Földi, Fébel, Chilliard and Huszenicza2009). These tests consist of an intravenous perfusion of a standard dose of glucose followed by an injection of insulin in fasted animals (Kerestes et al., Reference Kerestes, Faigl, Kulcsár, Balogh, Földi, Fébel, Chilliard and Huszenicza2009).
We observed that the energy balance is different between the two haplotypes only 1 week after calving. It is unlikely that this difference can explain the difference of fertility at first service between the two haplotypes. In a previous study, we have shown that the quality of oocytes could be different between the two haplotypes (Coyral-Castel et al., Reference Coyral-Castel, Brisard, Touze, Dupont, Ramé, Uzbekova and Dupont2012). This difference could be due to differences in the gonadotropin secretions that we have not yet investigated. Another possible explanation for this difference in fertility is linked to the change in body composition (without affecting energy balance, the EBW). Although the plasma concentration of NEFA is not significantly different between the two haplotypes, the mean plasma NEFA in ‘fertil−’ is slightly above that measured for ‘fertil+’ animals during the period from 4 weeks before calving to 8 wkpp. Some evidence showed that several molecules produced by the adipose tissue called adipokines could affect reproductive functions. Some laboratory studies have shown a difference of expression of ADIPOR2, one receptor for one of these adipokines, in the adipose tissue of ‘fertil+’ and ‘fertil−’ animals 2 weeks after calving (Elis et al., submitted), suggesting that the adipokines could help explain some fertility differences between the two haplotypes.
To conclude, by investigating zootechnical and reproductive performances, eating behaviour and metabolic profiles, we were able to phenotype a small group of cows carrying ‘fertil+’ or ‘fertil−’ haplotype at one QTL-F-Fert-BTA3. We have previously shown that these cows had a phenotypic difference in fertility: in the present work, we observed that they also presented some differences for MY and BW in early lactation, for energy balance in the first week of lactation, and in eating rate and time spent at the feeder. However, according to the present metabolic data, it is unlikely that the difference of fertility between ‘fertil+’ and ‘fertil−’ animals is because of some difference in energy balance. For the moment, it is very difficult to explain the lower fertility in ‘fertil−’ dairy cows compared with ‘fertil+’ cows.
Acknowledgements
The authors thank the ANR Genanimal and Apis-Gene for financial support for the project. They also thank the staff of the Experimental Unit UEPAO at the INRA Nouzilly, Eric Briant, Mickael Dupont, Mickael Delanoue, Ludovic Métivier and Christophe Mouaze, for animal management and their involvement in the experiment. The authors also acknowledge Sébastien Elis at the INRA Nouzilly for his help, Thibaud Le Mouël, Marie Le Tilly and Colette Mustière at the INRA Rennes for NEFA and glucose assays. S. Coyral-Castel is a PhD student supported by the ‘Institut de l'Elevage’ and the ‘Association Nationale de la Recherche et de la Technologie’.
Supplementary material
For supplementary material referred to in this article, please visit http://dx.doi.org/doi:10.1017/S1751731112002133