Racial discrimination is harmful. It is defined as unfair, differential treatment based on one's race. From adolescence to adulthood, there is consistent evidence that greater experiences of racial discrimination are detrimental to psychological, physical, and social adjustment (for reviews see Benner et al., Reference Benner, Wang, Shen, Boyle, Polk and Cheng2018; Lee & Ahn, Reference Lee and Ahn2011; Pascoe & Richman, Reference Pascoe and Richman2009; Umaña-Taylor, Reference Umaña-Taylor2016). More specifically, Asian-heritage adolescents in North America who report experiencing racial discrimination also report greater anxiety, somatization, depressive symptoms, and lower self-esteem (Benner & Graham, Reference Benner and Graham2013; Benner & Kim, Reference Benner and Kim2009b; Greene, Way, & Pahl, Reference Greene, Way and Pahl2006; Juang & Alvarez, Reference Juang and Alvarez2010; Juang & Cookston, Reference Juang and Cookston2009; Larochette, Murphy, & Craig, Reference Larochette, Murphy and Craig2010; Oxman-Martinez et al., Reference Oxman-Martinez, Rummens, Moreau, Choi, Beiser, Ogilvie and Armstrong2012; Rivas-Drake, Hughes, & Way, Reference Rivas-Drake, Hughes and Way2009; Rosenbloom & Way, Reference Rosenbloom and Way2004; Sangalang & Gee, Reference Sangalang and Gee2015; Seol, Yoo, Lee, Kyeong, & Park, Reference Seol, Yoo, Lee, Park and Kyeong2016). Nonetheless, what we know about racial discrimination and adjustment is still heavily weighted and based on research on adult samples (e.g., Schmitt, Branscombe, Postmes, & Garcia, Reference Schmitt, Branscombe, Postmes and Garcia2014). In addition, the developmental correlates of discrimination at various ages are not yet known, including whether racial discrimination experiences are more detrimental to psychological well-being at one age versus another. Thus, we explored whether the association between discriminationFootnote 1 and adjustment varied across age, from early to late adolescence among Chinese-heritage youth in the United States and Canada.
Discrimination is a central feature of ethnic minority and immigrant adolescents’ experiences around the world. From the acculturation literature, Berry, Phinney, Sam, and Vedder's (Reference Berry, Phinney, Sam and Vedder2006) large-scale, cross-national study of immigrant adolescents from 13 countries showed that discrimination based on ethnicity was by far the strongest predictor of adjustment. Greater discrimination related to poorer psychological (e.g., life satisfaction, self-esteem, and psychological distress) and sociocultural (e.g., school adjustment and behavior problems) adaptation. From this lens, discrimination is a pervasive type of acculturation stressor that potentially leads to poorer adjustment. Many children and adolescents of Asian-heritage families in the United States and Canada are either immigrants themselves or have parents who are immigrants. For instance, 85% of Asian-heritage children under 18 in the United States are immigrants themselves or have at least one parent who is an immigrant (Passel, Reference Passel2011). In Canada, 47% of Asian-heritage 0- to 14-year-olds and 46.5% of 15- to 34-year-olds are immigrants themselves or have at least one parent who is an immigrant (Statistics Canada, 2017b). Thus, issues of immigration and acculturation stressors are relevant for our population of focus.
From the developmental science literature, García Coll et al.’s (Reference García Coll, Crnic, Lamberty, Wasik, Jenkins, Garcia and McAdoo1996) integrative developmental model argues that it is impossible to understand the development of minority children and adolescents without acknowledging how social position variables (e.g., race, ethnicity, class, and gender) contribute to their development. Because Chinese-heritage adolescents in North America occupy the social position of being ethnic minorities in a socially stratified inequitable society, they are exposed to social mechanisms such as interpersonal, institutional, and systemic racial discrimination. Attention to these experiences and how they may be detrimental to development provides a knowledge base for intervention and prevention efforts to reduce risk for poorer mental health outcomes.
The life-course literature argues that it is important to understand the negative effects of racial discrimination at different developmental periods across the life span as individuals move through age-patterned transitions where the changing contexts may expose individuals to different sources, types, and intensities of discrimination (Gee, Walsemann, & Brondolo, Reference Gee, Walsemann and Brondolo2012). Thus, contexts afforded during early adolescence are different from later adolescence, which have implications for adjustment, for better or worse. Taken together, acculturation, developmental, and life-course literature suggest that attention to discrimination across a broad age period provides important developmental information regarding the mental health and well-being for Chinese-heritage adolescents of immigrant families in North America.
Of note, these various strands of literature converge to support a cultural development and psychopathology view of adolescent health and well-being (Causadias, Reference Causadias2013). For instance, in this study we integrate culture, development, and psychopathology and view culture as not simply an environment or context (see Causadias, Reference Causadias2013) but rather as deeply intertwined with the discrimination–adjustment age-related patterns of change. We therefore study multiple levels of analyses (Cicchetti & Dawson, Reference Cicchetti and Dawson2002), from the individual (age, gender, and generational status) to the social level (discrimination experiences) to the country level (United States and Canada). We are interested in the processes that contribute to age-related patterns of adolescent functioning in relation to experiences of discrimination specifically. The multilevel integration of cultural risk (e.g., race-based discrimination) and consideration of maladaptive (depressive symptoms) and adaptive (self-esteem) functioning (Sroufe, Reference Sroufe1990) fits well into the recent push to more deeply consider and fuse culture into the study of developmental psychopathology (Causadias, Reference Causadias2013).
Chinese-Heritage Population in North America: Discrimination and Adjustment
In both the United States and Canada, Asians of Chinese descent make up the largest ethnic group of Asian heritage. In the United States there are 4.9 million Chinese Americans (US Bureau of the Census, 2015) and in Canada there are 1.7 million Chinese Canadians (Statistics Canada, 2017a). Historically, the Chinese-heritage community has experienced discrimination from the early years of immigration. For instance, they are the only group in US history to have been excluded for immigration based on their ethnic background (Chinese Exclusion Act, 1882). The Chinese were also excluded from immigrating to Canada between 1923 and 1947, following almost 40 years of a discriminatory head tax and policies of segregation (Holland, Reference Holland2007). Although such explicit and formal discriminatory practices have been dismantled, contemporary evidence suggests that discrimination is still a part of life for Chinese-heritage individuals from adolescence through adulthood in both the United States and Canada (Benner et al., Reference Benner, Wang, Shen, Boyle, Polk and Cheng2018; Costigan, Hua, & Su, Reference Costigan, Hua and Su2010; Goto, Gee, & Takeuchi, Reference Goto, Gee and Takeuchi2002; Greene et al., Reference Greene, Way and Pahl2006; Guo, Reference Guo2013; Juang & Alvarez, Reference Juang and Alvarez2010; Li, Reference Li2009; Yip, Gee, & Takeuchi, Reference Yip, Gee and Takeuchi2008).
There is strong and consistent evidence that racial discrimination is a risk factor that is linked to an array of negative adjustment indicators for ethnic minority adolescents and adults to old age (Benner & Kim, Reference Benner and Kim2009; Schmitt et al., Reference Schmitt, Branscombe, Postmes and Garcia2014; Yip et al., Reference Yip, Gee and Takeuchi2008). A recent meta-analysis of 214 studies that focused on racially and ethnically diverse adolescents found that racial and ethnic discrimination is hurtful to how adolescents feel (i.e., depression, other internalizing symptoms, self-esteem, and positive well-being), how they do in school (i.e., achievement, engagement, and motivation), and how they behave (i.e., externalizing behaviors, substance use, deviant peer associations, and risky sex behaviors; Benner et al., Reference Benner, Wang, Shen, Boyle, Polk and Cheng2018).
Our study focused on depressive symptoms and self-esteem as indicators of mental health and well-being. Depression is among the most important mental health concerns for Asian American youth. Studies of Asian Americans that have included Chinese-heritage youth show that, compared to European American youth, Asian Americans report more depressive symptoms and higher levels of psychological distress (Ho, Moss, & Yeh, Reference Ho, Moss, Yeh, Benuto, Thaler and Leany2014; Kalibatseva, Leong, Ham, Lannert, & Chen, Reference Kalibatseva, Leong, Ham, Lannert and Chen2017). Experiences of discrimination may contribute to this distress. Greene et al.’s (Reference Greene, Way and Pahl2006) longitudinal study that included Chinese American adolescents found that peer discrimination was associated with increases in depressive symptoms over time. Benner et al.’s (Reference Benner, Wang, Shen, Boyle, Polk and Cheng2018) meta-analysis found that racial and ethnic discrimination was more strongly linked to socioemotional distress with samples that included higher percentages of Asian- or Latino-heritage adolescents. Asian-heritage adolescents, then, may be particularly at risk for the negative effects of discrimination and especially regarding depressive symptoms and self-esteem.
Age-Related Changes in the Link Between Racial Discrimination and Adjustment Across Adolescence
Although the link between discrimination and poorer adjustment is well documented, we know much less about how the consequences associated with discrimination might vary across the adolescent developmental period for Chinese-heritage individuals. Discrimination might be more tightly linked to adjustment during earlier adolescence as this developmental period has been identified as a particularly challenging time due to neural, physical, cognitive, emotional, social, and contextual transitions that are relevant for adolescents in general (Eccles et al., Reference Eccles, Midgley, Wigfield, Buchanan, Reuman, Flanagan and Mac Iver1993; Luby et al., Reference Luby, Belden, Jackson, Lessov-Schlaggar, Harms, Tillman and Barch2016; Steinberg & Morris, Reference Steinberg and Morris2001). From a cumulative risk perspective (Evans, Li, & Whipple, Reference Evans, Li and Whipple2013), experiencing multiple stressors and transitions simultaneously might tax the developing coping skills of the early adolescent and explain why, for instance, mental health issues such as depressive symptoms increase starting at the beginning of adolescence (Petersen et al., Reference Petersen, Compas, Brooks-Gunn, Stemmler, Ey and Grant1993). Thus, in early adolescence, experiencing discrimination and, at the same time dealing with puberty, changing relationships, and contextual transitions, may be especially challenging. During later adolescence, adolescents have navigated through early adolescent changes and transitions and may have developed better coping strategies. For instance, a review of the coping literature suggests that problem-solving coping and seeking support from peers increases throughout adolescence (Skinner & Zimmer-Gembeck, Reference Skinner and Zimmer-Gembeck2007). Older adolescents also may know better how to avoid racially discriminatory contexts by being more in control of where they spend their time and with whom they choose to spend their time (Smith-Bynum, Lambert, English, & Ialongo, Reference Smith-Bynum, Lambert, English and Ialongo2014). This may lessen the negative effects of discrimination as they get older. Benner et al.’s (Reference Benner, Wang, Shen, Boyle, Polk and Cheng2018) meta-analysis focusing on racially and ethnically diverse adolescents showed that the developmental period matters in terms of the effects of discrimination and adjustment. It was during early adolescence where racial/ethnic discrimination showed larger effect sizes with socioemotional distress compared to middle or late adolescence.
Nevertheless, another plausible developmental perspective on changes in the impact of discrimination across adolescence is that repeated experiences with discrimination over time can build up to have a larger additive effect (accumulation of allostatic load; Neblett, Shelton, & Sellers, Reference Neblett, Shelton, Sellers and Philogene2004), which can erode protective resources over time (Yip et al., Reference Seaton, Yip and Sellers2008). Work with African American adolescents shows that greater racial discrimination during late, but not middle adolescence, is linked to lower private regard (Seaton, Yip, & Sellers, Reference Seaton, Yip and Sellers2009). Consequently, the negative effects of discrimination may intensify from early to late adolescence. In addition, vulnerability to discrimination may be greater in later adolescence rather than early because cognitive advances in critical thinking may increase perceptions of discrimination and discriminatory treatment (Benner & Graham, Reference Benner and Graham2013; Greene et al., Reference Greene, Way and Pahl2006), exploration of ethnic identity (Quintana & McKown, Reference Quintana, McKown, Quintana and McKown2008; Umaña-Taylor, Reference Umaña-Taylor2016; Umaña-Taylor et al., Reference Umaña-Taylor, Quintana, Lee, Cross, Rivas-Drake and Schwartz2014), and awareness of societal inequity and systemic institutional racism and discrimination. This greater awareness can weigh heavy. To advance our understanding of the developmental correlates of racial discrimination, our study tested which of these contrasting developmental perspectives on the potential time-varying association between discrimination and adjustment was supported for Chinese-heritage adolescents specifically.
Gender, Nativity, and Region as Potential Moderators of Discrimination and Adjustment
We tested whether the time-varying association between discrimination and adjustment depends on three potential moderators: gender, nativity, and geographic region. Although males tend to report higher levels of discrimination than females (Larochette et al., Reference Larochette, Murphy and Craig2010; Liang et al., Reference Liang, Alvarez, Juang and Liang2006; Oxman-Martinez et al., Reference Oxman-Martinez, Rummens, Moreau, Choi, Beiser, Ogilvie and Armstrong2012), we know less about whether gender moderates the discrimination–adjustment link. Findings have been inconsistent. For instance, in the 8th grade, the correlation between classroom and peer discrimination and academic adjustment among African American adolescents was stronger for males than for females (Chavous, Rivas-Drake, Smalls, Griffin, & Cogburn, Reference Chavous, Rivas-Drake, Smalls, Griffin and Cogburn2008). At 11th grade, classroom and peer discrimination was related to various aspects of academic adjustment for both males and females. Among African American and Latinx adolescents, greater perceived discrimination predicted an increased risk for smoking for males, but a decreased risk for females (Wiehe, Aalsma, Liu, & Fortenberry, Reference Wiehe, Aalsma, Liu and Fortenberry2010). Benner et al.’s (Reference Benner, Wang, Shen, Boyle, Polk and Cheng2018) meta-analysis further reported that gender did not moderate the relation between discrimination and adjustment. However, there is still little research including Asian-heritage adolescents. Because Asian-heritage females versus Asian-heritage males navigate different stereotypes (Juang, Yoo, & Atkins, Reference Juang, Yoo, Atkin, Choi and Hahm2017; Niwa, Way, Qin, & Okazaki, Reference Niwa, Way, Okazaki, Qin, Juang, Qin, Leong and Fitzerald2011), we proposed that the arguably more negative stereotypes directed at Asian-heritage males could be more consequential especially regarding discrimination. Further, previous research has been limited to specific ages, and we were interested in gender moderation across the span of adolescence.
First-generation (immigrant) Chinese American young adults report higher levels of discrimination compared to second-generation (US-born) Chinese American young adults, possibly because they are more visible targets for discrimination (Ying, Lee, & Tsai, Reference Ying, Lee and Tsai2000). In addition to these mean-level differences, nativity may moderate links between discrimination and adjustment. One study found that although first-generation Asian-heritage and Latinx young adults perceived greater foreigner objectification, the second-generation were more hurt (in terms of lower self-esteem, lower life satisfaction, and greater depressive symptoms) by foreigner objectification, presumably because it is more distressing that they are not accepted despite being born and raised in the United States (e.g., seen as a perpetual foreigner; Armenta et al., Reference Armenta, Lee, Pituc, Jung, Park, Soto and Schwartz2013). In contrast, for an Asian-heritage US adult sample (18–75 years), nativity status did not moderate the link between discrimination and adjustment (Yip et al., Reference Yip, Gee and Takeuchi2008). Because of inconsistent findings and lack of research with adolescents, our analyses addressing how nativity may moderate the discrimination–adjustment link over time is exploratory.
In addition to individual-level moderators of gender and nativity, we also examined whether the particular geographical region may modify the discrimination–adjustment link across adolescence. A study of Filipino American adults living in San Francisco and Honolulu found that those living in San Francisco reported higher everyday discrimination compared to those living in Honolulu (Gee et al., Reference Gee, Chen, Spencer, See, Kuester, Tram and Takeuchi2006). However, everyday discrimination was related to poorer health (a composite score of 10 health conditions including high blood pressure, heart conditions, and diabetes) only in Honolulu but not in San Francisco. Filipinos living in Honolulu constitute 5% of the population, and in San Francisco, 12% of the population. Perhaps the higher density of same-ethnic members in San Francisco was protective against the negative effects of discrimination.
The two regions in the United States and Canada where we recruited participants both have a high Chinese-heritage population. Nonetheless, the broader country-level contexts differ with regard to attitudes toward immigrants. The United States has been described as a country with assimilationist immigration ideals while Canada, in contrast, adopts a more multicultural approach (Berry et al., Reference Berry, Phinney, Sam and Vedder2006). Evidence of this approach is captured by the Multicultural Policy Index (http://www.queensu.ca/mcp/), a measure of supportiveness for immigrants and other ethnic minorities by assessing country-level policies regarding, for instance, integration into the educational system and job market, anti-discrimination policies, family reunification, and paths to citizenship. This index shows that from 1990 to 2010, Canada has consistently scored higher (indicating greater supportiveness) compared to the United States. Over the years, the gap is widening as Canada continues to become more supportive for immigrants and ethnic minorities while the United States has either become less supportive or remained the same. We might expect, then, that the effects of discrimination might be more consequential in the Northern California region than in British Columbia.
The Present Study
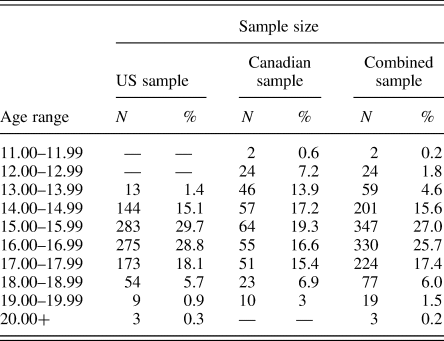
The present study used integrative data analysis, in which data from two independent samples are pooled as a single data set and analyzed as a single study (Curran & Hussong, Reference Curran and Hussong2009). This analytical approach has multiple advantages such as (a) increased statistical power (with a larger sample size), (b) increased sample heterogeneity (i.e., increased sample representation of target population), (c) extended period of developmental study, and (d) encouragement for researchers to share data and collaborate (Curran & Hussong, Reference Curran and Hussong2009; Kern, Hampson, Goldberg, & Friedman, Reference Kern, Hampson, Goldberg and Friedman2014). We integrated two longitudinal data sets of Chinese-heritage adolescents that, when combined, span an age range of 12 to 19 years old at Wave 1 (see Table 1). The data were sampled from Northern California and British Columbia, two regions with a long history of Chinese immigrants and a high density of Chinese-heritage populations. Although the two studies shared similar procedures, had some of the same self-report survey measures, and sampled from a similar population, incongruence in measurements can be a primary challenge of integrative data analysis (Curran & Hussong, Reference Curran and Hussong2009; Kern et al., Reference Kern, Hampson, Goldberg and Friedman2014). In order to ensure that the measurements were adequately congruent across the two data sets, we conducted preliminary analyses where we (a) investigated the psychometric properties of the key constructs for each data set, (b) examined measurement invariance across the two data sets, and (c) explored descriptive statistics of the integrated data set. Then, using the integrated data set, we addressed two research questions.
Research Question 1: What is the time-varying association between discrimination and depressive symptoms and self-esteem among Chinese-heritage adolescents from early adolescence to late adolescence? Because there is evidence for two developmentally plausible patterns of a stronger association in both earlier adolescence and later adolescence, we tested which of these two patterns was supported.
Research Question 2: Does the time-varying association of discrimination and adjustment differ by gender, nativity, and region when comparing cross-sectionally and across age from early to late adolescence? We expected that discrimination would be more closely related to depressive symptoms and self-esteem for males than females and for those in the United States versus Canada for any period of adolescence. Our moderation analyses for nativity are exploratory.
Sample size by age range

Method
Participants
The first data set included 316 Chinese American adolescents (57% female; 30% first generation) ranging in age from 13 to 19 (M = 15.13, SD = 0.77) at Wave 1, who were followed up annually for 2 consecutive years. The second data set included 182 Chinese Canadian adolescents (52% female; 75% first generation) ranging in age from 12 to 18 (M = 15.00, SD = 1.70) at Wave 1, who were followed up 18 months later.
Procedure
For the first data set, adolescents were recruited from two high schools in 2001, when the first author made announcements to school assemblies and after-school clubs geared toward students of Chinese background (e.g., Chinese Club and Chinese Cultural Arts Club) and by posting fliers. The first author told the students that the project focused on experiences of Chinese and Chinese American adolescents growing up in the Bay Area. Adolescents who obtained a signed guardian/parent consent form and assented to participate were surveyed. The survey was completed during classroom hours or immediately after school. Parents were not present at the time. Adolescents were told their responses were confidential and that responses would not be shared with either parents or other adolescents. Two follow-up surveys were conducted with similar procedures annually. Adolescents were compensated $15 each time for participating in the first two waves of data collection and $20 for the third wave.
For the second data set, adolescents were recruited with their parents into a larger study of family adaptation following immigration. The majority (67%) of families were recruited randomly through a survey research center that contacted individuals with Chinese surnames in two cities in British Columbia. The remaining families (33%) were primarily referred from families who had already participated. Families participated in their homes, where each family member (father, mother, and adolescent) independently completed a package of self-report measures. Two research assistants were present, at least one able to speak the family's native language. Families received small monetary compensation (CAN $50 at Wave 1 and CAN $60 at Wave 2).
For the first data set, the English version was translated into Chinese by three bilingual adults who were fluent in both English and Chinese. The translators were of differing generations and familiar with both Mandarin and Cantonese to account for variations in the Chinese language due to cohort and geographical differences. Similarly, for the second data set, English measures were translated to Chinese by a team of bilingual individuals from China, Taiwan, and Hong Kong. In order to ensure cross-language equivalency, the Chinese versions were then back-translated by another team of bilingual individuals, and the back-translated English measures were compared to the original English measures. The few discrepancies were resolved by discussion. In both data sets, the majority (over 80% in the first data set and 90% in the second) of adolescents used the English version. All study procedures and measures were approved by the principal investigators’ university institutional review boards.
Attrition analyses were conducted to compare all study variables of adolescents who participated at all waves versus those who missed at least one wave. No significant differences were found for the first or second data set with regard to demographic (e.g., gender distribution) or main study variables (i.e., discrimination, depressive symptoms, and self-esteem). For more detailed information of sample recruitment and procedures for the US sample (Juang & Cookston, Reference Juang and Cookston2009) and Canadian sample (Hua & Costigan, Reference Hua and Costigan2012; Miao, Costigan, & MacDonald, Reference Miao, Costigan and MacDonald2018), please see previous publications.
Measures
The two data sets used the same measures for discrimination and adjustment.
Racial discrimination
Adolescents’ experiences of discrimination were assessed using the Perceived Discrimination Scale (Gil & Vega, Reference Gil and Vega1996). The measure consisted of three items (e.g., “people dislike you based on race”), with the response scale ranging on a 5-point Likert scale from 1 = never to 5 = always (US questionnaire)/very often (Canada questionnaire). Scores were averaged across the three items, with higher values indicating more frequent experiences of discrimination. The scale showed good reliability (Cronbach's α for US study = 0.840 and Canada study = 0.836).
Depressive symptoms
Adolescents’ depressive symptoms were measured using the Center for Epidemiological Studies Depression Scale (CES-D; Radloff, Reference Radloff1977). The scale consisted of 20 items, including four subscales: depressed affect, positive affect, somatic symptoms, and interpersonal difficulties. Depressed affect included 7 items (e.g., “I felt depressed”); positive affect included 4 items (e.g., “I enjoyed life”); somatic symptoms included 7 items (e.g., “my sleep was restless”); and interpersonal difficulties included 2 items (e.g., “I felt people disliked me”). The response scale ranged from 1 = rarely or none of the time to 4 = most or all of the time. Item scores were averaged for each subscale, and greater values indicated higher levels of depressed affect, positive affect, somatic symptoms, and interpersonal difficulties. Scale reliability was calculated upon retaining items that functioned equivalently across the two samples (see Results section). Depressed affect showed good reliability (Cronbach's α: US study = 0.853, Canada study = 0.881); somatic symptoms showed acceptable reliability (Cronbach α: US study = 0.578, Canada study = 0.639); interitem correlations were moderate for positive affect (US study = .612, Canada study = .558) and higher for interpersonal difficulties (US study = .666, Canada study = .818).
Self-esteem
Adolescents’ self-esteem was measured using the Rosenberg's self-esteem scale (Rosenberg, Reference Rosenberg1989). The scale consisted of 10 items, among which 5 items were positively worded and constitute the positive self-esteem subscale (e.g., “I am a person of worth” and “I have a number of good qualities”), whereas 5 items were negatively worded and constitute the negative self-esteem subscale (e.g., “I am a failure” and “At times, I think I am not good at all”). Previous studies of culturally diverse adolescents within the United States and cross-culturally report that a two-factor structure is more appropriate than a one-factor structure (Farruggia, Chen, Greenberger, Dmitrieva, & Macek, Reference Farruggia, Chen, Greenberger, Dmitrieva and Macek2004; Supple, Su, Plunkett, Peterson, & Bush, Reference Supple, Su, Plunkett, Peterson and Bush2013).
Items were rated on a 4-point Likert scale ranging from 1 = strongly disagree to 4 = strongly agree. Item scores were averaged separately for positive self-esteem and negative self-esteem, such that higher values for positive self-esteem indicated a more positive self-esteem, whereas higher values for negative self-esteem indicates a more negative self-esteem. The subscales showed good reliability (Cronbach's α for US study = 0.814 and Canada study = 0.845 for positive self-esteem; Cronbach's α for US study = 0.792 and Canada study = 0.829 for negative self-esteem).
Demographic characteristics
Adolescents reported their gender, date of birth, country of birth, and parents’ highest levels of educational attainment at Wave 1. Gender was coded as 0 = male and 1 = female. Adolescent age at each wave was calculated by subtracting the date of birth from the date of interview at the corresponding wave. Nativity status was coded based on adolescents’ reports of their country of birth: 0 = born outside of the United States or Canada and 1 = born in the United States or Canada. In addition, adolescents’ country of residence was also coded: 0 = Canada and 1 = United States. Parent education was used as a proxy for family socioeconomic status and was assessed using the highest level of educational attainment between an adolescent's mother and father. The responses ranged across 1 = completed elementary school; 2 = completed junior high or middle school; 3 = completed high school; 4 = associate degree or some college; and 5 = 4-year university degree or higher.
Analytic plan
The two data sets were merged and then restructured from the wide to the long format based on adolescent age on the date of interview at each wave. The resulting age range across all waves of data was 12–22. We first examined the psychometric properties of the single-factor (i.e., discrimination) and multifactor (i.e., depressive symptoms and self-esteem) constructs separately for each sample using confirmatory factor analyses. Specifically, for depressive symptoms, the measurement model was specified such that items for each subscale (CES-D; Radloff, Reference Radloff1977) were loaded on one latent factor, and the four factors were specified to correlate. Similarly, for self-esteem, items for each subscale (Rosenberg, Reference Rosenberg1989) were loaded on one latent factor, and the correlation between the two factors was specified. Good model fit was indicated by confirmatory fit index (CFI) values of 0.95 or above and root mean square error of approximation (RMSEA) values of 0.08 or below (Byrne, Reference Byrne2010; Hu & Bentler, Reference Hu and Bentler1999). Because items for these constructs were ordinal, we used mean- and variance-adjusted weighted least squares estimator to obtain robust estimations for our analyses (Flora & Curran, Reference Flora and Curran2004). In doing so, some response categories were combined (e.g., “often” and “very often/always” for discrimination items) due to small counts.
Upon observing good model fit for the single-factor and multifactor measurement models, we then tested the equivalence of the factors across the two samples. To reduce model complexity, multiple group confirmatory factor analyses were conducted separately for each factor, including discrimination, subscales of depressive symptoms, and subscales of self-esteem. Wald tests were used to test for four levels of factorial invariance, from less to more stringent: configural, metric, strong, and strict invariance (Brown, Reference Brown2015; Van den Berg & Lance, Reference Van den Berg and Lance2000). Invariance tests were conducted in the order of stringency, and tests of a more stringent level of invariance (e.g., metric) were conducted only if the previous level of invariance (e.g., configural) was already established. First, for the test of configural invariance, goodness of fit was examined for the measurement models for discrimination and all of the preestablished subscales for depressive symptoms and self-esteem. Second, we tested the metric invariance by examining whether the factor loadings for all items were invariant (i.e., can be constrained to be equal without significantly harming model fit) across the two groups. Third, given the ordinal items, strong invariance was tested by comparing the equivalence of item thresholds of the ordinal items across the two samples (Millsap & Yun-Tein, Reference Millsap and Yun-Tein2004). Fourth, strict invariance was tested by comparing the equivalence of the unique variances of all items across groups. Factor means, variances, and covariances can be compared across groups when strong invariance is reached (Dimitrov, Reference Dimitrov2010). When a measurement model did not reach full strong invariance, partial strong invariance was pursued by testing if all item loadings and some item thresholds could be held equivalent.
Next, we applied time-varying effects models (TVEM; Tan, Shiyko, Li, Li, & Dierker, Reference Tan, Shiyko, Li, Li and Dierker2012) to estimate the relation between discrimination and adolescent adjustment across the continuous age spectrum. TVEM provides nonparametric estimates of the changes of intercepts or slopes over time (Lanza, Vasilenko, Liu, Li, & Piper, Reference Lanza, Vasilenko, Liu, Li and Piper2014). The only assumption for TVEM is that the change for the entire sample is continuous, but the same assumption is not imposed on the change for every individual in the sample (Lanza et al., Reference Lanza, Vasilenko, Liu, Li and Piper2014). The %TVEM program written in SAS language (Yang, Tan, Li, & Wagner, Reference Yang, Tan, Li and Wagner2012) uses a p-spline approach to determine the optimal number of knots with maximum likelihood estimation to estimate the shape and the degree of smoothness of the change over time (Tan et al., Reference Tan, Shiyko, Li, Li and Dierker2012).
The following model was estimated in the present study. The adjustment of individual i from assessment j for outcome k (i.e., any subscale of depressive symptoms and self-esteem) was predicted using discrimination, controlling for the time-varying effects of covariates:
 $$adjust_{ijk} = {\ss}_{0k}\lpar t \rpar + {\ss}_{1k}\lpar t \rpar *pedu_i + {\ss}_{2k}\lpar t \rpar *female_i + {\ss}_{3k}\lpar t \rpar *second\; generation_i + {\ss}_{4k}\lpar t \rpar *US_i + {\ss}_{5k}\lpar t \rpar *discrim_{ij} + \varepsilon _{ijk}.$$
The time-varying ßs were estimated based on the full age range of participants included in the study across all waves. All ßs in this article represent unstandardized regression coefficients. TVEM calculates the 95% confidence interval (CI) for each ß at a given time point. For example, ß5k in the equation at a given point (e.g., t = 15) on the curve represents the association between discrimination and adjustment k (e.g., depressed affect) at that particular age on the x-axis. An association at a given time point is considered significant if the CI at that time point does not include zero. However, TVEM does not provide simultaneous CIs across the entire period of time (Lanza et al., Reference Lanza, Vasilenko, Liu, Li and Piper2014), and as such, comparison of CIs across time for significance testing is not appropriate (Cumming & Finch, Reference Cumming and Finch2001, Reference Cumming and Finch2005). We therefore focused on the descriptive trends of the discrimination–adjustment associations across time when interpreting our findings.
Moderation analyses involving adolescent gender, nativity, and geographical region were conducted by analyzing separate TVEM models for the demographic subsamples (e.g., males vs. females; first vs. second generation, United States vs. Canada) with the specific demographic variable (e.g., gender, nativity, or region) removed from the models. The pointwise CIs estimated by TVEM are appropriate for group comparisons (Lanza et al., Reference Lanza, Vasilenko, Liu, Li and Piper2014). When two CIs do not overlap, the estimated effect is significantly different between the two groups (Cumming & Finch, Reference Cumming and Finch2001, Reference Cumming and Finch2005). In addition, when the proportion overlap of the 95% CIs is half or less (i.e., half or less of the average margin of error), the difference is also likely significant at p ≤ .05 (Cumming & Finch, Reference Cumming and Finch2005). When the overlap was half or less, the significance of the difference was further tested by determining whether or not the 95% CI for the difference score between the means included zero (Cumming & Finch, Reference Cumming and Finch2001), which can be expressed as
 $$95\% \; CI_D = \lpar {M_1 - M_2} \rpar \pm SE_D \cdot t_{n_1 + n_2 - 2;\; 0.975},$$
where
 $$SE_D = \sqrt {\displaystyle{{\lpar {n_1 - 1} \rpar n_1SE_1^2 + \lpar {n_2 - 1} \rpar n_2SE_2^2} \over {n_1 + n_2 - 2}} \cdot} \sqrt {\displaystyle{1 \over {n_1}} + \displaystyle{1 \over {n_2}}}.$$
Here, CI D and SE D represent the CI and standard error (SE) of the difference score, t represents the critical t value, and M 1/2, SE 1/2, and n 1/2 represent the estimated mean and SE of the effect size, as well as the sample size, of the two groups at a particular time point. As the sample size for each continuous time point was not available, we used the sample size for the period of time point ±0.5 (e.g., for age 14, we used the sample size for the window of 13.5 to 14.5) as a proxy. After examining the cross-sectional group differences, we also explored variations of the descriptive trends for the discrimination–adjustment associations across time for different groups.
Results
Preliminary analyses
Psychometric properties of key constructs
For the scale of discrimination, as there were only three items, the measurement model was just identified for both samples, and no model fit indices were available. The three items loaded well on the factor for both samples, with the loadings ranging from .71 to .87 across samples. For the CES-D scale, the four-factor confirmatory factor analysis models fit the data well (RMSEAs = 0.05–0.07; CFIs = 0.96–0.97). All items loaded well on corresponding factors for both samples, with the loadings ranging from .49 to .93 across samples, except for one item (“I felt that everything I did was an effort”) of the somatic symptoms subscale, which loaded poorly on the factor for both samples (.04 and .10). For this reason, this item was excluded for all subsequent analyses. We retested the measurement model without this item, and the model fit the data well (RMSEAs = 0.04–0.06; CFIs = 0.96–0.97). All items loaded on corresponding factors adequately (loadings: .49–.93). The two-factor model for self-esteem did not fit the data well for either sample (RMSEAs = 0.11–0.12; CFIs = 0.95–0.97). We thus allowed for two residual correlations for positive self-esteem (i.e., correlating “I have a number of good qualities” with “I am a person of worth” and with “I can do things as well as most others) and for negative self-esteem (i.e., correlating “At times, I think I am not good at all” with “I don't have much to be proud of” and with “I certainly feel useless at times”) based on Model Modification Indices to improve model fit (Byrne, Reference Byrne2010). The revised models fit the data adequately (RMSEAs = 0.071–0.073; CFIs = 0.98–0.99), and all items loaded on the factors well (loadings: .53–.91).
Measurement invariance across two samples
Various levels of invariance were observed for discrimination and subscales of depressive symptoms and self-esteem across the two samples. Specifically, discrimination reached strict invariance. For subscales of depressive symptoms, depressed affect reached strong invariance. For positive affect, two items were dropped due to significantly different item loadings across the two samples (“I was happy” and “I enjoyed life”). As the remaining positive affect subscale only had two items, the freely estimated measurement model could not be estimated due to underidentification. For this reason, we specified the multiple group measurement model of positive affect together with that of interpersonal difficulties (two items), allowing the two factors to correlate, which provided additional degrees of freedom. The combined measurement model reached partially strong invariance for both positive affect and interpersonal difficulties. For somatic symptoms, two items (“I had trouble keeping my mind focused on what I was doing” and “Sleep was restless”) were dropped due to significantly different item loadings across the two samples. The shortened somatic symptoms subscale with the remaining four items reached partially strong invariance. For subscales of self-esteem, keeping previously specified interitem residual correlations freely estimated for each sample, positive self-esteem reached partially strong invariance, while negative self-esteem reached strong invariance. These results indicate that associations among these variables can be compared across the two samples.
Descriptive results
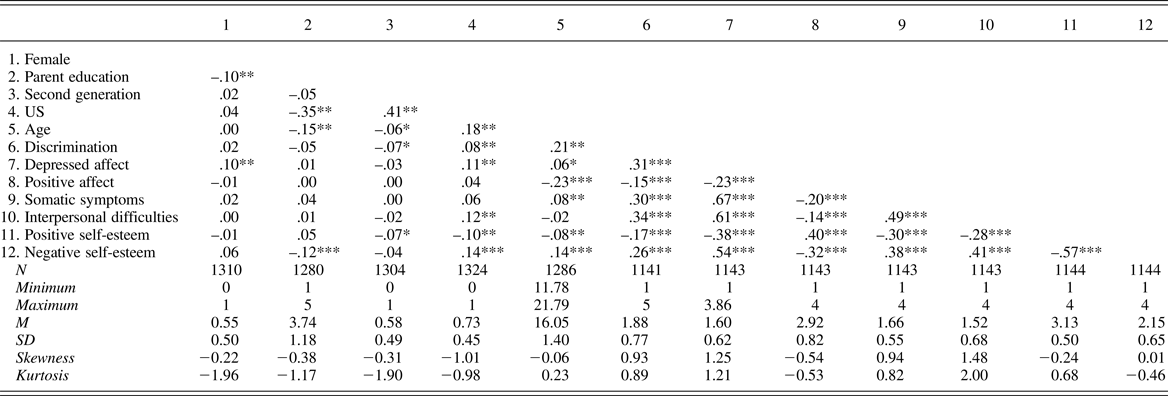
As shown in Table 2, discrimination was positively associated with age, suggesting that older adolescents perceived more discrimination than younger ones. Moreover, older adolescents also reported more adjustment problems, including greater depressed affect, somatic symptoms, and negative self-esteem, but not more interpersonal difficulties. Adolescents also reported lower levels of positive affect and positive self-esteem as they aged. In addition, higher levels of discrimination were associated with more adjustment problems, including higher levels of depressed affect, somatic symptoms, interpersonal difficulties, and negative self-esteem, and were associated with lower levels of psychological well-being, indicated by lower levels of positive affect and positive self-esteem.
Zero-order bivariate correlations and descriptive statistics

Note: *p < .05. **p < .01. ***p < .001.
Time-varying association between discrimination and adjustment across adolescence
Descriptive analyses with demographics (covariates) and adjustment
In general, Chinese-heritage adolescents whose parents were more highly educated, who were female, first generation, and from the United States reported more adjustment problems compared to their counterparts in middle adolescence. Specifically, the time varying coefficients for parent education were ßage15 = 0.06, 95% CI [0.01, 0.12] for depressed affect and ßage15 = 0.06, 95% CI [0.02, 0.10] for somatic symptoms. Moreover, the coefficients for the dummy-coded variable female were ßage15 = 0.20, 95% CI [0.09, 0.31] for depressed affect and ßage15 = 0.13, 95% CI [0.01, 0.25] for negative self-esteem. The coefficients for the dummy-coded variable second generation were ßage15 = –0.14, 95% CI [–0.27, –0.01] for depressed affect, ßage15 = –0.14, 95% CI [–0.27, –0.01] for interpersonal difficulties, and ßage16 = -0.14, 95% CI [–0.26, –0.02] for negative self-esteem. Finally, the coefficients for the dummy-coded variable United States were ßage15 = 0.27, 95% CI [0.13, 0.41] for depressed affect, ßage15 = 0.22, 95% CI [0.07, 0.37] for interpersonal difficulties, ßage15 = –0.16, 95% CI [–0.28, –0.04] for positive self-esteem, and ßage15 = 0.23, 95% CI [0.08, 0.38] for negative self-esteem.
Discrimination and adjustment analyses that included covariates
Discrimination was related to adolescents’ positive affect in late adolescence (indicated by CIs not including zero at age 18) but not in early adolescence (ßage13 = –0.07; 95% CI [–0.38, 0.24]; ßage18 = –0.23; 95% CI [–0.37, –0.09]). Similarly, discrimination was related to adolescents’ positive self-esteem in late but not early adolescence (ßage13 = –0.13; 95% CI [–0.30, 0.03]; ßage18 = –0.17; 95% CI [–0.27, –0.07]). In contrast, in both early and late adolescence, discrimination was related to adolescents’ interpersonal difficulties (ßage13 = 0.48; 95% CI [0.20, 0.76]; ßage18 = 0.34; 95% CI [0.25, 0.43]) negative self-esteem (ßage13 = 0.25; 95% CI [0.06, 0.45]; ßage18 = 0.23; 95% CI [0.10, 0.36]), depressed affect (ßage13 = 0.45; 95% CI [0.23, 0.67]; ßage18 = 0.27; 95% CI [0.17, 0.36]), and somatic symptoms (ßage13 = 0.36; 95% CI [0.16, 0.57]; ßage18 = 0.21; 95% CI [0.12, 0.30]). In general, discrimination related to less positive adjustment, more negative adjustment, and age-related patterns were qualified by differences by gender, nativity, and region.
Moderation of the time-varying discrimination–adjustment association by gender, nativity, and region
Time-varying discrimination–adjustment link for males and females
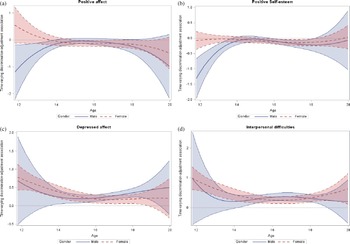
When comparing the magnitude of the discrimination–adjustment association at each age cross-sectionally from 12 to 18 for males and females, we found that the effect size was similar for both genders for depressed affect, somatic symptoms, interpersonal difficulties, and negative self-esteem, as indicated by largely overlapping CIs for estimates at each age. However, we found gender variations for positive affect and positive self-esteem, at least at early adolescence. Discrimination was related negatively to positive affect for males in early adolescence (ßage12 = –1.00; 95% CI [–1.82, –0.18]), but was not related for females (ßage12 = 0.46; 95% CI [–0.12, 1.04]; Figure 1a). Similarly, discrimination was related negatively to positive self-esteem for males in early adolescence (ßage12 = –1.15; 95% CI [–1.71, –0.59]), but was not related for females (ßage12 = –0.06; 95% CI [–0.32, 0.19]; Figure 1b). Thus, in early adolescence, discrimination has larger negative effects for positive adjustment for males compared to females.
Time-varying discrimination–adjustment associations for males and females. The y-axis represents the magnitude of the unstandardized coefficient of discrimination on (a) positive affect, (b) positive self-esteem, (c) depressed effect, and (d) interpersonal difficulties. Shaded areas represent 95% confidence intervals of the unstandardized effect sizes.

In addition to cross-sectional gender variation, we also examined across-age gender variation. Males and females were similar in that the effect size for the link between discrimination and somatic symptoms slightly decreased in magnitude over time for both females (ßage14 = 0.19; 95% CI [0.07, 0.32]; ßage17 = 0.15; 95% CI [0.06, 0.24]) and males (ßage14 = 0.35; 95% CI [0.14, 0.56]; ßage17 = 0.22; 95% CI [0.12, 0.32]). In addition, the effect size for the link between discrimination and negative self-esteem remained comparable in magnitude over time for both females (ßage14 = 0.18; 95% CI [0.01, 0.35]; ßage17 = 0.17; 95% CI [0.06, 0.28]) and males (ßage14 = 0.22; 95% CI [0.09, 0.36]; ßage17 = 0.22; 95% CI [0.10, 0.34).
Males and females were different in that, for females, the magnitude of the relation between discrimination and adolescents’ depressed affect decreased from early to late adolescence (ßage14 = 0.38; 95% CI [0.21, 0.55]; ßage17 = 0.17; 95% CI [0.06, 0.28]; Figure 1c). For males, however, the magnitude of the discrimination–depressed affect link was comparable from early to late adolescence (ßage14 = 0.24; 95% CI [0.05, 0.42]; ßage17 = 0.28; 95% CI [0.18, 0.37]). A similar gendered pattern was evident for interpersonal difficulties. For females, the magnitude of the relation between discrimination and adolescents’ interpersonal difficulties decreased from early to late adolescence (ßage14 = 0.43; 95% CI [0.24, 0.63]; ßage17 = 0.26; 95% CI [0.14, 0.38]; Figure 1d). For males, however, the magnitude of the discrimination–interpersonal difficulties link increased and was significant by late adolescence (ßage14 = 0.21; 95% CI [–0.01, 0.43]; ßage17 = 0.36; 95% CI [0.23, 0.50]). In sum, the negative implications of discrimination for depressed affect and interpersonal difficulties diminished over time for females, but not for males.
Regarding positive adjustment, discrimination was negatively related to positive affect during early adolescence, and the relation decreased in magnitude by middle adolescence for males (ßage12 = –1.00; 95% CI [–1.82, –0.18]; ßage15 = –0.04; 95% CI [–0.15, 0.06]; Figure 1a). In contrast, the relation between discrimination and positive affect was nonsignificant during early adolescence but was significant by middle adolescence for females (ßage12 = 0.46; 95% CI [–0.12, 1.04]; ßage15 = –0.12; 95% CI [–0.24, –0.01]). Similarly, discrimination was negatively related to positive self-esteem during early adolescence, and the relation decreased in magnitude by middle adolescence for males (ßage12 = –1.15; 95% CI [–1.71, –0.59]; ßage15 = –0.03; 95% CI [–0.12, 0.05]; Figure 1b). In contrast, discrimination was not related to positive self-esteem for females across these ages (ßage12 = –0.06; 95% CI [–0.32, 0.19]; ßage15 = –0.08; 95% CI [–0.16, 0.01]). In sum, in line with cross-sectional gender comparisons, early adolescence appeared to be a particularly difficult time for males to maintain positive adjustment in the face of discrimination.
Time-varying discrimination–adjustment link for first- and second-generation adolescents
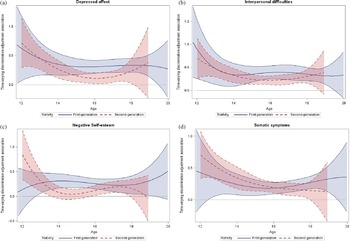
When comparing the magnitude of the discrimination–adjustment association at each cross-sectional age for first- and second-generation adolescents, we found significant differences in the effect size of discrimination for predicting depressed affect, interpersonal difficulties, and negative self-esteem. Discrimination had a larger effect size when predicting depressed affect for first-generation adolescents in middle adolescence (ßage16 = 0.31; 95% CI [0.20, 0.42]) compared to second-generation adolescents (ßage16 = 0.11; 95% CI [0.02, 0.20]; Figure 2a), as the CI for the difference score [0.05, 0.35] did not include zero. Similarly, the effect size of the discrimination–interpersonal difficulties link was larger for first-generation (ßage16 = 0.39; 95% CI [0.25, 0.54]) than second-generation adolescents in middle adolescence (ßage16 = 0.22; 95% CI [0.12, 0.32]; CIdifference [0.01, 0.34]; Figure 2b). Furthermore, discrimination was positively related to negative self-esteem for first-generation adolescents in middle adolescence (ßage15 = 0.30; 95% CI [0.18, 0.41]) but not for second-generation adolescents (ßage15 = 0.05; 95% CI [–0.05, 0.15]; see Figure 2c). Thus, in middle adolescence, discrimination had stronger negative implications for first-generation compared to second-generation adolescents.
Time-varying discrimination–adjustment associations for first-generation and second-generation adolescents. The y-axis represents the magnitude of the unstandardized regression coefficient of discrimination on (a) depressed affect, (b) interpersonal difficulties, (c) negative self-esteem, and (d) somatic symptoms. Shaded areas represent 95% confidence intervals of the unstandardized effect sizes.
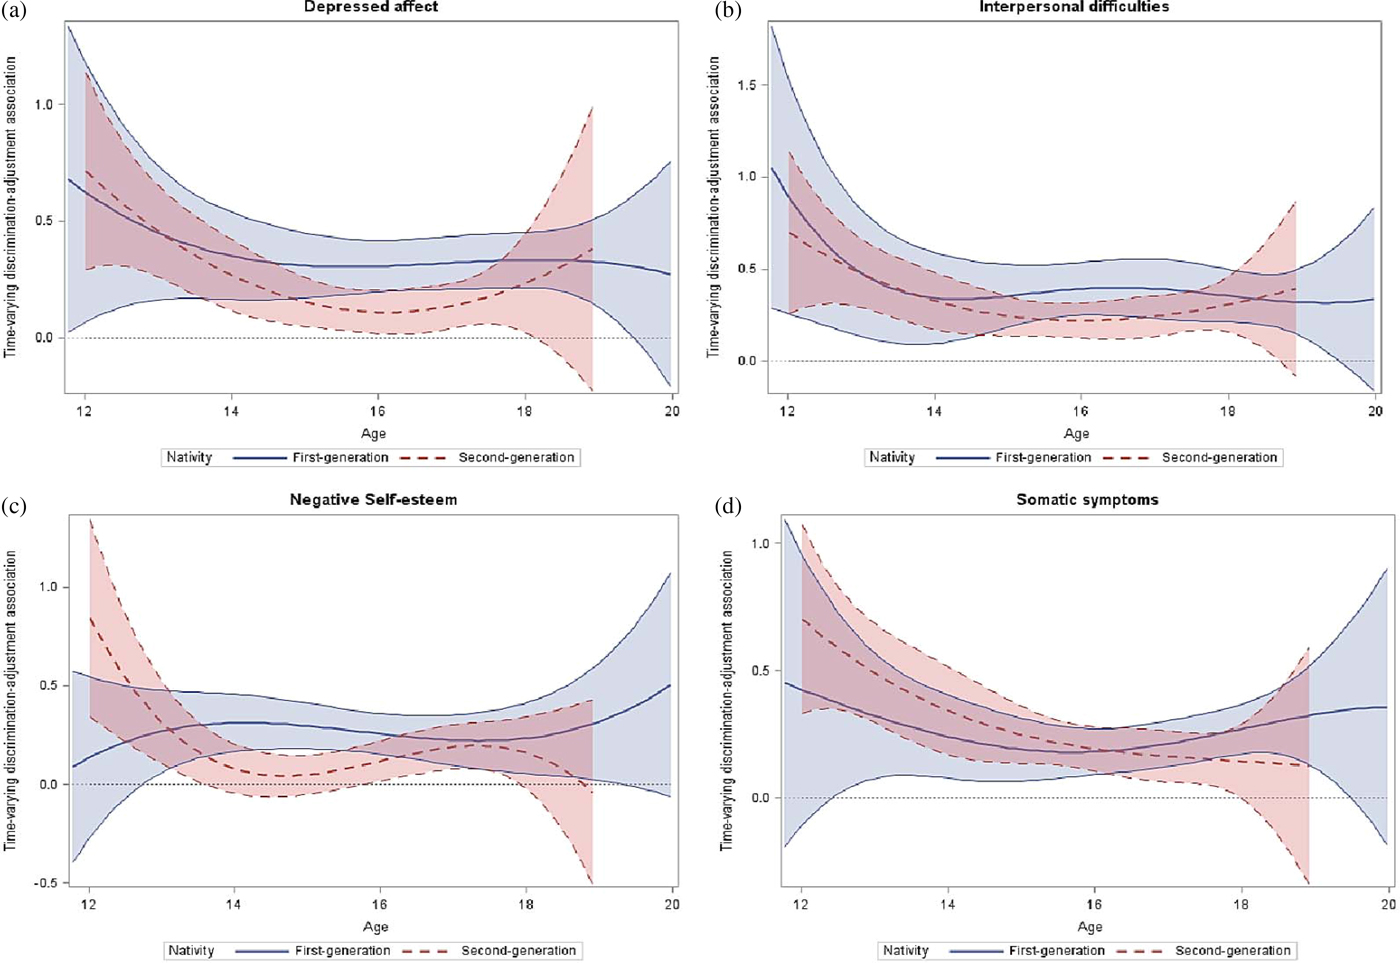
In addition to cross-sectional nativity variation, we also found across-age nativity variations. The magnitude of the associations between discrimination and depressed affect, interpersonal difficulties, negative self-esteem, and somatic symptoms decreased over time for second-generation adolescents but not for first-generation adolescents. First, the magnitude of the relation between discrimination and adolescents’ depressed affect decreased from early to middle adolescence for second-generation adolescents (ßage14 = 0.26; 95% CI [0.11, 0.42]; ßage16 = 0.11; 95% CI [0.02, 0.20]; Figure 2a). For first-generation adolescents, however, the effect size remained comparable in magnitude over time (ßage14 = 0.35; 95% CI [0.16, 0.54]; ßage16 = 0.31; 95% CI [0.20, 0.42]; Figure 2a).
Likewise, the magnitude of the relation between discrimination and interpersonal difficulties decreased from early to middle adolescence for second-generation adolescents (ßage14 = 0.32; 95% CI [0.17, 0.48]; ßage16 = 0.22; 95% CI [0.12, 0.31], Figure 2b), but for first-generation adolescents, the effect size did not decrease in magnitude (ßage14 = 0.34; 95% CI [0.09, 0.59]; ßage16 = 0.39; 95% CI [0.25, 0.54]; see Figure 2b). This same pattern was evident also with negative self-esteem. The magnitude of the relation between discrimination and negative self-esteem decreased from early to middle adolescence for second-generation adolescents (e.g., ßage13 = 0.32; 95% CI [0.11, 0.53]; ßage15 = 0.05; 95% CI [–0.05, 0.15], Figure 2c), but not for first-generation adolescents (ßage13 = 0.27; 95% CI [0.06, 0.48]; ßage15 = 0.30; 95% CI [0.18, 0.41]; see Figure 2c). A similar nativity pattern could be seen with somatic symptoms. The magnitude of the relation between discrimination and adolescents’ somatic symptoms decreased from early to middle adolescence for second-generation adolescents (ßage14 = 0.34; 95% CI [0.17, 0.51]; ßage16 = 0.19; 95% CI [0.11, 0.28]; Figure 2d). For first-generation adolescents, however, the effect size remained comparable in magnitude across early and middle adolescence (ßage14 = 0.24; 95% CI [0.08, 0.40]; ßage16 = 0.18; 95% CI [0.09, 0.27]; Figure 2d).
In contrast, the association between discrimination and adolescents’ positive affect was nonsignificant during early adolescence but became significant during late adolescence for second-generation adolescents (ßage14 = –0.06; 95% CI [–0.20, 0.07]; ßage17 = –0.20; 95% CI [–0.34, –0.05]); however, the effect size remained nonsignificant across early and late adolescence for first-generation adolescents (ßage14 = –0.13; 95% CI [–0.31, 0.06]; ßage17 = –0.05; 95% CI [–0.20, 0.10]). Consistent with the overall trend, however, the link between discrimination and positive self-esteem strengthened over time for both groups. The effect was nonsignificant during early adolescence but became significant during late adolescence for second-generation adolescents (ßage14 = 0.06; 95% CI [–0.08, 0.20]; ßage17 = –0.16; 95% CI [–0.24, –0.07]). The magnitude of the negative association also became larger over time for first-generation adolescents (ßage14 = –0.12; 95% CI [–0.24, –0.01]; ßage17 = –0.15; 95% CI [–0.29, –0.02]).
Time-varying discrimination–adjustment link for the United States and Canada
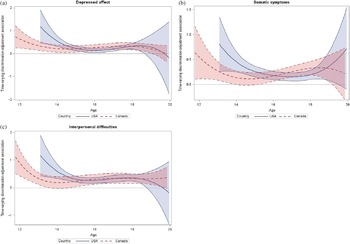
When comparing the magnitude of the discrimination–adjustment association cross-sectionally at each age for the US and Canadian samples, we found significant region variations for depressed affect, somatic symptoms, and interpersonal difficulties, at least in early adolescence. Discrimination was related positively to depressed affect for US adolescents in early adolescence (ßage14 = 0.56; 95% CI [0.32, 0.79]), and the effect was significantly larger in magnitude than that for Canadian adolescents (ßage14 = 0.22; 95% CI [0.05, 0.38]; CIdifference [0.01, 0.66]; Figure 3a). Similarly, the effect size of the discrimination–somatic symptoms link for US adolescents was significantly larger in magnitude in early adolescence (ßage14 = 0.46; 95% CI [0.25, 0.68]) compared to Canadian adolescents (ßage14 = 0.14; 95% CI [0.0003, 0.28]; CIdifference [0.04, 0.61]; Figure 3b). We also see a similar pattern for interpersonal difficulties, which was related positively to discrimination for US adolescents in early adolescence (ßage14 = 0.60; 95% CI [0.34, 0.87]), but was not significantly related for Canadian adolescents (ßage14 = 0.18; 95% CI [–0.03, 0.40]; CIdifference = [0.04, 0.80]; Figure 3c). Thus, in early adolescence, discrimination had stronger negative implications for US compared to Canadian adolescents.
Time-varying discrimination–adjustment associations for US and Canadian adolescents. The y-axis represents the magnitude of the unstandardized regression coefficient of discrimination on (a) depressed affect, (b) somatic symptoms, and (c) interpersonal difficulties. Shaded areas represent 95% confidence intervals of the unstandardized effect sizes.
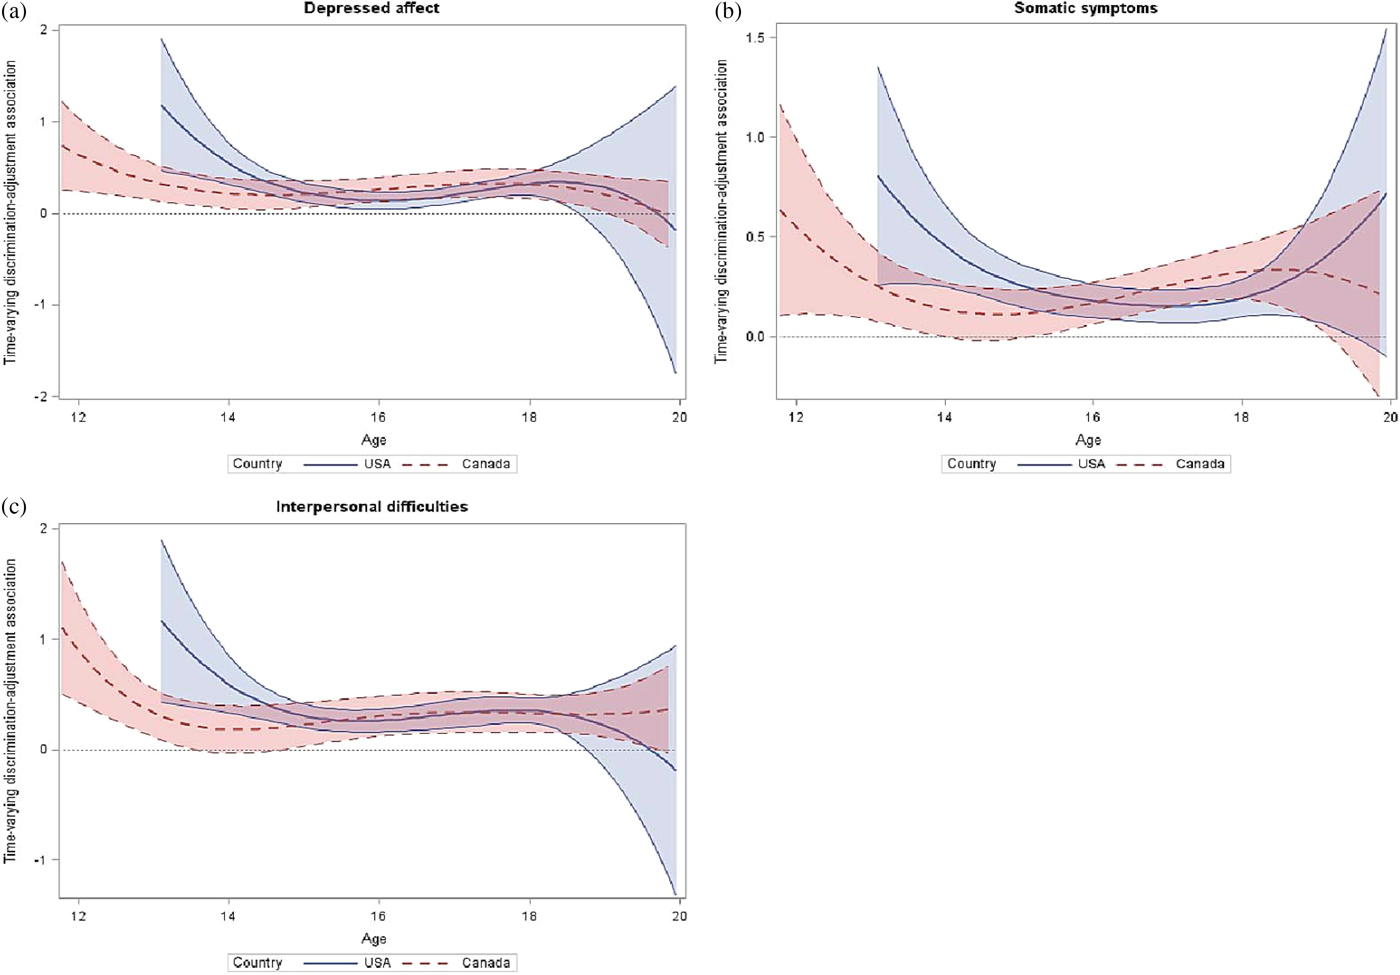
In addition to cross-sectional region variation, we also focused on across-age region variation. The link between discrimination and positive self-esteem was nonsignificant during early adolescence but was significant during late adolescence for US adolescents (ßage13 = 0.29; 95% CI [–0.30, 0.87]; ßage17 = –0.17; 95% CI [–0.26, –0.07]), whereas the effect remained nonsignificant across early and late adolescence for Canadian adolescents (ßage12 = –0.33; 95% CI [–0.69, 0.03]; ßage17 = –0.10; 95% CI [–0.25, 0.05]).
In contrast, consistent with the overall trends across age, we found that the effect sizes for the relations of discrimination to depressed affect, somatic symptoms, and interpersonal difficulties decreased in magnitude from early to middle adolescence for both regions. The magnitude of the relation between discrimination and adolescents’ depressed affect decreased from early to middle adolescence for US adolescents (ßage13 = 1.19; 95% CI [0.47, 1.91]; ßage15 = 0.22; 95% CI [0.12, 0.33]; Figure 3a) and for Canadian adolescents (ßage12 = 0.63; 95% CI [0.24, 1.02]; ßage15 = 0.21; 95% CI [0.07, 0.35]; Figure 3a). The relation between discrimination and adolescents’ somatic symptoms also decreased in magnitude from early to middle adolescence for US adolescents (ßage13 = 0.81; 95% CI [0.26, 1.36]; ßage15 = 0.26; 95% CI [0.15, 0.36]; Figure 3b) and for Canadian adolescents, (ßage12 = 0.55; 95% CI [0.11, 0.98]; ßage15 = 0.12; 95% CI [–0.01 0.24]; Figure 3b). Further, we found that the association between discrimination and interpersonal difficulties declined in magnitude from early to middle adolescence for both regions: for US adolescents (ßage13 = 1.17; 95% CI [0.43, 1.91]; ßage15 = 0.30; 95% CI [0.20, 0.41]; Figure 3c) and for Canadian adolescents (ßage12 = 0.95; 95% CI [0.45, 1.46]; ßage15 = 0.22; 95% CI [0.03, 0.42]; Figure 3c).
Discussion
The aim of our study was twofold: to examine (a) whether the link between racial discrimination and adjustment showed age-related changes across early to late adolescence for Chinese-heritage youth and (b) whether the age-related associations of the discrimination–adjustment link differed by gender, nativity, and geographical region. We found that discrimination was consistently related to greater depressive symptoms and lower self-esteem throughout early to late adolescence. We found these relations were stronger at certain points of development than others, depending on gender, nativity, and region. Attention to discrimination in early adolescence for males, middle adolescence for first-generation adolescents, and early adolescence for those in the United States may be especially important.
Based on the cross-sectional and across-time comparisons, we found that the negative effects of discrimination are greater in magnitude during early adolescence. Yet, these main effects were modified by gender. For instance, the magnitude of the relation between discrimination and lower positive self-esteem and positive affect was greater for males compared to females during early adolescence. We also found that while the negative link between discrimination and depressed affect and interpersonal difficulties decreased in magnitude across adolescence for females, it did not decrease for males. Thus, males appeared to be consistently vulnerable to negative implications of discrimination throughout the entire of period of adolescence. In contrast, females were also vulnerable, but mostly during early adolescence. Our results suggest that females may experience conditions that diminish depressed affect and interpersonal difficulties from middle adolescence onward. Female adolescents are more likely to seek social support, especially regarding stressful social situations (in contrast to, for instance, stressful academic situations) compared to males (Eschenbeck, Kohlmann, & Lohaus, Reference Eschenbeck, Kohlmann and Lohaus2007). Thus, females may be more likely to turn to friends or family members or trusted others for support if they experience discrimination, providing a dampening of the negative effects from middle to later adolescence. Future research should continue to not only focus on studying how discrimination may affect adolescents differently depending on their age and gender but also focus on identifying protective factors that may diminish the discrimination–adjustment link.
Although previous studies have reported mean-level gender differences in discrimination such as males reporting greater discrimination than females (e.g., in the United States, Liang et al., Reference Liang, Alvarez, Juang and Liang2006, and in Canada, Larochette et al., Reference Larochette, Murphy and Craig2010), our study adds to these findings to show that the negative implications for adjustment may be more persistent across the span of adolescence for males in particular. Because males may experience more racial discrimination than females, and may be less likely to turn to social support, the negative consequences associated with discrimination may be less likely to diminish throughout adolescence as it does for females. Nonetheless, we also note that males do seem to get better at coping with discrimination over time in some respects; in particular, discrimination is not related to positive adjustment by middle adolescence. However, discrimination continues to be related to negative adjustment.
Regarding nativity, we found that the magnitude of the discrimination to negative self-esteem link during middle adolescence was greater for first-generation compared to second-generation adolescents. In addition, the nativity-related pattern for time-varying associations between discrimination and depressed affect, interpersonal difficulties, and negative self-esteem were quite clear. For the second-generation adolescents, the effect size of these relations diminished from early to late adolescence; for first-generation adolescents, it did not. That is, the first-generation adolescents remained vulnerable to the negative implications of discrimination across adolescence. First-generation adolescents may have less experience in coping with discrimination compared to second-generation adolescents, who may be more familiar with race relations and dealing with racism as they have been born and raised in the United States or Canada. However, our findings contrast previous studies that have found that the second generation are more affected than first generation, at least with a certain type of discrimination such as foreigner objectification (Armenta et al., Reference Armenta, Lee, Pituc, Jung, Park, Soto and Schwartz2013). Perhaps our findings differ because our measure of discrimination did not capture foreigner objectification but rather general discrimination. Perhaps our findings differ because we focused on a younger age group. During adolescence, the effects of discrimination may work differently by generational status.
Figuring out how to effectively deal with discrimination while simultaneously navigating a new country along with their parents may be especially challenging for first-generation adolescents. If first-generation Chinese-heritage adolescents and adults are both more likely to perceive greater discrimination than those of the second generation, perhaps the effects are more consequential for adolescents as there are simply more members within the same family who are likely to be targeted for discrimination. Discrimination is a potent stressor that elicits negative emotional responses, which then has consequences beyond the person targeted to negatively emotionally affect other relationships. This phenomenon has been described as the “emotional spillover hypothesis” (Nelson, O'Brien, Blankson, Calkins, & Keane, Reference Nelson, O'Brien, Blankson, Calkins and Keane2009; Riina & McHale, Reference Nelson, O'Brien, Blankson, Calkins and Keane2012). Thus, if more members of the same family experience discrimination and, consequently, share negative emotions that potentially spill over to affect family functioning, perhaps this can partly explain why first-generation adolescents show such persistence in negative effects. In a US national survey, second-generation Asian Americans report feeling more positive about interethnic relationships, more open to interethnic marriage, and more likely to feel like a “typical American” compared to first-generation Asian Americans (Pew Research Center, 2013). At least for second-generation adolescents, then, they may experience less harassment than their first-generation counterparts, be more comfortable with interethnic relationships, and have a better understanding of how to address interethnic conflict such that they can more effectively counter the negative effects of discrimination through later adolescence.
Finally, we found regional differences. During early adolescence, the magnitude of the discrimination–adjustment link was greater for US adolescents compared to Canadian adolescents. Because Canada has more friendly multicultural policies for immigrant and ethnic minority populations, according to the Multicultural Policy Index, perhaps schools and communities are more likely to have resources and support for addressing discrimination when it happens. It will be important to take a closer look at how multicultural policies translate into everyday resources and practices in the schools and communities where adolescents reside. For instance, it may be the case that countries with more supportive multicultural policies also have schools with more positive diversity climates. Studies of school diversity climate show that when teachers and schools endorse and view cultural diversity positively and allow for discussion on such issues, adolescents are more open to interethnic friendships and demonstrate higher intercultural competence (Schachner, Noack, van de Vijver, & Eckstein, Reference Schachner, Noack, van de Vijver and Eckstein2016; Schwarzenthal, Juang, Schachner, van de Vijver, & Hendrick, Reference Schwarzenthal, Juang, Schachner, van de Vijver and Hendrick2017). When discrimination happens in such contexts, perhaps effects are somewhat attenuated if there is a generally positive and supportive environment where adolescents of many backgrounds are valued. We also found that, in general, the negative effects weakened from early to middle adolescence, at least for US, but not Canadian adolescents. US adolescents showed stronger negative effects at the beginning of adolescence; thus, they had more room for change. Because we know of no other study that considers adolescent discrimination effects by particular region over time, more research is needed to replicate this pattern to explain why effects weaken for US but not Canadian adolescents.
Considering the pattern of findings by gender, nativity, and region, we found that discrimination may be particularly hurtful during early adolescence, at least for males and US adolescents in particular. Early adolescence coincides with school transitions (Eccles et al., Reference Eccles, Midgley, Wigfield, Buchanan, Reuman, Flanagan and Mac Iver1993), along with major neural, biological, physiological, and cognitive transitions (Luby et al., Reference Luby, Belden, Jackson, Lessov-Schlaggar, Harms, Tillman and Barch2016; Steinberg & Morris, Reference Steinberg and Morris2001). The social landscape also changes regarding peer relationships, peer status, and peer acceptance (Brown & Larson, Reference Brown and Larson2009). The simultaneous accumulation of multiple developmental transitions may strain adolescents’ ability to cope. As adolescents age and become more secure with themselves, better able to resist peer influence, stand up for their own beliefs (Steinberg & Monahan, Reference Steinberg and Monahan2007), and develop better coping skills (Skinner & Zimmer Gembeck, Reference Skinner and Zimmer-Gembeck2007), they may be more effective in dealing with discrimination when it happens.
Our results thus support the developmental perspective of overwhelming simultaneous transitions that might tax adolescents’ ability to cope (Evans et al., Reference Evans, Li and Whipple2013), rather than the perspective that repeated experiences with discrimination over time has a cumulative effect (accumulation of allostatic load; Neblett et al., Reference Neblett, Shelton, Sellers and Philogene2004) that wears down protective resources over time. Nonetheless, our results address only the span of adolescence, and the accumulation over time of repeated experiences of discrimination may be harmful in later developmental periods as individuals age. There is some evidence that throughout adulthood (18 to 64 years), there is an intensifying toll on health in the face of persistent racial discrimination, with stronger effects as people age, especially for females (Geronimus, Hicken, Keene, & Bound, Reference Geronimus, Hicken, Keene and Bound2006). As such, gender and nativity variations in how discrimination relates to adjustment need to considered across the life course.
Our findings fit well into a cultural development and psychopathology perspective of adolescent health and well-being (Causadias, Reference Causadias2013). By integrating and considering multiple levels to understand culturally embedded experiences of discrimination and age-related associations to maladaptive and adaptive functioning, our study illustrates the necessary fusion of culture and developmental psychopathology to move the field forward (Causadias, Reference Causadias2013).
Strengths, limitations, and directions for future research
Strengths of the study include a focus on a specific ethnic group, combining two longitudinal data sets that covered the span from early to late adolescence from two different regions, and unpacking whether discrimination related to specific dimensions of depressive symptoms and self-esteem. Future research should continue to test age-varying associations concerning discrimination and well-being beyond and prior to adolescence. With age, as we transition through different contexts and environments, the experience and effects of discrimination may also change (Gee et al., Reference Gee, Walsemann and Brondolo2012). Understanding these transitions in more detail throughout the life span can clarify why discrimination may be more harmful at certain developmental periods. One strength of our TVEM approach is that we could also test over-time moderation effects by gender, nativity, and region to clarify whether some groups may be at greater risk than others and whether these risks persist or diminish.
We sampled from the ethnically and culturally diverse contexts of Northern California and British Columbia, where the majority of peer (school) contexts were characterized by significant numbers of Chinese-heritage individuals. In a highly same-ethnic dense context, when adolescents experience discrimination, they may also have greater access to resources and supports to connect to their ethnic group and build a strong ethnic identity. Contact with same-ethnic peers and friends is related to a stronger ethnic identity (Umaña-Taylor, Reference Umaña-Taylor2004; Yip, Seaton, & Sellers, Reference Yip, Seaton and Sellers2010), which can sometimes protect against consequences of discrimination (Greene et al., Reference Greene, Way and Pahl2006; Yoo & Lee, Reference Yoo and Lee2008; Rivas Drake et al., Reference Rivas-Drake, Hughes and Way2009, Reference Rivas-Drake, Syed, Umaña-Taylor, Markstrom, French, Schwartz and Lee2014).
Adolescents in same-ethnic dense contexts may also have greater access to peer socialization regarding issues of race and discrimination. For instance, among same-ethnic peers, adolescents learn about their heritage culture history, ethnic identity (Kiang & Fuligni, Reference Kiang and Fuligni2009), and engage in conversations about race and racism (Harper, Reference Harper2013), which may be easier to do with peers rather than parents. Sometimes parents are not aware that their children experience racial/ethnic discrimination (Hughes et al., Reference Hughes, Rivas, Foust, Hagelskamp, Gersick, Way, Quintana and McKown2008). In addition, youth may not tell their parents when it happens if they expect that their parents will overreact, minimize the experience, or because they do not want their parents to worry (Juang & Syed, Reference Juang and Syed2014). Because same-ethnic friends may have undergone similar experiences, adolescents may perceive their friends as better able to understand and offer support if discrimination happens. Research in other geographical locations with few Asian-heritage communities, where available resources to counter the negative effects of discrimination may differ, will also be important to carry out.
Future research could examine whether the effectiveness of protective factors also changes across ages such as how racial–ethnic identity (Umaña Taylor et al., Reference Umaña-Taylor, Quintana, Lee, Cross, Rivas-Drake and Schwartz2014), family cohesion (Juang & Alvarez, Reference Juang and Alvarez2010), cultural and racial socialization by parents (Hughes et al., Reference Hughes, Rodriquez, Smith, Johnson, Stevenson and Spicer2006; Juang et al., Reference Juang, Shen, Kim and Wang2016) and peers (Wang & Benner, Reference Wang and Benner2016) may buffer the discrimination–adjustment link more effectively at certain ages. If early adolescence is a particularly vulnerable time for the effects of discrimination, a focus on what parents do, what peers do, and how ethnic identity develops at the beginning of adolescence will be important.
There were some limitations to the study. One limitation is that our measure of discrimination did not specify the source. Asian-heritage adolescents experience more discrimination from their peers rather than adults, with greater consequences to mental health when targeted by peers (Greene et al., Reference Greene, Way and Pahl2006; Niwa et al., Reference Niwa, Way, Okazaki, Qin, Juang, Qin, Leong and Fitzerald2011). Our measure of discrimination was also general. Future research could include more detailed assessments of discrimination to be more Asian-heritage specific (e.g., model minority discrimination; Yoo, Burrola, & Steger, Reference Yoo, Burrola and Steger2010; internalized colonialism, David & Nadal, Reference David and Nadal2013), and distinguish between blatant and more indirect aspects of discrimination (e.g., foreigner objectification, Armenta et al., Reference Armenta, Lee, Pituc, Jung, Park, Soto and Schwartz2013; microaggressions, Nadal, Reference Nadal2011). Attention to the contexts of discrimination, such as where discrimination happens for adolescents (in the classroom, school grounds, neighborhood, and workplace) are also needed to better understand how specific people in particular places set the stage for greater or reduced risks for experiences of discrimination.
Another limitation is that we could not distinguish between age and cohort effects for across-time patterns of discrimination and adjustment. To distinguish age and cohort effects, it requires data with multiple distinct cohorts being assessed many times that allows researchers to estimate within-cohort changes across time as well as between-cohort differences. That said, we believe that the time-varying discrimination–adjustment link identified in our study is mainly due to age effects rather than cohort effects for two reasons. First, our data did not include very distinct cohorts as participants at Wave 1 were all were born in a similar period (late 1980s to early 1990s). Second, theoretically, the changing relation between discrimination and adjustment is more likely due to adolescents' cognitive and social development across age as we have discussed earlier (Greene et al., Reference Greene, Way and Pahl2006; Steinberg & Morris, Reference Steinberg and Morris2001; Umaña-Taylor, Reference Umaña-Taylor2016).
Another limitation is that because TVEM is a newer method, the impact of missing data is not yet well studied and there is a lack of imputation methods for dealing with missing data (Shiyko, Burkhalter, Li, & Park, Reference Shiyko, Burkhalter, Li and Park2014; Tan et al., Reference Tan, Shiyko, Li, Li and Dierker2012). Nonetheless, attrition or missing data is less of a concern in our study relative to studies of longitudinal relations as we primarily focused on the associations of the study variables across age and used a method that included all available data at each age (Twisk & de Vente, Reference Twisk and de Vente2002). The major strength of using TVEM is that it does not demand a prespecified (e.g., usually linear) modeling of data (Tan et al., Reference Tan, Shiyko, Li, Li and Dierker2012), allowing for a more flexible approach to capture nonlinear age-related patterns of change.
Implications for the development and implementation of evidence-based interventions
Experiences of discrimination among Chinese-heritage adolescents in North America are related to depressive symptoms and self-esteem across the span of adolescence. However, our time-varying effects modeling showed that the magnitude of effects changed across the ages, and for subgroups differently. This more specific understanding of the discrimination–adjustment link allows for a more targeted approach to developing effective interventions. Based on our findings, we suggest that clinicians who work with Asian-heritage adolescents be aware that they may be subjected to discrimination experiences, unlike what a model minority stereotype might imply. Interventions to address the negative effects of discrimination regarding Asian-heritage individuals should also focus on early adolescence. Our findings also suggest that some subgroups might be of heightened concern because the negative effects persist and do not diminish throughout middle to late adolescence, such as for males and first-generation adolescents. Different stereotypes associated with being an Asian-heritage male and experiences with being first generation (i.e., acculturation stressors and family members who are simultaneously undergoing the process of acculturation) may account for why the negative implications of discrimination do not diminish as much as they do for females and second-generation adolescents. In order to develop effective interventions, we need to better understand why males and first-generation adolescents remain vulnerable and why females and second-generation adolescents show improvement or better coping over time. Interventions that also consider the particular ethnic setting are needed. Adolescents living in communities and attending schools with few same-ethnic peers may have different opportunities to learn about and make meaning of discrimination experiences compared to those living in communities and attending schools with many same-ethnic peers. In sum, understanding the age-varying associations of discrimination by gender, nativity, and geographical region is important for identifying potential sensitive periods throughout adolescence that may put some adolescents at risk for poorer mental health and well-being more than others.