


Historically, epidemiological control policy has focused on the population of hosts more often than it has addressed transmission factors. Yet, factors like the highway network may be important to epidemic dispersal. For instance, the prevalence of some human infectious diseases may be higher in municipalities crossed by or next to major roads than in inhabited territories not linked by interstate highways [Reference Cook1]. In viral diseases affecting animals, proximity to interstate highways and/or location in areas of high road density may promote epidemic dispersal [Reference Rivas2]. These concepts were considered in the analysis of the daily progression of the 2006 Nigerian highly pathogenic avian influenza (HPAI) virus epidemic (subtype H5N1), where spatial and bio-temporal factors were explored. The spatial component analysed was the distance from each infected farm to the nearest major road (DNR), major road intersection (DNI), or other infected farms. The bio-temporal component investigated was the generation interval (transmission period) of the pathogenic agent [Reference Grassly and Fraser3], which includes but exceeds the viral replication period. While the replication period (for HPAI, estimated as ~2 days) refers to a single host [Reference Das4], the HPAI generation interval (estimated as ~10 days) denotes the time period between the infection reports for two individuals, located in different farms or flocks, when one of these individuals is the primary case and the other is the secondary case [Reference Stegeman5, Reference LeMenach6]. Because the HPAI virus may survive outside the host (e.g. in faeces, water [Reference Brown7]), its generation interval is usually longer than its replication period. The purpose of this study was to utilize the data collected in the 2006 Nigerian HPAI H5N1 epidemic in order to generate hypotheses on transmission factors associated with emerging infections of rapid dissemination.
The unit of study was the group of Nigerian cases (infected poultry farms, expressed as counts, percentages, or case density/km2). Any farm reporting at least one infected animal was defined as a case. Each case was characterized by its (a) latitude and longitude, (b) reporting time, and (c) Nigerian state of affiliation. Additional variables were (d) state road density (km of roads per km2 of state area), (e) state human population density (inhabitants/km2), and (f) state poultry population density (birds/km2), as well as the Euclidean distance (km) from the centroid of each infected farm to (g) the nearest major road (DNR), (h) the nearest major road intersection (DNI), or (i) any other infected farm. Cases were analysed as counts or percentages of (a) all cases (located at specified DNR or DNI), (b) new weekly cases, or (c) in relation to 10-day periods (assumed to reflect the HPAI H5N1 inter-farm generation interval).
Both the case geo-temporal data (113 poultry farms reported as infected by HPAI H5N1 between January and June, 2006) and the human and poultry population data of all Nigerian states were provided by the National Veterinary Research Institute of Nigeria [Reference Fasina8, Reference Adene and Oguntade9]. The Nigerian major road network map was derived from country situational base maps produced by the World Health Organization [10]. The estimated HPAI generation interval considered inter-farm, not intra-farm, infections [Reference Stegeman5, Reference LeMenach6].
Farm-related distances were calculated using Geographical Information Systems (GIS, ArcView GIS 3.3 and ArcGIS Desktop 9.0, both from ESRI, USA). To generate the DNR, the GIS near command identified the road segment nearest to each infected farm, the latitude and longitude values of the nearest point on this road segment, and the distance to the nearest point. These attributes were added to the infected farm layer. To calculate the DNI, a GIS point layer of all road intersections was created. Using the point distance command, a table was generated which contained (a) farm identifier, (b) nearest intersection identifier, and (c) distance. The same procedure calculated the distance between every pair of infected farms at a particular time unit; for instance, if 10 farms reported infections at a certain week, the median inter-farm distance at that time was that of 45 farm pairs (10×9/2). To empirically determine (a) whether disease clustering occurred, (b) if so, whether clustering was associated with major road intersections, and (c) if so, the critical radius of clusters (the smallest radius of circles that, earlier and over time, contained the highest percentage of weekly cases), using intersection identifiers, circles of various (arbitrarily chosen) radii were created, which were centred at road intersections (‘nodes’). Counts or percentages of weekly cases falling inside nodes were compared to the values found outside nodes. Density layers (road, human population, and poultry population) were produced by intersecting the variable of interest (e.g. ‘road network’) with the appropriate spatial scale (e.g. ‘states’).
Relationships between (state) density-related variables were explored with regression analysis. Median weekly inter-farm distances among infected farms were calculated with the Mann–Whitney test. Data were processed with Minitab 15 (Minitab Inc., USA).
Relationships between (state) case density/km2 and other (state) variables were explored (Fig. 1 a–c). Neither poultry density nor human population density predicted case density. While road density approached significance as a predictor of case density (P=0·06), its validity was questionable because results were highly influenced by the data from one state, likely to be an outlier (not shown).
Spatial-temporal progression of the 2006 Nigerian avian influenza virus (subtype H5N1) epidemic. Spatial location of weekly cases (infected farms) in relation to (state) poultry population density (a), road density (b), and human population density (c). Note that some farms located at a short distance are represented by a single point. (d) Median distance between pairs of infected farms. Box plots describe the median distance (central horizontal line) as well as 25th and 75th percentiles (whiskers). Asterisks denote observations above the 75th percentile. Note that no calculations were made at epidemic weeks 2 and 3 because only one case was reported in each of these weeks. (e) Percentage of cases (n=113 farms, January–June 2006) vs. distance to the nearest road (DNR). (f) Number of cases per epidemic day. (g) Cases within and outside 31-km radius circles (nodes), centred at major road intersections. (h) Percentage of new weekly cases vs. distance to the nearest road intersection (DNI), reported within 10-, 22-, 31-, and 34-km nodes. The smallest radius yielding the highest percentage of new cases earlier and for longer was ⩽31 km DNI. The difference in percentage of cases found between ⩽21 and ⩽31 km DNI was substantial (⩾twofold at ⩽31 km DNI than at ⩽21 km DNI); in contrast, the additional percentage of cases found at ⩽34 km than at ⩽31 km DNI was negligible. (i) Count-based, composite (epidemic-temporal-spatial) number of cases per generation interval (10 days each) and per DNR class.

The median Euclidean distance between pairs of newly infected farms per week was higher at the end of the period under study (weeks 15–24, median: 785·1 km, n=190 farm pairs) than before week 15 (median: 233·4 km, n=1048 farm pairs, Fig. 1 d), a statistically significant difference as determined by the Mann–Whitney test (P<0·001). However, because in emerging infections epidemic data cannot be considered to be independent random samples, the biological significance of this calculation is unknown.
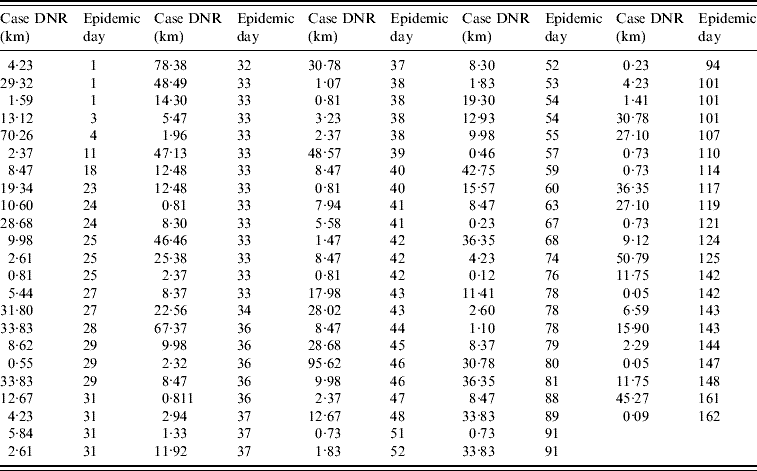
The data collected on the infected farm distance to the nearest road (DNR) supported the analysis of four spatial classes: <5 km, 5 to <10 km, 10–15 km, and >15 km DNR. Farms at a <5 km DNR accounted for 38% of all cases (43/113, Fig. 1 e, Table 1). When the number of cases per epidemic day was plotted, several gaps before the epidemic peak (day 33) indicated that even in the period of greater case growth, cases were not always reported on a daily basis (Fig. 1 f).
Case (infected farm) Euclidean distance to the nearest road (DNR) by epidemic day (n=113 farms)
The median DNI was 24·2 km in the first week. Farms located at ⩾100 km DNI only became infected after epidemic week 4. Case clustering was observed: 57% of all cases (65/113) were within 31 km of three road intersections (Fig. 1 g). From the second epidemic week onwards, cases at ⩽10 km DNI accounted for a substantial percentage of new weekly cases (~20%, Fig. 1 h).
When, instead of days or weeks, epidemic data were analysed with a double descriptor [number of cases per estimated HPAI generation interval, per spatial (DNR) class], an exponential growth phase was observed between the second and fourth generation intervals with cases reported in each of the generation intervals until the fourteenth generation interval of the epidemic (Fig. 1 i). Two epidemic phases were observed: (1) the one comprising first generation interval, and (2) the phase that included the remaining intervals (Fig. 1 i). While both <10 km DNR and >15 km DNR cases were observed in the first generation interval, <10 km DNR cases predominated in the second interval. Cases located at <5 km DNR represented >20% of all cases in each of the first eight generation intervals (Fig. 1 i). By epidemic day 4 (generation interval I), cases at <5 km DNR represented 40% of all infected farms.
These data support the hypothesis that the Nigerian major highway network promoted epidemic spread. In the first half of 2006, HPAI H5N1 cases could be categorized into two major spatial classes: (1) the predominant class, which included cases close to roads, intersections, or other infected farms, and (2) a secondary class, including cases located at >15 km DNR, >31 km DNI, or long inter-farm distances. Because not all road intersections were equally associated with cases and >20% of cases reported at any generation interval were at <5 km DNR, both a non-random (clustered) case distribution hypothesis and Pareto or power law distributions (the ‘20:80 rule’) were supported by the data [Reference Woolhouse11]. The ‘20:80’ rule refers to a high percentage of epidemic size (e.g. ~80%) associated with a few (e.g. ~20%) highly influential cases.
While the early cases were reported in the centre and in the periphery of Nigeria (near Lagos), only those near three major highway intersections (those in the centre of the country) were predominantly associated with viral dispersal. The data did not appear to support the hypothesis that migratory birds or wind might have disseminated H5N1 within Nigeria. In contrast, anthropogenic-mediated dispersal was likely. Possible behaviours that may spread HPAI H5N1 include subsistence agricultural practices, such as live bird markets [Reference Lau12] and early re-population of infected premises with susceptible birds.
These hypotheses are unlikely to be contradicted by non-reporting or delayed reporting. Because (1) the unit of the outcome was not the number of infected birds but the number of farms reporting infections, and (2) HPAI is associated with high mortality [Reference Fasina8, Reference Adene and Oguntade9], the magnitude of non-reporting in this epidemic could not be as high as that of a subclinical disease or an epidemic where the unit of the measured outcome is the individual animal.
The use of temporal units expressed as (inter-farm) HPAI generation intervals appeared to prevent false-negative results. If expressed in days, the epidemic might have seemed to cease when no new cases were reported in three consecutive days – the time equivalent to a replication period, as observed several times before the epidemic peak (Fig. 1 f). In contrast, when measured as generation intervals, no gaps were observed before the epidemic peak (Fig. 1 i). Caution is warranted in relation to the generation interval considered here: the estimates used were based on studies conducted in other countries where other HPAI subtypes (not H5N1) were isolated [Reference Stegeman5, Reference LeMenach6].
Within three epidemic weeks, the Nigerian scenario showed infected farms separated by Euclidian distances >900 km. Later, pairs of infected farms were up to 1500 km apart. This situation did not support the hypothesis that post-outbreak policies limited to the susceptible population (e.g. vaccination, de-population, quarantine [Reference Grassly and Fraser3]) would be effective. Instead, this epidemic dataset provided an opportunity to revise two aspects of control policy traditions: (1) the time when control measures are chosen as well as the focus of such measures, and (2) the feasibility and information value of assessments that compare infected and susceptible populations.
In emerging infectious diseases, decisions should be made as early as possible [Reference Phillips and Goodman13]. Even if an early decision to use an inexpensive control measure is less certain than a decision that requires waiting for definitive data, the early intervention may produce much larger benefits and may therefore be the better choice. However, control measures have classically been based on the ratio between the number of secondary cases and those generated in the primary generation interval [Reference Grassly and Fraser3, Reference Das4]. The calculation of this ratio requires a waiting time of at least two generation intervals (~20 days in this scenario). At such a late time in the epidemic progression, measures focusing on susceptible hosts necessarily become costly, complex, involve a large geographical scale, and may require a lengthy period to induce effects. If, in addition to control policies that focus on the susceptible host, early dissemination factors are emphasized, more beneficial results might be achieved.
In emerging infectious diseases, all cases, except primary cases, are dependent, i.e. they are generated from some of the primary cases [Reference Grassly and Fraser3, Reference Koopman14]. In this scenario, not all secondary cases showed the spatial features revealed by all primary cases. Only <10 km DNR primary cases seemed to trigger the epidemic spread: they predominated in 12/13 consecutive generation cycles (Fig. 1 i). Epidemic cases do not have identical weight either: secondary cases generate more cases than tertiary ones, tertiary cases create more cases than quaternary ones, and the last cases – if the epidemic stops – produce none.
Because comparisons between infected and susceptible populations are sensitive to statistical power issues and emerging diseases are typically characterized by only a very few cases at the onset, such comparisons may be unfeasible in scenarios like the one described. Even if feasible, comparisons between infected and non-infected individuals may be inconsequential: if the putative dispersal mechanism associated with cases differs in magnitude in relation to susceptible individuals, e.g. if the DNR of cases measured at an early epidemic time is shorter than the DNR of susceptible individuals, that difference is not evidence that later changes (in any direction) may occur. If, instead, no difference in DNR is found between infected and susceptible individuals, such a finding would support an urgent intervention: it would suggest that the mechanism already shown to promote epidemic spread could soon reach individuals still not affected. These considerations, together with the focus on early decision-making, support the view that comparisons between infected and susceptible populations may not apply to the early phase of emerging infections. Instead, in early phases of infectious epidemics, the priority, as John Snow showed a century and a half ago, may be the identification of plausible transmission factors associated with cases [Reference Snow15].
A simple assessment of the association between the percentage of cases and a transmission factor, if conducted during the first generation interval of the invading microbe, may improve decision-making. In the situation under analysis, such a decision could have been made at epidemic day 4 – one fifth of the time required by classical models, i.e. two generation intervals or 20 epidemic days. Because the percentage of cases located a short distance from the nearest road was known to be ⩾20% before the first generation interval concluded, a dispersal mechanism could have been postulated: epidemic spread mediated by roads. This data-driven proposition could have supported the implementation of control measures at specific spatial points, such as road blocks that prevent poultry trade.
If the actual spread had been mediated by other means, the cost of such decision would have been negligible. However, if correct, this decision could have stopped the epidemic spread because no secondary cases could occur. If (a) the percentage of primary cases associated with a factor likely to act as a dispersal mechanism is >20% [Reference Woolhouse11], (b) the spatial structure of this factor is known and measurable (such as the location of major roads), and (c) the spatial location of infected sites is also known (if the disease is clinically observable, such as HPAI H5N1), then (d) early decisions can be produced.
In emerging infections, if rapid dissemination occurs, a pre-existing contact network may be suspected. However, connectivity alone may not suffice to explain epidemic dissemination. If connectivity is too high (if space is completely occupied by a network of highways or rivers), increased connectivity can only occur at the expense of population density. Hence, the interaction that involves connectivity, infected and susceptible subpopulations is unlikely to be linear: while epidemic diffusion requires a minimum of connectivity, maximal epidemic diffusion may decrease, if not cease, when increases in connectivity result in decreases of population density (e.g. a road density so high that no land is available for housing or farms). Hence, a practical application of these lessons is the anticipatory generation of matrices that include spatially explicit data on 100% of the susceptible population. Such data may identify the specific network nodes, e.g. highway intersections, that reveal not only high connectivity values (e.g. shorter distances between pairs of nodes), but also high demographic values (e.g. high farm density). When such data are available before emerging epidemics occur, then they may help to allocate resources earlier, at the nodes suspected to be critical. The effectiveness of control measures meant to disrupt pre-existing networks can only be effective if implemented earlier, not later. Such early decisions could also increase the effectiveness of later measures, reducing the cost or coverage of mass vaccination, isolation, and other measures focusing on the host.
These considerations may be of interest for policy-makers of countries not yet affected by HPAI H5N1 as well as those of countries susceptible to emerging infectious diseases. Information on variables such as farm location, inter-farm distance, and the DNR and DNI of each farm, if available before an emerging infection occurs, could inform early implementation of control policies.
ACKNOWLEDGEMENTS
We are grateful for the assistance of the Executive Director and the staff of the National Veterinary Research Institute of Nigeria, Mrs. Celia Abolnik (ARC-OVI, South Africa), and the support of the Centro de Investigaciones Avanzadas (CINVESTAV, Mérida, YUC, México) and the Center for Non-Linear Studies (Los Alamos National Laboratory, Los Alamos, NM, USA).
DECLARATION OF INTEREST
None.



