I. France
A. Denis Dubourdieu
University of Bordeaux, ISVV Bordeaux, Château Reynon, Château Doisy Daëne, Château Cantegril, Château Haura & Clos Floridène, Bordeaux, France
I am not a specialist in the climate, past, present, or future, nor am I a climate sceptic.
I have been making wine and advising winemakers in Bordeaux for 40 years, as well as in many fine-wine regions in Europe and a few in the New World for 25 years. I have, therefore, been in a position to make certain observations on the impact of the annual climate and its fluctuations on grape composition and wine quality. These are not opinions or forecasts, but facts.
The climate became warmer in the decade from 2000 to 2010. In Bordeaux, Burgundy, Hermitage, Loire, and Champagne, among others, the red grape varieties produced sweeter, deeper-colored, more tannic grapes, and the whites did not necessarily have lower acidity, in the hands of a capable winemaker. Over this period, the warmer temperatures resulted in an unrivalled number of great to very great vintages in all these regions, including Champagne, and, more importantly, no lesser vintages due to cool, damp conditions, as there had been in the previous decade. For example, in Bordeaux, there were six awful vintages in 10 years: 1991, 1992, 1993, 1994, 1997, and 1999. The previous two decades were no better: 1963, 1965, 1967, 1968, 1972, 1973, 1974, 1977, 1979, 1980, 1984, and 1987 were all mediocre, and chaptalization was used on a massive scale.
The present decade started with three unsettled summers and/or springs, making it much more difficult to produce successful wines. The cool summer in 2011 and the wet spring and autumn in 2012 made them average—certainly not great—vintages. It was particularly difficult to make decent red wines in 2013, due to the wet, cold spring and rain in September and October.
Until now, I have never known a year in which it was too hot to make successful wines in Bordeaux or Burgundy, even in 2003. In the more distant past, the legendary years in Bordeaux and Burgundy were always hot and dry: 1893, 1900, 1923, 1924, 1929, 1934, and 1937. The 1940s and 1950s were also predominantly hot and dry, with a number of great vintages: 1942, 1943, 1945, 1947, 1948, 1949, 1950, 1953, 1955, and 1959. “Summers of yesteryear burn in the bottles of Yquem,” as François Mauriac wrote at the time.
Every year, the fine French vineyard regions not protected by the Mediterranean climate escape spring frosts by just a few tenths of a degree, and winter frost recently caused significant damage in Burgundy.
To summarize, traditional winegrowers in European fine-wine regions have great difficulty producing good vintages when the weather is only slightly cooler and wetter than usual, whereas they adapt easily to hotter, drier conditions.
Around 30 years ago, in the hot, dry regions of both the Old and New Worlds, winegrowers planted relatively early ripening northern French grape varieties, known for the expensive, highly prized wines they produce in oceanic or continental climates where they ripen more slowly. Winegrowers have already felt the negative effects of climate warming on their wines: too much sugar, “stewed” fruit aromas, international taste, tough tannins, and an inability to acquire the reduction bouquet associated with aging. They have very little room to maneuver as their choice of grape varieties needs to be revised, but there is some hope, thanks to the diversity of European grape varieties and their preference for a Mediterranean climate, like that of the regions where they were first cultivated, 7,000 or 8,000 years ago—shores of the Black Sea, Armenia, Mesopotamia, Palestine, and Egypt—long before they came to western Europe.
B. Boris Champy
Louis Latour, Beaune/Burgundy, France. Email: bchampy@louislatour.com.
As a winemaker and a lover of older wine vintages, I do not want to see too much climate change. In fact, the existing grape varietal-climate associations in many regions, such as Alsace-Riesling, Bordeaux-Merlot/Cabernets, Piedmont-Nebbiolo, Tuscany-Sangiovese, and Burgundy-Pinot/Chardonnay, provide many fine, age-worthy wines. I, therefore, hope we can continue this path and that human activity will not irremediably affect these beautiful terroirs.
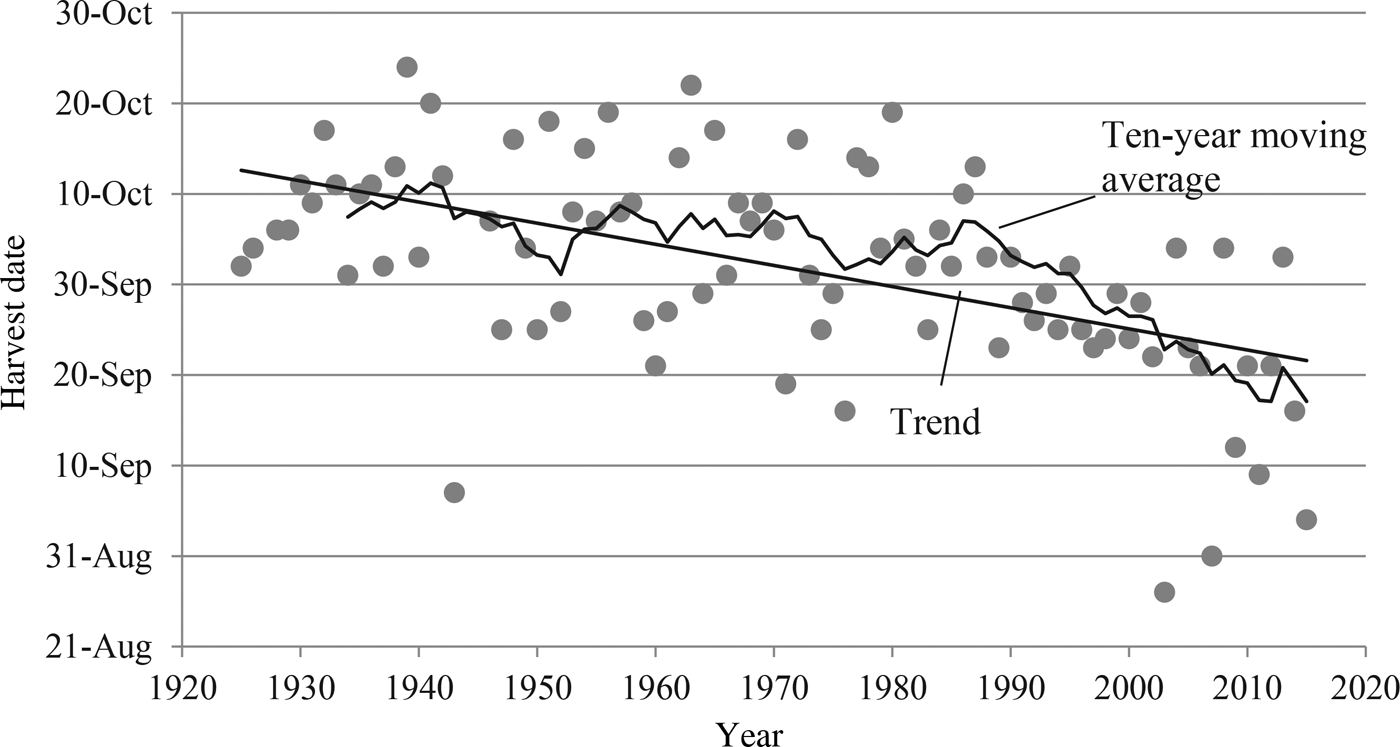
Have we experienced climate change in our vineyards? Yes, our harvest dates have significantly changed over the past 70 years. Figure 1 shows that the harvest dates in our Corton Perrière vineyard, planted entirely with Pinot Noir, have moved from mid-October (in the 1930s and 1940s) to now approximately September 20.
Harvest Dates in Corton Perrière Vineyard, Domaine Louis Latour, 1925–2015

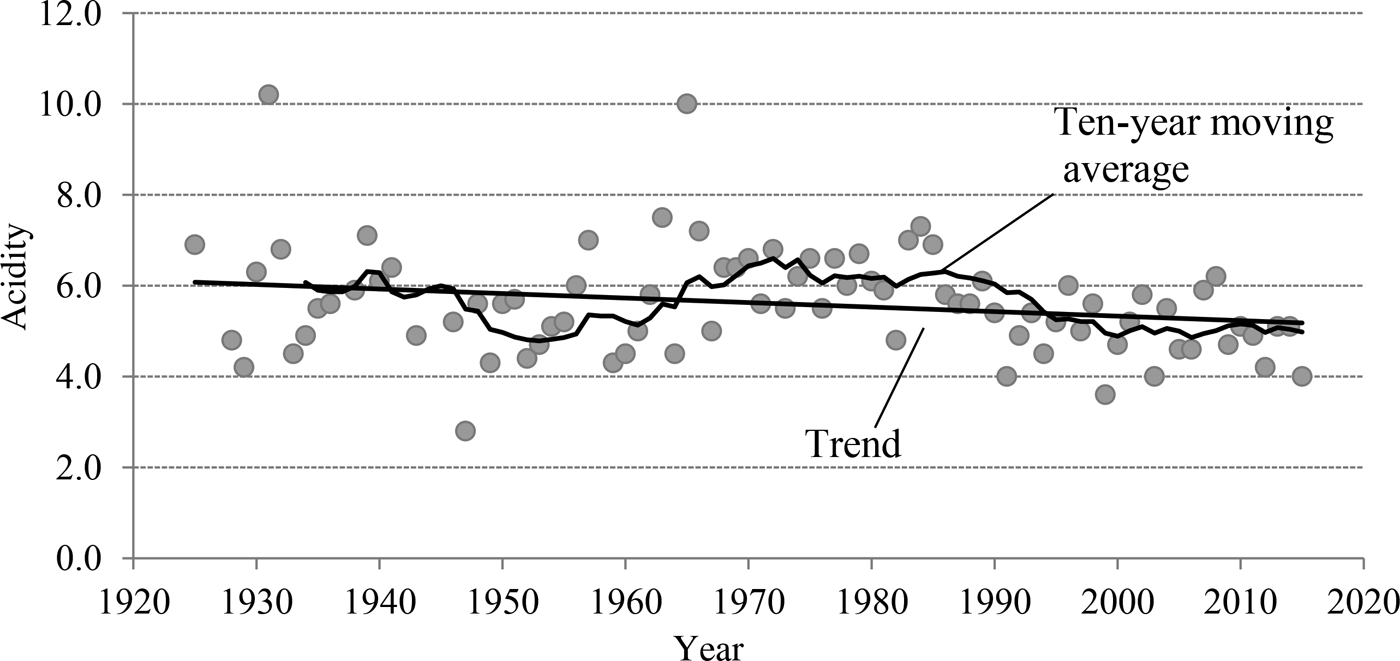
We have also seen compositional changes in our grapes. As shown in Figure 2, over the past 70 years the average acidity levels in grapes at harvest have moved from 5.9 g/L to 5.1 g/L, a steady but slow change. It is not clear a priori whether this development is only weather related or is also due to other changes in vineyard practices (e.g., fertilization, deleafing, etc.). Note that 1947 belongs to the vintages with the lowest acidity levels ever.
Total Must Acidity, Corton Perrière Vineyard, 1925–2015
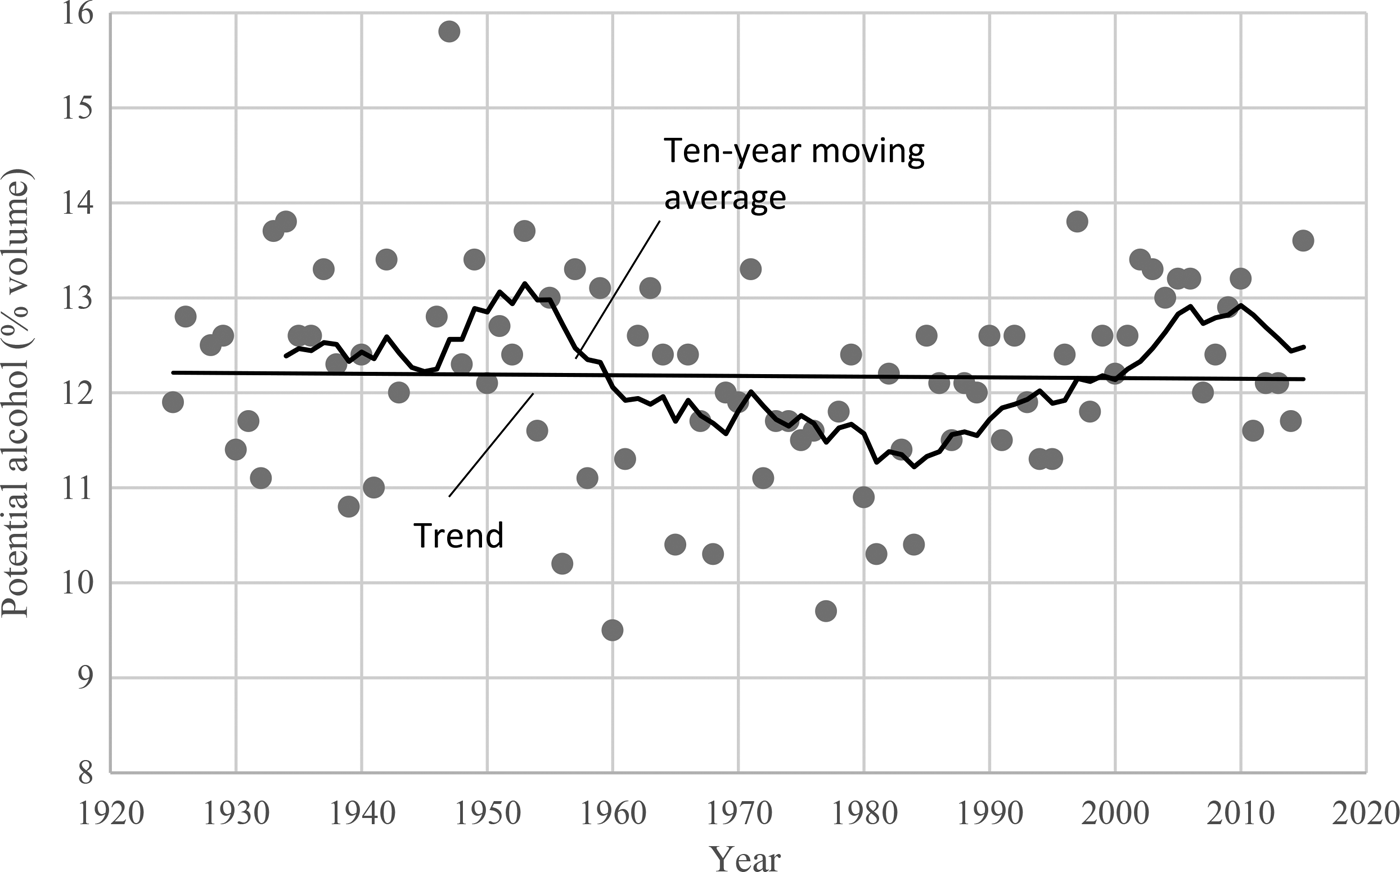
In contrast, average sugar levels at harvest have not significantly changed over the past 90 years, suggesting that grape sugar levels are not only dependent on weather but also influenced by a multitude of factors including yields (Figure 3). The formula “warmer weather, more alcohol” is an oversimplification; the functional relationships are substantially more complex.
Potential Must Alcohol, Corton Perrière Vineyard, 1925–2015
Varieties and Climate
Pinot Noir and Chardonnay, the main varietals, have been cultivated in Burgundy for hundreds of years; in the case of Pinot Noir, this may be up to 900 years. Given that this period encompasses various climatic phases ranging from the Medieval Climate Optimum to the Little Ice Age, generations of winemakers before us have adapted their grape-growing and wine-making techniques to climate changes over long periods of time.
Versatility of Grape Varietals
Today, Pinot Noir is not only planted in or associated with a single region. The finest wines in Burgundy as well as in Champagne are based on Pinot Noir. However, for hundreds of years, Pinot Noir has also been planted beyond Burgundy and Champagne, in Jura and Alsace, Switzerland, and in Germany to the east, Sancerre to the west, and Italy to the south. After the phylloxera outbreak of the late nineteenth century, many grape growers in cool-climate regions, such as the Haute Marne, Haute Saone, and Auxois, abandoned their vineyards. With climatic change and increasing temperatures, these regions may become ideal places to grow Pinot.
In addition, Chardonnay and Pinot have been widely planted in warmer climates from Languedoc to Spain, and in the New World in California, Oregon, Chile, Argentina, and Australia. Due to increasing research in cool-climate regions, Pinot has also been cultivated in New Zealand, Canada, and other cooler areas.
Pinot Noir is extremely versatile. It can be cultivated in a wide range of climates and can display a wide range of characteristics in terms of yield, color intensity, typicity, and so forth. According to the INRA-ENTAV list of clones available in France (http://plantgrape.plantnet-project.org/fr/clones), Pinot Noir exhibits by far the largest number and widest range of clones, spanning from sparkling wine to fine-red clones.
Technological Changes
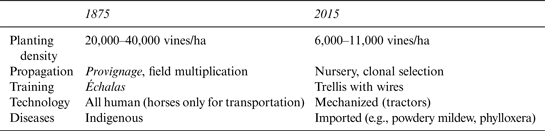
Agriculture has always adjusted to changing environments. Table 1 shows the most important changes in viticulture that have occurred over the past 140 years. These examples show that viticulture has fundamentally changed, even in “traditional wine producing regions.” I am sure we will see more changes in the future, in particular under changing climates.
Changes in Viticulture, 1987–2015
Remember Clonal Selection in the 1970s?
Every viticulture student in France learns about clonal selection. Especially the 1970s, a decade with many cold and rainy vintages, resulting in low yields and many virus-affected vineyards, saw a wave of clonal selections. The selection is made mostly using a two-axis graph, one axis for sugar level and the other for yield. The clones used today all over the world are selected for high-yield and high-sugar potential. Figure 4 shows an example with Merlot, in which the high-yield/high-sugar clones have been highlighted.
Potential Alcohol and Yield per Vine, Five-Year Average for Various Merlot Clones at Parcel P4 in Latresne (Bordeaux)
In a similar fashion, one can in the future select clones with lower sugar and higher acidity (ripeness potential) that are more adapted to warmer climates. This is nothing new; it is merely an adaptation of the vines to the respective climatic conditions. In addition to yield and sugar, one may also consider polyphenolic potential (polyphenol quantity and quality) and rusticity (resistance to disease).
In fact, massal selection (cuttings from various vines from one vineyard) and provignage (buried canes originating from one vine and still connected to it), traditional techniques used before the existence of grapevine nurseries, all display an adaptation process in which the vigneron multiplied the best vines from his own plots. Because these were the vines best adapted to the climate, the selections must have evolved with weather changes, preferred wine style, and other parameters.
Climate change will pose a challenge viticulture has to answer. However, it is not the first problem we have faced. Crises such as phylloxera and downy mildew have been mastered successfully. I am confident that we will also find an answer to a warming climate.
II. Germany
A. Clemens Busch
Weingut Clemens and Rita Busch, Pünderich, Mosel, Germany. Email: weingut@clemens-busch.de.
The Busch family has been growing grapes and making wine on the Middle Mosel for hundreds of years. As usual in the valley, people farmed in polycultures and were self-sufficient. Aside from making wine from the town's vineyard site, the Pündericher Marienburg, most families also grew potatoes and vegetables and kept various animals. It was only in the early 1920s when my grandfather focused almost exclusively on growing grapes and making wine.
I was introduced to winemaking by my father in 1974 and produced my first wine in 1975, a grateful and easy vintage. When taking over from my father in 1984, my wife, Rita, and I converted to organic farming and winemaking. In 2005, we turned biodynamic. We currently have 17 ha under vines and focus exclusively on Riesling. Almost all of our vineyards are on steep south- and southwest-facing slopes in the Mosel Valley. Our soils are dominated by gray, blue, and red slates.
Weather Trends
Over the past 40 years, we have experienced many changes—increasing average temperatures being only one of them. It has certainly become warmer in the Mosel Valley. By itself, warmer weather would be beneficial for wine on the Mosel because we are almost at the northern frontier of professional viticulture and heat is a scarce resource. However, in combination with more rain, we have also noticed higher humidity and almost tropical conditions. In addition, the number of extreme weather events has significantly increased. We now see more torrential rainfalls and hail than we did in the past, which is a challenge for soil management particularly on our steep slopes.
Effects on Sugar, Acidity, and Yields
The warmer temperatures of the past decades have resulted in an earlier onset of all phenological stages. I would say the trend to warmer and earlier years became apparent in 1999. Our grapes ripen earlier, and the sugar contents of the musts have significantly increased. Among others, this is also reflected in the alcohol content of our dry wines, which are higher than 20 years ago. In contrast, I cannot detect any trend toward lower acidity levels. The average acidity has stayed more or less constant. Of course, we have always had large vintage-to-vintage variations.
We have not noticed any effect of warming temperatures on our crop yields. Because we have always managed our vines tightly and have limited our crop per hectare, even beneficial weather will not result in larger quantities.
Challenges
However, warming is not only beneficial; we also face a few challenges. Aside from extreme weather events, such as torrential rainfalls, hails, and floods, we are also plagued by higher humidity, which is conducive to fungal diseases. I am not sure whether black rot is climate induced, but botrytis is. In the past, we have benefitted from the appearance of botrytis late in the growing season. However, to take advantage of botrytis timing is crucial. Riesling, as a slow-ripening varietal, benefits from late botrytis arrivals. With warmer weather, now both Riesling's ripening stage and the appearance of botrytis have lost their synchronization. It has become increasingly difficult to attain positive botrytis effects. In fact, botrytis tends to become a negative event.
We have also seen an increase in downy mildew outbreaks, which may be associated with rising temperatures. This problem is particularly severe for organic grape growers.
Adaptations
Being a grape grower and winemaker means you have to adapt on a permanent basis. Our harvest dates have always varied widely depending on the weather. On average, we harvest now about 4 to 5 days earlier than 29 years ago.
We also believe that biodynamic farming supports the plant in its ability to adjust to changing environments. First, we want our vines to develop deep roots, which lowers their dependency or surficial influences. Second, we have intensified the application of various teas; especially horsetail teas appear to strengthen the vine's natural capability to thicken the berry skin at high temperatures.
We have been adjusting our wine making in order to maintain long wine longevity by drawing on natural resources. We use maceration (softening and extracting various components from the grape skins by soaking) and oxidization (exposure of the grape and must to air) as a deliberate means to increasing the stability and life expectancy of our wines. Essentially, this is not much different from what Mosel winemakers did 50 years ago, when grapes where crushed at harvest in the vineyard inducing maceration and oxidization. However, in the past this was done mainly to save space, whereas we are now employing maceration and oxidization as deliberate methods to improve our wines.
There are many vintages that will last a very long time, such as 1949, 1959, 1976, and 2010. This may not be affected by climate change. However, we attain longevity now with a fraction of the sulfite used in the past due to new technologies.
Outlook
Overall, our vines do not suffer under current climatic conditions, and the positive effects of warming more than offset the negative effects of more extreme events and increasing humidity. I, therefore, do not think we will replace Riesling with more heat-tolerant varietals in the next decades.
B. Ernst Loosen
Dr. Loosen, Bernkastel-Kues, Mosel, Germany. Email: info@drloosen.com.
In Germany, and in the Mosel Valley in particular, climate change has so far exerted mostly positive effects on grape growing. In the past, this northern climate of ours was often far too cold, even for Riesling. Up until the late 1980s, we struggled to reach an average natural ripeness of 8% to 10% potential alcohol in the fruit. These days, the average is closer to 11%. This has given us the chance to produce ripe, well-balanced dry wines without the need for botrytis to increase the must weight.
In the past, even in good years, the fruit was often just barely ripe. In addition, there was always the risk of heavy rain or an early frost, which could reduce the crop yield significantly. My grandfather's generation was happy if they got three or four ripe vintages in a decade. Also, they had to accept that three to five vintages would be complete disasters, with sometimes no marketable crop at all.
Everything seems to be happening 3 to 4 weeks earlier now. Fifty years ago, we started the harvest in late October or early November. Now we usually start at the beginning of October and even earlier in warmer vintages. However, the growing seasons start earlier, too, including bud break and flowering. So we are still getting the 100 to 120 days of hang time we want to give us fully ripe flavors.
However, botrytis is also occurring earlier, which is not at all helpful when the fruit has not reached a certain minimum ripeness (72–75 °Oe). In the past, botrytis normally occurred late and concentrated very ripe fruit for the production of extraordinary sweet wines. When botrytis happens too early, it only concentrates the high acidity and green flavors in the unripe fruit, causing what we call “sour rot.”
It is not climate change that is affecting us adversely these days; it is the erratic and unpredictable changes in weather that worry us. We are getting cooler, wetter weather in spring and summer; violent, unpredictable storms; and more devastating hailstorms. These extreme weather conditions make it difficult to plan vineyard work and harvest decisions.
Our regional climate is definitely getting warmer, and we are harvesting earlier, but our fruit is still not overripe. The warmer conditions are giving us potential alcohol levels that are 1.0% to 1.5% higher than in the past, but it is still a struggle to achieve 12.5% potential alcohol (without botrytis) in all but the finest vineyard sites. However, we are happy about where we are now. Nobody wants to go back to the sour, unripe vintages of years like 1978, 1980, and 1984. Those were horrible, difficult years that put a lot of growers out of business. Also, the wines were hard, thin, and acidic. What would we do with such wines today?
One thing we are losing, however, is Eiswein. The general warming trend has definitely reduced the quantity of Eiswein we have been able to produce. More and more often, we do not get any at all in a particular vintage.
Rather than overripeness, we are more concerned about keeping acidity, which is the structural backbone of Riesling. We still have large diurnal temperature variations, giving us cool nights that help retain acidity. However, for certain wines, like Riesling Kabinett, we have been moving to cooler, higher-elevation sites in order to retain the bright, fresh acidity that defines that style.
I cannot predict where we will be in another 50 years, and I recognize that the global long-term climate trends are cause for serious concern. However, at least for now, the warming climate has been beneficial for us growers in the Mosel Valley. The weather patterns are changing, but the components—total rainfall, sunshine hours, and average annual temperatures—are not that different from those 30 years ago when I took over the estate. It is the distribution of those components throughout the year that is getting more erratic and less predictable.
So, all in all, climate change is not yet such a huge risk for us here in northern regions where we still have plenty of water and cool nights. There is no need for hysteria, and I find it a bit ridiculous that some people are already suggesting that we will soon need to rip out our Riesling to plant Syrah or whatever. There are still a lot of viticultural techniques we can use to adapt our traditional varieties to the changing climate. In addition to higher-elevation sites, for example, there is the very simple idea of hanging a larger crop to slow down the ripening. When we start to see average must weights in the 13.5% to 14% range on a regular basis, then we will have to think seriously about how much further we can go with Riesling.
III. England
A. Tamara Roberts and Matthew Strugnell
Ridgeview Wine Estate, Sussex, England. Email: Tamara@ridgeview.co.uk; Matt@ridgeview.co.uk.
Ridgeview Estate is located in Sussex, in the southeast of England. The vineyard was established in 1995. We grow Chardonnay, Pinot Noir, and Pinot Meunier, solely for sparkling wine production. The British Isles are well known for having unpredictable weather. Anecdotal evidence suggests that growing these classic varietals, in the past, was virtually impossible. The trend was to grow Germanic varietals such as Müller-Thurgau and Reichensteiner that ripen more easily.
Today, Chardonnay and Pinot Noir (together making up approximately 40% of the total planted area) are the top two varietals grown in the United Kingdom, with Pinot Meunier not far behind. Year upon year, they can perform exceptionally well, if they are given the degree of care and attention required.
Harvest Dates, Yields, Disease Pressure, and Quality
Harvest dates have not tended to fluctuate too greatly. Mostly, harvesting is taking place in the second week of October; however, there have been exceptions. Our earliest start date was in 2014 (September 30), whereas 2013 was one of our latest (October 21).
One difference we have noticed is a general increase in yield. With the exception of 2012, when flowering was severely affected by poor weather, we can now produce yields consistently at 9.5 t/ha. My feeling is that improvement in viticultural methods over the past two decades is the main contributing factor for this.
Another crucial difference that we have seen is that we now tend to look far more closely at acidity levels and cleanliness of the fruit when determining a harvest date, rather than sugar levels alone. It used to be a case of holding out for as long as possible to try and achieve 81 °Oe. By that time, we may either have lost too much crop due to rot or the acidity may have fallen too low.
Our main disease pressures have always been Uncinula necator, Plasmopara viticola, and Botrytis cinerea. The pressures from these vary from year to year; however, it is becoming more common to find botrytis earlier. More cases of Phomopsis viticola are spoken of, but this is only anecdotal.
We have generally seen improved ripeness and yields across all three varieties. I would say that Pinot Noir is the most sensitive to changes in temperature.
Viticultural Changes
We have had to adapt as yields have increased. We have to consider the potential for overcropping far more now than in the past, when it comes to pruning. We have also altered how we manage the canopy in order to reduce the risk of early botrytis infections. Also, as competition increases, we have to strive to maintain the highest level of quality.
Outlook
We get asked a lot by visitors how climate change affects us. Surely warmer weather helps us out? The truth is, the weather in this part of the world is so changeable that it is difficult to see a particular trend. Grape growing in England faces different challenges from year to year. For example, it may be an early bud burst (2007), making us more prone to frost damage. Conversely, it could be a bud burst late enough to considerably shorten the growing season (2013). One indicator could be the change in varieties planted, as well as better fruit quality. Is this down to climate change or improved viticultural methods?
Overall though, a trend in warming temperatures could only be seen as an advantage.
IV. Austria
A. Roman Horvath and Heinz Frischengruber
Domäne Wachau, Dürnstein, Austria. Email: r.horvath@domaene-wachau.at; h.frischengruber@domaene-wachau.at.
The Wachau is on the very edge of Austria's wine-growing zone. The climate is cool, even marginal, and harvests for dry white wines can run until mid-November. However, even in our cool Wachau region, wine-growing conditions have changed over the past 30 years. Flowering starts 2–3 weeks earlier than it did 30 years ago, and scientists anticipate a further increase in average annual temperature of 1.8–2 °C in our zone for the next 30–50 years.
Temperatures are increasing worldwide, but especially in central Europe the variances are what is most challenging for agriculture. In our climate, flexibility will be the key word in wine growing over the next decades. We will have to react and make decisions on a weekly basis and maybe even change strategy within hours. Reliable, established vineyard management patterns are no longer appropriate. A flexible approach is crucial, which depends entirely on the actual weather conditions and vineyard plots (different expositions, soils, altitudes, and, of course, varieties).
The very obvious effects of climate change that we are currently facing are dry periods, hot summers, extreme evaporation, sudden heavy rainfall, and generally unfavorable distribution of precipitation. What we have learned already is that no two years are ever the same and we should always expect the unexpected.
The years 2014 and 2015 are very good examples of how different two consecutive vintages can be. In 2014, almost uninterrupted rainfalls from early August until the middle of September brought extreme botrytis pressure and low sugar levels. After strict selection in the vineyards and four to five harvesting passages through each vineyard, we had lost 40% of our total crop. The year 2015 was the warmest ever in Austria according to the records. We had very little rain during the vegetation period, and sugar levels were already extremely high at the end of September. An emergency drip irrigation system, from which approximately two-thirds of all Wachau vineyards benefit, has become an important support tool in hot and dry years. On average, we use irrigation only every second or third year just to overcome periods of extreme drought. By no means at all is it a device to control or regulate yields and wine styles as in many New World regions.
In order to deal with such extreme variations, we have to be prepared for everything and analyze, plan, and work until the very last grape is in the cellar.
In our view, it is easier to take corrective actions in cooler vintages. In cooler years, we can intensify canopy management, green harvest, and so forth to balance yields. Warmer vintages require more experience, know-how, and intuition. More long-term planning is necessary to balance yields and in order to postpone the harvesting point and achieve a longer hanging time on the vine.
With the Wachau's special climate, we have always been challenged to work very flexibly. In our region, we grow grapes in two different major climate zones. On the eastern end of Wachau, we are influenced by the warm Pannonian climate, whereas the western end is dominated by the cool Atlantic climate—both within a short distance of only 15 km. In terms of ripeness and harvesting difference, this means that we start picking in the east 2–3 weeks earlier than in the west. In addition, we work on altitudes between 200 and 500 m above sea level.
Thanks to our past experience with challenging growing conditions, we have developed some strategies that we believe will also help us in the long run to face and stand up to the new challenges climate change will bring along for winegrowers.
What is already well established with us is to do several harvesting passages through each vineyard. Extreme vintages make it necessary to do even more selections and up to five pickings in each vineyard to harvest ripe, healthy grapes for the different wine styles we aim to produce.
We also believe that how we manage our soils will become even more crucial. Soil-specific cover crop helps us manage dry periods and periods of heavy rainfall. It ensures ground shading and contributes to humus formation. It grants additional flexibility and is beneficial to the soil.
We have already adapted the vineyard layout for new plantings. Rows have become narrower to enable additional shading of grapes.
Something we must not forget in this discussion is that the vine itself is a flexible plant. The vine will slowly but surely adapt to the warmer, dryer conditions and will support us in dealing with the new environment.
One thing we already know for sure is that the future will bring a lot of extra work for winegrowers, and we will need to be flexible, creative, and persistent to master the new challenges.
We do not see increasing average temperatures as a positive change per se. Less yearly rainfall, lack of winter precipitation, and dry soils in the spring are a serious problem. Warm winters cause previously unknown problems as there is no sufficient “natural” elimination of pests. For us, the increase in average annual temperature that we have seen over the past 30 years would be more than sufficient now; we do not deem a further temperature increase advantageous. In warm years (such as 2015), we luckily have the very cool pockets of the valley available such as the Spitz region or the vineyards on the southern bank of the Danube. Looking back on the past 10 years, we actually prefer the cooler years (not as cold and wet as 2014) to the warmer years.
V. Italy
A. Alois Lageder
Weingut Alois Lageder, Margreid, Alto Adige, Italy. Email: aloislageder@aloislageder.eu.
We have been thinking about climate change since the 1980s when models of global warming were still met with criticism and doubt. Regardless, we began to experiment with grape varieties that, at that time, predominantly grew in the warmer climates to the south of the Alto Adige region. Because viticulture is based on perennials with a productive lifetime of 40 or more years, we needed to think ahead. Therefore, these experiments seemed sensible to us.
In the 1990s, when we first noticed considerable and persistent changes in weather patterns and trends, we extended our trials and, in addition to new varietals, also included new vineyard sites.
After some difficult and rainy harvests in the 1990s, weather conditions have stabilized in the 2000s, resulting in several excellent vintages. In the short-run, the climatic changes in the Alto Adige region have certainly been to our viticultural advantage. However, we are concerned about further warming and possible long-term effects and are already preparing the viticultural conditions to meet this challenge.
Over the years, we have noticed various weather-related changes.
• The frequency of days with extremely hot temperatures has increased. (Note that the city of Bolzano has been known for a long time as one of Italy's hottest cities during the summer month, and the temperature trends of the past decades seem to underscore this.)
• Over the past years, we have observed a significant decline in diurnal temperature variations (i.e., differences between day and night temperatures), but South Tyrol and the characteristics of its wines have been known for relatively large diurnal temperature variations.
• We have also noticed a general increase in average temperatures and an increase in extreme events, long periods of rain or drought, and extreme heat and cold.
• There has been an increase in fungal diseases such as peronospora and mildew and a need for irrigation.
• Bud break, flowering, and véraison occur earlier than a few decades ago. Over the past 50 years, our harvest time has moved from October–November to September–October. When I was a child, harvest usually began at the start of October. In contrast, in 2003 und 2007 our harvest began on August 16. In the past, our harvest was not finished until mid-November, whereas in the past two decades the harvest finished by mid-October.
• The phenological intervals have shortened (i.e., the time between flowering and harvest has fallen from about 100 days to now 90 days in some vintages).
• The sugar content in the grape juice is significantly higher than in the past (with the potential of approximately 1% to 2% more alcohol in the wine); acidity levels are lower.
• Tight-cluster varieties are more prone to damage than are varieties with looser clusters. Likewise, varieties with thin berry skins suffer more than thick-skinned varieties.
• Some varieties, such as Rhine Riesling, which my father planted with great results at an elevation of 250–300 m, we now plant at 600–800 m.
• Nature and plants move to higher elevation and more northern latitudes in order to adjust to a warming climate. Viticulture needs to behave similarly. In the past, viticulture in Alto Adige ended at an elevation of approximately 900 m. In contrast, we now have vineyards at an elevation of 1,350 m.
• Of the numerous grape varieties we have experimented with since the 1980s, Viognier, Petit Manseng, and Tannat do particularly well. Due to their characteristics (i.e., lose berry clusters, small berries with thick skins, and high acidity levels), they seem to be especially resistant to warmer climates and yield excellent results. In contrast, Assirtico reaches full ripeness only in very sunny and warm vintages.
It is our objective to maintain the natural characteristics of our Alto Adige wines—elegance, finesse and structure, minerality and complexity—even in a changing climate.
This seems possible only if we show more consideration for our natural environment and employ methods that are close to nature such as the biodynamic approach. Strong and healthy plants may assist us in coping with warming weather and its increasing variability.
In 2005, we organized with Hans Glauber and Eco-Institute Bolzano a symposium on viticulture in the solar age, the so-called “Margreider Weingespräche” (Margreider Wine Talks). During that event, climatologist Hartmut Grassl rightly concluded that “only winemakers that are eager to try out new ways may gain from climate change.”
VI. Spain
A. Miguel A. Torres
Bodegas Torres (Miguel Torres SA), Vilafranca del Penedès, Barcelona, Spain. Email: prensa@torres.es.
Climate change is the greatest threat for the wine business in general, and for wine growers in particular, as vines are extremely sensitive to temperature changes. With rising temperatures, many agricultural products will continue to be cultivated without any noticeable difference to the consumer, whereas in the particular case of wine, quality will be affected.
Almost all wine producers in the world have noticed changes in the climate over the past decades. At Torres, for example, we have seen an increase of approximately 1 °C in the average temperature in our region over the past 40 years. This change affects our vines: the beginning of our harvest is now on average 10 days earlier than 40 years ago. So we can see that the vine is very sensitive to changes in temperature. The problem is that the different parts of a wine grape do not necessarily mature at the same rhythm. When the weather is warmer, the fruit of the grapes will become riper and sweeter earlier. However, the seeds and skins ripen slower, which causes a growing imbalance in maturity. So for the moment—let us say for the next 20 years—the key word and work is to delay maturation.
That is why we implemented a number of viticulture practices in order to delay the ripening of the grapes. We are doing, for example, experiments with different training systems, cover cropping, canopy management, plant density, and different rootstocks: in some of our vineyards, we have moved the distance between the soil and the cordon from 60 cm to approximately 90 cm, with good results in delaying ripening. We have seen the same result with cover crops in comparison with tilling. Moreover, experiments with less planting density and less canopy have both led to the delay of ripening. However, it is also very interesting to see that the use of different rootstocks can help the delay of maturation.
However, if the temperature rises 4–6 °C by 2100 as many scientists forecast, we would be heading for big problems and changes. I do not think this would mean that vine growing would disappear from our home area Penedès (near Barcelona), but most likely we would have to replant toward grape varieties that are highly resistant to high temperatures and water stress or select the individual vines that can cope with the higher temperatures.
For that reason, we already planted vineyards in cooler areas such as the Pre-Pyrenees, where we have more than 100 ha at approximately 1,000 m altitude, which give excellent results. Because of the challenges posed by climate change, in 2012 we bought another piece of land at approximately 1,200 m in the Pyrenees, but where it is still too cold to grow vines. For the same reason, we also bought 230 ha in the Itata Valley in southern Chile, where we plan to grow red varieties in the future.
As an experiment we also planted some unnamed varieties from our project to recover forgotten pre-phylloxera grape varieties. One of the interesting characteristics of these grape varieties is that they are very resistant to drought, which could be a very good advantage in the context of climate change. We began the project of reviving ancestral varieties in the early 1980s, and we managed to bring back 40 varieties that had previously had been cultivated in Catalonia but had practically disappeared in time. Only seven of these varieties display strong enological potential, which include Querol, Garró, and Selma Blanca; in September 2015, Moneu and Gonfaus were added to the list, which are also very heat and drought tolerant. Last year, we decided to broaden the scope of this project and are now also searching for unknown varieties outside of Catalonia, specifically in La Rioja, Rueda, Ribera del Duero, and Rías Baixas.
We are really standing at a crossroad, and it is a crossroad about our future and the future of the next generations. The model of our world economy seems to tick too many times in terms of “profit at any cost.” Today, many of us act taking only this generation into account, but we should really start to act taking several generations into account. We need to act as individuals, as groups, as countries, but also as companies.
VII. Argentina
A. Laura Catena
Bodega Catena Zapata, Mendoza, Argentina. Email: licatena@catenazapata.com.
Projections based on the Intergovernmental Panel on Climate Change (IPCC) data predict temperature increases in the 2.0–2.5 °C range by the end of the century (2090–2099) and, in a worst-case scenario, increases as high as 3.0–3.5 °C.
Equally as important are the projected changes in rain patterns and water availability. In part related to the El Niño–Southern Oscillation (ENSO) phenomenon, the IPCC predicts a 10%–20% decrease in the rainfall over the Altas Cumbres (High Mountain) glaciers and a 20%–40% increase in summer rains over the eastern Andes including the region of Mendoza where 70% of Argentine wine is made. A decrease in rains is predicted for Patagonia in the south.
The reduction in high mountain water is particularly relevant for vineyards that rely on underground aquifers where levels have dropped significantly since 1990. Because of increased water use by cities and suburbs, it is difficult to tell how much of the drop is due to a decrease in high mountain snow levels and how much is due to greater usage.
There are concerns that a projected increase in summer rains over the eastern Andes might pose a phytosanitary threat to viticulture during the critical summer harvest months. However, even a 40% increase in rain over the current average of 200 mm per year does not change our region's status as a high-altitude desert.
Predictions do not always come true: in 2015, Mendoza saw the largest amount of winter snowfall in 50 years, and the snow-covered area in the Altas Cumbres reached historic highs.
Over Two Decades of Cool-Climate Research
More than 20 years ago, a famous French producer from Bordeaux told my father, Nicolás Catena Zapata, that one of our Cabernet Sauvignon wines from a vineyard in the classic region of Lujan de Cuyo tasted like a Cabernet from the Languedoc. In the 1990s, my father was not yet aware of climate change; his search for cool climate was aimed at discovering climates more similar to those of the cooler European regions. He became obsessed with finding the cool-climate limit of vine cultivation in Mendoza and planted vineyards so far west toward the Andes and so high at 1,500 m elevation that people told him his vines would never ripen there.
In the times of my Italian immigrant great-grandfather, Nicola Catena, the lower altitude eastern part of Mendoza was considered temperate; Lujan de Cuyo (where the Languedoc styled Cabernet came from), very cold; and the high altitude Uco Valley where today our family's best vineyards are located, so cold and prone to frost that only a crazy person would plant vineyards there.
Today, while temperatures throughout Mendoza slowly creep up, our family's vineyards lie in regions with average temperatures 4–5 °C cooler than in my great-grandfather's time. My father's initiative was led by a desire to make wines of high natural acidity and tannic content, wines that would be able to age as well as a fine Bordeaux could.
Crop Trends
Yields
Overall, our yields are lower than what they used to be, but this is more related to our quality initiative than to nature. We continue to see the historic variation in vintage size related to frost, Zonda winds, hail, and rain.
Brix and Harvest Dates
There has been a general increase in brix over Argentine vineyards as a whole documented by the Argentine National Viticulture Institute (INV). We think this trend is more likely related to the search for concentration than to a change in climate. At Catena, we have been harvesting earlier and with lower brix than we did in the 1990s. This trend is related to our search for fresher, less alcoholic wines.
Disease Pressure
Although climate change predictions are projecting an increase in summer rains, we are not experiencing an increase in peronospora and botrytis, the organisms that are generally associated with rain. We are seeing an increase in powdery mildew, possibly related to water scarcity, and we have a new vine plague in Mendoza, lobesia.
The New Cool-Climate, High-Altitude Regions of Argentina
A decade ago, I asked myself, what if we could use the knowledge that we acquired in the search of cool climate to discover new regions for viticulture in Argentina?
In the mid-1990s, I was a physician working at a prestigious academic hospital in California. After seeing the difficult road that lay ahead for my father in elevating Argentine wine, I decided to join him at our family's 100-year-old winery. Because of my background in research, I was immediately attracted to the scientific side of what my father was doing, challenging notions about where to plant and what to plant and pretty much everything about how wine was made in Argentina. The large, mostly Italian immigration to Mendoza of the early twentieth century (which included my great-grandfather) had turned Argentina into the largest wine producer in South America and the fifth-largest producer in the world. Yet, most wine was made in the traditional oxidative Italian style and consumed locally.
At that time, Malbec, the variety that today represents Argentina in most people's minds, was only known as an obscure French variety. Malbec had been famous throughout the Middle Ages as the favorite of Eleanore of Aquitaine. In Bordeaux, it was an important component of the blend until the late nineteenth century when it lost favor to the earlier ripening Merlot. I handpicked a group of winemakers and viticulturalists to create what today is called the Catena Institute of Wine, and we began to study every aspect of Malbec and high-altitude viticulture and wine making. We soon realized that ancient selections of Malbec brought to Argentina from France in the mid-1850s were incredibly heterogeneous with dramatic yield differences and harvest brix variations of up to 4°. Our first project was to make a selection of quality Argentine Malbec, choosing the plants with the smallest berries and bunches, most intense flavors, and balance in terms of natural acidity and alcohol/phenolic ripeness.
Today, we are reevaluating the adaptability of this selection to our different vineyards at various altitudes and latitudes, which range from zone I to zone IV in the Winkler classification. We are conducting a reselection process to evaluate which cuttings do best in each micro-terroir.
There is much talk in the academia of climate change about different varieties being planted in traditional wine regions. However, I ask myself, what if the same variety could be adapted to different climates by making selections of existing populations to find those best adapted to cooler, warmer, drier, or more humid climates? The exploration of regionally adapted Vitis vinifera plant selections would also need to incorporate the thoughtful use of rootstocks; today, most vineyards in Argentina are own rooted.
Why Viticultural Freedom Is Needed to Approach Climate Change
The famous Bordelais winemaker Michel Rolland once said: “If there is anywhere a place that encompasses the perfect match of climate, soils, costs, human resources, and, above all, freedom for creativity and minimal bureaucracy to hinder the genuine development of a new and exceptional viticulture, that place is undoubtedly Argentina” (Catena, Reference Catena2010, p. 134).
Argentina is the eighth-largest country in the world, and the Andes is the largest mountain range on the planet. The vineyards of Argentina span 2,000 km from north to south in the foothills of the Andes Mountains. Today, the Adrianna Vineyard, planted by my father in the early 1990s at almost 1,500 m elevation, has become the source of our most distinctive and age-worthy wines. What if similar high-altitude terroirs could be found farther north and farther south in areas not yet explored for viticulture?
One such place is our new vineyard in Angulo, La Rioja, Argentina, north of Mendoza at 1,800 m elevation. The water source is stable from the Famatina mountain range east of the Andes, and there are not too many cities and farms with which to share the water. The quality of the Malbec, Syrah, and Cabernet Franc from this area at 5 years is already promising.
Another area with abundant water and protective winds is La Pampa province in northern Patagonia where the cool climate is ideal for many varieties. We are just starting to decide which varieties besides Malbec might be well suited for our new vineyard in this region.
It is important, however, to not forget the livelihood of some of our traditional wine-growing regions. Our mission grape equivalent, the native criolla, a grape normally used for table wine, is showing some promise in refreshing rosés that can be drunk in the warm summer months. Finding a quality option for this variety could bring prosperity to the warmer parts of Mendoza in the east that have been abandoned for the cooler-climate regions of the Uco Valley. Trials with Argentine Bonarda (also known as Charbono or Charbonneau de Savoie) are promising, and Tempranillo, Chenin Blanc, and Syrah can also do well in these warmer areas.
The Gift of High Altitude
Our primary objective in planting at higher altitude was to find a cooler climate, but we also faced an increase in sunlight, and initially, we did not understand whether its effects would be positive or negative for quality.
Foreign consultants had given us the advice to remove leaves and “open the canopy,” but the resulting burning of the berries yielded cooked and unpleasant flavors. We conducted a study in which UV rays were blocked by transparent nets, but overall sun and temperature remained equal. We found that grapes exposed to natural sunlight in the Adrianna Vineyard at 1,500 m elevation had higher polyphenol content. Our hypothesis is that the vine increases the production of polyphenols as a sort of sunscreen to protect the seeds. It will be interesting to see what happens if and when the Southern Hemisphere ozone layer hole closes as predicted in 2020.
Water Conservation
At the time of my grandfather, all vineyards in Mendoza were farmed with flood irrigation. One of my father's first initiatives in his quality revolution was to bring drip irrigation from Israel to Mendoza.
In our family vineyards, I would estimate that water usage is 25% of what it was in my grandfather's time because of the move to drip irrigation. Given potential water shortages in the future, it is important that all of Argentina's vineyards and orchards in water-shortage areas move to drip irrigation.
In 2010, we worked with Bodegas de Argentina, the INV, and the Universidad Nacional de Cuyo to develop the first Sustainability Protocol for Argentina. The protocol provides a framework for wineries to make the best use of water.
Another important discussion about water regards the relative disdain that European wine producers have for irrigation. We need to be cognizant of the significant climate and terroir differences between regions. Many European vineyards have abundant underground aquifers, and any amount of excess rain or irrigation will lead to a decrease in quality. The underground aquifers in Mendoza are hundreds of meters deep, not available to the vine roots. The plants live under constant stress, a situation that might contribute to better quality. The water used in irrigation is from the pure Andean snowmelt.
VIII. United States
A. Paul Draper
Ridge Vineyards, Cupertino, California, United States. Email: wine@ridgewine.com.
In 1962, we reopened the nineteenth-century Monte Bello Winery in the Santa Cruz Mountains and produced our first Cabernet Sauvignon from vines replanted in the 1940s. The vineyards are located between 1,300 and 2,700 feet above sea level, and the higher ones within sight of the Pacific Ocean, 16 miles to the west. The site is on the battle line between the mediterranean climate of San Francisco Bay and the maritime climate of the Pacific.
In the past 15 years, the number of days when the fogs off the ocean have swept over us in summer has increased from 5–8 times to 18–25 times. In this past decade, we had the two coldest growing seasons since the mid-1940s and then, with the drought, several of the warmest winters of the past 56 years.
Yields, Acidity, Alcohol
Yields have increased in the newer vineyards where we are planting three times more vines per acre than we did before 1988. Otherwise, yields have remained stable over 50 years. Disease pressure has remained low. Today, all but a few acres are certified organic; quality has remained high. Our 1970, 1974, and 1978 Monte Bello's showed beautifully in New York this past October. A number of our recent vintages should match them when they reach 30–40 years of age. Natural acidity remains firm and unchanged at approximately 3.45 to 3.55 pH in the finished wines after natural malolactic.
In the 1960s, alcohols averaged 12.3%, not counting one underripe vintage and one vintage declassified on quality. In the 1970s, the average came up 0.35% to 12.65% with one vintage declassified on quality. In the 1980s, the average was identical to the 1970s at 12.65% with one vintage declassified and two vintages underripe. In the 1990s, the average increased 0.3% to 12.95% with no vintages underripe. In the 2000s, the average increased 0.4% to 13.35%. From 2010 to 2014, the average remained at 13.35%. Our alcohols have increased from the 1960s average of 12.3% to an average of 13.35% though 2010 to 2014, an increase of 1.1% over 52 years. In the first 27 vintages, 4 were underripe. In the past 25, none were underripe.
Until 2013, 2014, and 2015, the second, third, and fourth years of drought, our harvests in the Santa Cruz Mountains started, at the earliest, around September 20 and ended, at the latest, around November 3. In the past 3 years of warmer winters and early bud break, we have started as early as September 2–9 and finished by September 24–October 9, a radical change.
Water
Over the past 7 years, we have moved to certified organic in virtually all blocks of our estate vineyards. We are permitted to irrigate. However, despite virtually no rain from June to October in California, once fully established with deep roots, which takes 8 to 10 years of three irrigations a year, the vines are not irrigated and typically have not been over the past 60 years. We measure sap flow to determine whether a vine needs water. During the fourth year of the current drought, we gave one irrigation to 4 of our 35 established vineyard parcels. There are no limitations on what varietals we can plant, but we limit ourselves to the Bordeaux varietals and a very small amount of Chardonnay. Located this near the Pacific Coast, we expect a moderate increase in growing season temperatures, but not at all extreme.
We are drilling 3-foot-wide reverse wells to send storm water into the aquifer rather than have it run off to the bay. In addition, we have begun to dig retention ponds to capture water before it can run off. We have a bioreactor that allows us to recycle all winery wash water, but we are dependent on our aquifers, and if extended droughts become more common, it could present a serious problem.
B. Marimar Torres
Marimar Estate Vineyards & Winery, Sebastopol, California, United States. Email: marimar@marimarestate.com.
I was born in Barcelona, Spain, and moved to the Unites States in 1975. However, it was not until 1989 that I began to make my own wine. A few years later, in 1992, Marimar Estate Vineyards & Winery was built. We are located in Sonoma County, at the southwestern edge of the Russian River Valley, approximately 15 miles linear distance from the Pacific Ocean, and specialize in Chardonnay and Pinot Noir. For our Pinots, we use Dijon clones as we prefer the European wine style with an alcohol content of not more than approximately 13.5%. We have been organic since 2003 and turned biodynamic in 2010.
Over the past 26 years, I have not noticed any consistent trend toward increasing growing season temperatures. In fact, in the past years, we have rather seen an increase in frost days. However, we have experienced a significant rise in weather variations from vintage to vintage as well as during the growing season. For instance, 2015 was the year with the earliest harvest for Marimar Estate, and 2014 was the year with the latest harvest. These growing weather irregularities and extremes require a lot of attention in the vineyard and in the cellar.
Being organic and biodynamic, you need to pay even closer attention to the grapes and the wine-making process. Over time, we have become a bit more selective with respect to our fruit.
Maybe we are more precise that in the past. However, I am not sure whether this is induced by climatic factors.
Over the years, the character of our wines has not changed. We make the same Pinots with the same alcohol contents we made 26 years ago. I think, so far, our wines have not been affected by global warming.
In 2002, we planted a new vineyard, named Doña Margarita, in the Sonoma Coast area, just 5 miles from the Pacific Ocean. Here on the West Coast, temperatures drop by 1 °F with every mile you move closer to the ocean. Fruit from the Doña Margarita Vineyard ripens later than at the winery. First, we tried to grow Albariño there, but, in fact, it was not warm enough, and the grapes did not ripen properly. We then moved the Albariño closer to our winery and planted the Doña Margarita vineyard with Pinot Noir.
Outlook
I do not think we will feel any detrimental effect from global warming in the near future. Sonoma County is relatively cool and benefits from the close proximity to the Pacific Ocean and its cooling impact. If it gets too warm, the vineyard will most likely move close to the coast.
I am more worried about weather variability and extreme events, but these are hard to predict.
C. David Adelsheim
Adelsheim Vineyard, Newberg, Oregon, United States. Email: dadelsheim@adelsheim.com.
The Willamette Valley AVA stretches 137 miles (220 km) north–south from just north of Portland, Oregon, to just south of Eugene, Oregon, and 72 miles (116 km) east–west from the foothills of the Cascade Mountains into the foothills of the Coast Range. The AVA comprises the portion of the drainage basin of the Willamette Valley, in which it is thought the wine grapes can ripen, generally stated as everything below a line drawn around the valley at 1,000 feet (300 m) above sea level.
The Willamette Valley celebrated the 50th anniversary of the planting of the first wine grapes since Prohibition in 2015. In that period, plantings have grown to 19,295 acres (7,808 ha), and the number of wineries has grown from a handful, producing wines from fruits other than vinifera grapes, to 507. In those 50 years, even though we still produce less than 1% of wines in America, the region has gone from being unheard of by most Americans to being widely known for production of distinguished Pinot Noir wines. However, outside the United States, the valley's wines are still almost unknown.
The north Willamette Valley is the northern half (72 miles, 116 km) of the longer valley. The hillsides of the north Willamette Valley are where most of the grapes in the Willamette Valley (86%) and Oregon (60%) are planted. It is also home to 57% of the state's population and two-thirds of its wineries.
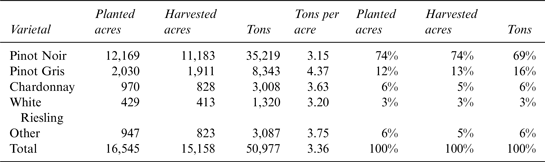
Vineyard data from the 2014 harvest (Southern Oregon University Research Center, 2015) show how skewed wine production is in the region—almost three-fourths of the acres and 70% of the tons harvested are from one variety, Pinot Noir (Table 2). This is one of the highest concentration on a single variety in a New World wine-growing region.
2014 Vineyard Data North Willamette Valley
Source: Southern Oregon University Research Center (2015).
The reputation built for the wines of the Willamette Valley has been based on our traditionally cool climate. Our temperatures have been those of a northern European wine region—cool winters with some snow; short, somewhat hot summers; and long springs and autumns. The rainfall pattern, however, has been that of southern Europe with wet winters and very dry summers. Average participation has been approximately 40 inches (1,000 mm) per year (which sounds like a lot, except that it is so skewed to the winter). Harvest was usually in October.
Global climate change has certainly affected us. Although it has become incontrovertibly warmer, our climate has also become more extreme and more variable. Within 5 years, we have had our coolest growing season (2010), our latest harvest (2011), our warmest growing season (2014), and our earliest harvest (2015).
One of the things that has amazed me most about these four vintages is that, although the wines from the 2010 and 2011 cool/late vintages have different aromas, flavors, and feels than the 2014 and 2015 warm/early vintages, all four wines have the telltale signs of our unique cool climate—acidity, fruit freshness, and smooth tannins. Given the 7-week difference between the earliest and latest harvests, it appears that the wine-making process must be making a contribution to the “cool-climate-ness” of the wines of the north Willamette Valley. One obvious contribution is that in warm vintages, we are trying to pick grapes at the earliest point of ripeness, just when green tannins seem to have left the grapes. In the cooler vintages, we would take advantage of any sun that remains to extend the hang time on the vine. Wine making cannot make a wine from a cool vintage taste like one from a warm vintage (or vice versa), but it can narrow the extremes.
Harvest Dates, Acidity, Sugar, Yields
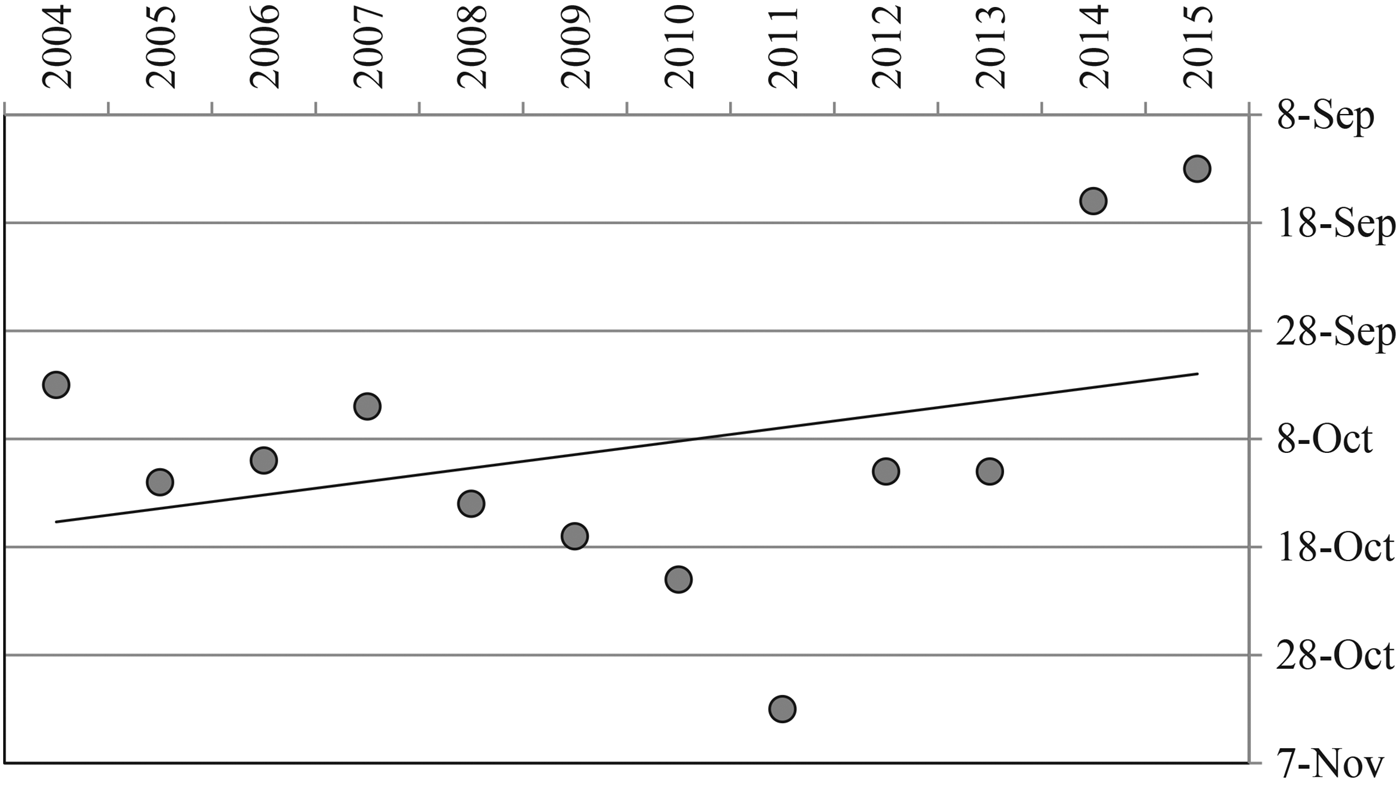
Picking dates, acidity, and potential alcohol have been affected by global climate change in the way one would imagine. Figure 5 shows the picking dates for Block 1 at our Quarter Mile Lane Vineyard. It is our oldest remaining Pinot Noir planting from 1974, so vine age is having no effect on picking date. However, the rapidly advancing trend line (showing a 2-week advance in picking date during the 11 years) may be too heavily influenced by the last two warm/early vintages.
Picking Date, Pinot Noir, Block 1 Quarter Mile Lane, 12 Vintages (Adelsheim Vineyard)
Acidity goes down in warmer vintages, as expected, and sugars at harvest need to be carefully monitored to ensure that our alcohols do not unbalance our wines. Obviously, acidity, sugar, and alcohol can be adjusted during wine making, though we would prefer to do as little tinkering as possible.
Yields have been artificially managed since the late 1980s in the Willamette Valley by pruning long (in case of poor set during bloom) and then removing crop to arrive at what we believe will ripen and give us intense wines. The perfect vintages (i.e., those in which the best wines are made) are those in which the crop levels are naturally limited by bad weather at bloom and those that are not too warm or too cool—like 2008. Disease pressure in Oregon is still mild, since vinifera vines are a relatively new crop. Ever-present diseases like powdery mildew and botrytis are affected more by moisture than by hot or cold growing seasons.
Changes in the Vineyard
Our winery is, perhaps, a microcosm for the industry in the north Willamette Valley. In the past, we have planted other varieties—mostly cool-climate varieties, such as Auxerrois, Pinot Blanc, Gamay Noir, and Riesling, as well as grapes grown in moderate climates, such as Sauvignon Blanc, Merlot, and Syrah. All can ripen, though the wines from a moderate climate variety sometimes do not taste the way the public expects for that variety. In any case, over the next 5 years, we are pulling out all varieties except Chardonnay and Pinot Noir, which we believe will remain the varieties for which the Willamette Valley will be known for the next generation or two. So far, the market for cool-climate Pinot Noir has been so strong as to prevent any significant experimentation with other red grape varieties.
Any changes in the vineyard are pretty subtle, mostly having to do with trying to pick earlier in warm vintages (and later in cool vintages). I suspect that, in future plantings, we will try to limit the use of rootstocks that ripen grapes earlier, like Riparia Gloire. We may try out new rootstocks that could ripen grapes a little later, like 99R, 5BB, and 4453. As we look for new vineyard sites, we will generally look at higher elevations, 600–800 feet (180–250 m) above sea level. We are also less afraid to plant vines on slopes with a slight northern exposure as a means of reducing heat in the vineyard.
Irrigation
A winegrower in the north Willamette Valley can legally irrigate if he or she has access to water and rights to use that water for irrigation. In the past, such rights were relatively available. No vineyards in the north Willamette Valley have access to public waters, as winegrowers were pretty late arrivers. Thus, water access depends on geology and soils. Wells are the most common source of water, but use of well water for irrigation is often not allowed. Reservoirs appear to be the most dependable source for irrigation water for vineyards.
In the first 50 years of wine-grape growing, few vineyards have relied on irrigation. Those that have legal access to water have used irrigation primarily to help establish vineyards. Most Pinot Noir vineyards older than 10 years are not irrigated. Once the vines roots are established, they can find sufficient water to make it through our droughty summers. There is the beginning of research work at Oregon State University on the flavors that seem to derive from excess drought stress on Pinot Noir vines (tequila aroma). There is thought in the industry that white grapes are more susceptible to drought stress; thus, Pinot Gris, Chardonnay, Riesling, and other white grapes are often irrigated in the driest, warmest summers.
Are Some Varietals Affected More than Others?
The wines we produce from our remaining Syrah vines are certainly closer to what people expect from wines labeled “Syrah” when we have warmer vintages. Otherwise, I do not see any of the true cool-climate varieties being affected more than others.
Outlook
It is hard to imagine a future north Willamette Valley that becomes unrecognizable (viticulturally) in the next 25 to 50 years. As in parts of Germany and France, global climate change, so far, has made growing grapes in the Willamette Valley a little less chancy. However, even though it is warmer now (and will continue to become warmer for a very long time into the future), the variations from one vintage to the next are greater than in the past. These climate extremes require more understanding of techniques to deal with grapes subject to drought, heat, monsoons, cold, and whatever else is throw in our way, as well as techniques to make the wines from grapes grown in these extremes.
So far, the wines still approximate the wines we have made over the last 40-plus years. The huge increase in our mastery of growing grapes and making wines in our place has ensured that the best wines being made here are those of our current set of vintages. Can our learning continue to offset the effects of climate change? The answer is, probably, not in the long term.
After we move our vineyards up our hillsides and around to the north sides, we may still have one more arrow left in our quiver. We could make wines—Pinot Noir wines—that start to taste a bit more like those from places warmer than the Willamette Valley.
D. Frederick Frank
Dr. Konstantin Frank Wine Cellars, Finger Lakes, New York, United States. Email: ffrank@drfrankwines.com.
My family and I have been growing vinifera grapes on our farm in Hammondsport, New York, since 1958. My grandfather Dr. Konstantin Frank planted these vines on phylloxera-resistant rootstock, and they are now among the oldest vinifera vines in the United States. These old vine vineyards help us to produce excellent quality wines.
We have learned that the cool climate of the Finger Lakes is an ideal match for the northern European wine grapes. Riesling is our number one variety, and it performs very well in our region. In 2012, the U.S. Department of Agriculture (USDA) released a new Plant Hardiness Zone Map due to the observed temperature increase around the United States. Growers in the cool-climate region of the Finger Lakes are utilizing the extra heat (growing degree days [GDDs]) and the longer growing season to more fully ripen their grapes. This results in higher sugar levels at harvest.
Cornell University at its research station in Geneva, New York, has been tracking GDDs. Their research shows how the 10-year average for GDDs in the Finger Lakes has increased over the past 10–12 years. From 1983 to 2002, their 10-year average GDD accumulation was pretty steady at approximately 2,400 GDDs. As of 2014, it was approximately 2,630 GDDs—almost 10% greater. The number will probably go up more after this season because it has been a warmer than normal year.
In addition to significant GDD increases, we are seeing earlier harvest dates, higher brix, lower acidity, and greater complexity in the wines. These changes have contributed to improved quality and higher critical acclaim of our wines.
Unfortunately, this warming trend is also generating winter temperature volatility. This is apparent in the extreme low temperatures we received in the winters of 2013–2014 and 2014–2015. It is believed that these low winter temperatures were caused by the polar vortex. This is described as a large mass of frigid air from the northern polar regions being pushed farther south into the northeastern United States causing very low temperatures. Low winter temperatures can cause damage to the buds, canes, and trunks of tender vinifera vines.
Our last experience with extremely low winter temperatures occurred 10 years ago. We responded by planting and developing a new vineyard in a warmer region of the Finger Lakes on Seneca Lake. This nicely sloped vineyard location is moderated by the deeper and larger lake and allows us to grow more tender varieties. In addition, we follow a practice at all our vineyard locations of hilling up a mound of 1 foot of soil around the base of the vines. This soil acts to blanket and protect the graft union and basal buds from the winter cold. Every spring, we plow away the soil from the vines to prevent rooting from the scion.
In summary, I believe that climate change has been both a benefit and a challenge to us. We appreciate the warmer temperatures in our cool climate resulting in wines with higher alcohol and greater complexity. On the other hand, we are challenged by the greater volatility and possibility of extremely cold winter temperatures due to polar air movements.
E. Lawrence Coia
Coia Vineyards, Vineland, New Jersey, United States. Email: njwineman@comcast.net.
“Longer growing seasons, milder winters, more frequent flooding, heavier rains, and hotter summers are some of the expected impacts that New Jersey farmers … will see more of due to climate change” is the recently published conclusion of the Climate Institute at Rutgers University regarding climate change and agriculture in New Jersey (Rutgers University Climate Institute, 2016, p. 1).
Has climate change affected our grape-growing region? Indeed it has, but it is difficult to say whether it has been for the overall good of the regional grape industry. We have been provided a relatively small observational window to examine the effects of changes in climate on grape growing. Although our region has one of the nation's oldest continuously operating wineries, Renault Winery, which started in 1864, and the Welch's Grape Juice Company got its start in Vineland in the 1860s, we have been operating our commercial vineyard, Coia Vineyards, only since 1975. This past 40-year period represents our viewing window and includes the effect of climate change on V. vinifera, the major wine-producing species that prior to that time was rarely grown in our region.
Our vineyards are located in the Outer Coastal Plain AVA, which comprises more than 2.2 million acres in southern New Jersey. The region received its federal AVA designation in 2008 and comprises more than 40 vineyards and wineries. We are youngsters in the industry but full of energy and interest and have demonstrated ability in producing world-class wine.
Climate is the major environmental determinant for grape growing. Soil is also of importance but is secondary to climate. In our location in the mid-Atlantic region of the United States, we have been blessed with very good soils for grape growing—sandy and gravely loam that drains well and helps keep vine roots from excessive water exposure. For us there are three major climate factors that help determine grape quality and vineyard health. The two of importance during the growing season are temperature and rainfall. The third factor of concern occurs during the dormant season—winter low temperature that might result in vine injury or vine death. We will briefly examine each of these three as we attempt to assess the effects of climate change for our region and the grape varieties we have grown over the past several decades.
The production of flavors and sugars and reduction in acidity needed for quality grape production is temperature dependent. Photosynthesis is slow with temperatures below 50 °F and above 90 °F. GDD is a type of measure of heat accumulation during the growing season that is often used in assessing suitability of a grape variety for a region. Our vineyard has a GDD average of 3,550 (or just under 2,000 when using a Celsius base) corresponding to Winkler zone IV (hot). We average 25 days with high temperature above 90 °F during the growing season. There are two temperature-related observations we have made at our vineyard over the past four decades: GDD and the variation in daily temperatures are both increasing.
Rainfall is a near certainty every month of the year in our region, averaging 3–4 inches a month. Accompanying this, the humidity in the summer can be a nuisance as it fosters the growth of several grape diseases. Rainfall early in the season can affect bloom, disease pressure, and crop yield. Most worrisome for grape quality is when significant amounts of rain occur after véraison and preharvest in August and September. Although average monthly rainfall is an important measure, it is also important to understand that 3 inches of rain in 1 day may be less harmful to grape quality than a half inch of rain daily for 6 successive days or even 6 days spread over a month. It is also less likely that the sun is shining when it is raining, so the benefits obtained from sunshine are greatly diminished in rainy seasons. At our vineyard, there has been no discernible trend of increased rainfall or decreased rainfall during the growing season; however, there does appear to be a greater daily variation in the amount of rainfall received. It is also possible that rainfall in August through September is decreasing, which would be a favorable change.
The relatively favorable climate, soils, and demand for different wine varieties has resulted in more than 80 grape varieties grown commercially in New Jersey, including Vitis labrusca, V. vinifera, and interspecies hybrids. At our vineyard, we have concentrated on V. vinifera and several interspecies varieties. Although award-winning whites have been produced from whites like our Chardonnay, the climate and soils of our AVA are particularly well suited for the red varieties Cabernet Franc, Cabernet Sauvignon, Merlot, Syrah, Petit Verdot, and Chambourcin. In fact, we have developed a proprietary blend, Coeur d'Est, based on these varieties. Our wineries may adjust the component variety percentages of Coeur d'Est annually. This is important for several reasons, one of which is that we do experience significant seasonal variability in climate, which may favor the quality of one or more of these varieties and its use in the blend. For example, Cabernet Franc and Chambourcin have been very consistent producers of high-quality grapes annually, but Cabernet Sauvignon, which ripens late and is less tolerant of rainfall during ripening, may not be of sufficient quality to be included in the blend every year. In fact, we have carefully examined the quality of Cabernet Sauvignon wine produced for more than 36 vintages and found that more than half the vintages produced premium or super-premium wines, a third produced “adequate-quality wine,” and 5 vintages were of poor quality. As shown in Figure 6, we found the ability to produce high-quality Cabernet Sauvignon wine is a function of annual GDD and August rainfall. In particular, we found a greater than 95% probability that an “average year” in terms of GDD and August rainfall would produce adequate or better-quality wine (Ward and Coia, Reference Ward and Coia2015).
Probability of Adequate, Premium, or Super-Premium Wine from Cabernet Sauvignon as a Function of August Rainfall and Annual Growing Degree Days
The third major climate factor for us is the minimum winter low temperature that the vine experiences. Unfortunately, some vine varieties can be severely injured at low temperatures, particularly below 0 °F, and it may only take an hour of such low temperature to cause vine or bud damage, which can result in decreased fruiting ability or even vine death. Our vineyard, and many of the vineyards of our AVA, is located in USDA winter hardiness zone 7, which means our minimum winter low temperature averages between 0 and 10 °F. We have tracked winter low temperatures, and the trend has been for an increase in both the average winter temperature and in the minimum winter low temperature. Although an increase in such winter temperatures may be viewed as a positive factor, this increase is likely accompanied by an increase in the variation of annual minimum winter low temperature and in daily temperature variation during winter dormancy that can be injurious or deadly to the vine. For example, regarding minimum lows, for the first time in 20 years in 2014, we experienced 2 days with low temperatures below 0 °F, which caused significant injury in approximately 2% of our vines, including vine death particularly in low-lying areas of the vineyard. An increase in variation in winter temperature as also occurred in 2014 can cause increased vine winter injury via vine deacclimation from increase in temperature and damage via subsequent lowering of temperature even without that lower temperature falling below 0 °F.
Other climate factors that can significantly affect vineyard grape quality and sustainability include damage by wind, hail, hurricane, or tornado. Although we have had no significant problems with hail or tornado or even Superstorm Sandy, which in 2012 passed directly over the vineyard, we have had damage from wind. In 2012, we also had a derecho pass through the vineyard with straight-line winds of approximately 100 mph that brought down several rows of vines and trellising. Although the vines were not damaged, this was an added expense caused by winds with speeds that we had never experienced before.
In conclusion, although the increase in growing season temperatures may have contributed to an overall enhancement in the variety and quality of grapes we can produce, it has been a relatively minor factor. Improvements in grape variety and site selection, canopy management, and understanding of disease and insect management have been much larger factors in our ability to produce world-class wine. Agriculture in general is an important contributor to climate change due to greenhouse gas emissions. In this regard, however, viticulture is superior to most other forms of agriculture in our region as it requires far less irrigation and fertilization. Viticulture does have a future as a sustainable form of agriculture here. For New Jersey grape growers, the major concerns brought by climate change will be those due to the increased variation in factors such as daily temperatures, rainfall, and wind speed. The future of viticulture in our region will lie in our ability to adjust to such variations wrought by climate change, most of which are detrimental to sustainability.
IX. Australia
A. Brian Croser AO
Tapanappa Wines, Piccadilly, South Australia, Australia. Email: bcroser@adelaide.on.net.
The evidence of accumulating greenhouse gases is irrefutable, and the sequitur of increasing global temperatures seems inevitable. Climate change is coming at us in a decadal timescale.
We all know climate is different from weather, and to judge one by the other is a strategic mistake. The differentiation of weather and climate is, however, confused by climate politics using weather events as evidence of global warming. Climate change and the frequency and intensity of weather events may be causally linked, but as a vigneron, managing vintage by vintage, I am more focused on weather events and shorter-term climate cycles than climate change. My interest in climate change and its implications for my grandchildren are real but largely separate from the management of my vineyards.
I have vineyards in three widely separated cool-climate regions of South Australia (growing season heat summations, GDDs equal to or less than Bordeaux) ranging from 1,135 degree days (using a Celsius base) to 1,452 degree days. Each of them reflects in parallel the dominating effect of the El Niño/La Niña (ENSO) climate cycle over the three and half decades I have been nurturing them.
Australian vignerons prosper or perish by the effects of weather events, the shorter-term El Niño/La Niña 5- to 10-year climate cycles, and the Pacific duodecadal climate cycles. Winter rains, spring temperatures, frost, flowering conditions, hail, rain before véraison or at harvest, humidity, sunshine, wind, and growing season heat accumulation all play a significant part in determining the quality and economy of the vintage.
At the end of the first decade of the twenty-first century, I reflected on the previous 20 vintages from 1991 to 2010 (https://tapanappa.com.au/news/june2011/canaries-climate), having just completed the very cool and wet 2011 La Niña vintage. I used the temperatures taken from our own recording station in the Piccadilly Valley and from the Australian Bureau of Meteorology (BOM) site at Coonawarra to establish heat summations (GDDs) for each of the 20 vintages.
For the 1991 to 2000 decade, the GDD of the Piccadilly Valley was a cool 1,135 degree days, 0.46°C below average because of the very cool 6-year oscillation from 1992 to 1997. The 2001 to 2010 decade was 0.4°C warmer than average because of the warm drought from 2005 to 2010, which finished with the emphatic cold and wet La Niña 2011 vintage.
The average of the 20 vintages from 1991 to 2010 was 1,176 degree days. Data collected at the Stirling BOM site (Station 23745), at the southern end of the Piccadilly Valley from 1926 to 1964, give a GDD of 1,171.6 degree days, the same as the 1,176 degree days average of the two decades 1991 to 2010.
The same story applies to the Coonawarra data, the cool 1990s averaging 1,398 degree days compared with the long-term average of 1,414 degree days and the warm 2001 to 2010 decade averaging 1,470 degree days. The two-decade average is 1,434 degree days, marginally higher than the long-term average of 1,414 degree days.
What Has Happened in the Six Vintages since 2010?
Piccadilly Valley has averaged 1,178 degree days, right on long-term average, and Coonawarra has averaged a warm 1,520 degree days, more than 100 degree days above the long-term average.
Despite the apparent warming of Coonawarra over the past 5 years, for my vineyards the jury is out on the visible and measured effects of global warming. We are in the grips of the “Godzilla of all El Niños” bringing drought and heat, and what happens in the next 5 years depends on the timing of the next La Niña bringing rain and cold. If that happens soon, we will have recorded three decades of long-term average temperatures in our vineyards.
Consistent with the three- to four-decade record of GDDs not deviating from the long-term averages, harvest times in the Piccadilly Valley and Coonawarra/Wrattonbully have cycled across the same time range in response to the heat of the growing season.
Using Piccadilly Valley Tiers Vineyard Chardonnay as an example, the two warmest vintages since 2010 have been 2010 (1,360 degree days; harvest date, March 11) and 2013 (1,317 degree days; harvest date, March 14). The two coolest vintages since 2010 have been 2011 (1,045 degree days; harvest date April 11) and 2014 (1,175 degree days; harvest date, April 3).
Piccadilly Valley Chardonnay is harvested for table wine as early as mid-March in an exceptionally warm year and as late as the second week of April in an exceptionally cool year, a full month difference underwritten by a 315 degree days difference in GDD, or 1.5°C temperature difference between the warm and cool vintage across the 212 days of the growing season. That differential in heat and harvest dates has not altered from the 1980s and 1990s through the vintages of the twenty-first century.
From the first harvest in 1984, Tiers Chardonnay has benefitted from closely spaced, vertical canopy; shoot and fruit thinning; and minimal irrigation management. There have been no major changes in viticulture style. In most Australian vineyards (indeed global vineyards), there have been major improvements in viticultural management over the past three decades. The correlation of these viticultural improvements with earlier and more complete ripening has to be separated to observe the effects of global warming for most modern vineyards, but Tiers Vineyard management is standardized across the three decades of its production.
Observations
The notably higher and lower temperature oscillations are usually of about 5- to 7-years' duration and occur once every one to two decades with temperatures hovering on average between these outlier events.
The temperature difference between the coolest vintages and the warmest is approximately 2°C for every day of the growing season, which is 1°C either side of the average. In that range of temperature oscillation, the terroir expression of the vineyards remains consistent and true to type.
Viticultural practices of the past two decades have improved enormously across the fine-wine world and must contribute to the earlier and more complete ripening of grapes being experienced.
Humans including vignerons tend to judge climate by the most memorable recent weather events and are surprised when the analysis of the numbers defies intuition as it often does.
Some global warming is not necessarily bad for cool viticultural regions. We now observe vignerons in the United Kingdom proudly claiming that global warming is allowing them to produce wines the equivalent or better than Champagne! That may or may not be true, but the level of professionalism in choice and management of site and in wine making is surely a huge contributor to the increased quality of English wine.
Here in Australia and in other research facilities around the globe, there is significant research of the combined effect of increased atmospheric carbon dioxide and increased temperature. The result may well be that the combination will improve quality and economy of grape production in cooler sites. An old adage of fine-wine growing is that “the best wines come from the warmer sites and vintages of cool-climate regions.” Maybe we are destined for more great vintages.
X. South Africa
A. Jan “Boland” Coetzee
Vriesenhof Vineyards, Stellenbosch, South Africa. Email: info@vriesenhof.co.za.
To my mind, much of the climate change science is about changes in the levels and patterns of temperature and rainfall, and of the interactions between temperature and rainfall. My scientist friends tell me we know quite a bit about the increase in temperature and the seasonal and daily patterns of temperature; that we know a bit less, but still quite a lot, about rainfall; and that we know very little about the interactions between these three. However, the Cape has always been associated with wind—the cooling southwesterly and southeasterly winds in summer and the northwesterly wind that brings the rain in winter. To complicate matters further, I believe very strongly that the characteristics of the place (i.e., the elevation above sea level, the steepness of the slopes and their aspect, and ultimately the soil and its properties) also constitute factors that influence the microclimate within which each grapevine grows, even if one can question the simplistic notion that the soil can be tasted in the glass. As I like to say, you cannot take the place with you—translocation of site is impossible—so that the romance of geological terminology involved in wine making cannot be replaced and will be with us for a long time because it is a wonderful way of experiencing the sheer romance of the liquid in the glass.
Living in Stellenbosch is a privilege because of its natural beauty, yet it is also frustrating because there is a different microclimate and even mesoclimate around every corner. I have lived here for more than 50 years now, and I have seen vast changes in the wine industry and in how we grow grapes, make wine, and ultimately market it. These changes have come about because of political, social, and environmental changes and because of better science, being on equal footing with the rest of the world, and improved vineyard management and techniques. As a result, it is difficult to say exactly what caused certain changes, especially in the case of climate change, which is the least visible of these changes.
Tip O'Neill, former Speaker of the House in the U.S. Congress, is closely associated with the saying that “all politics is local.” In this same spirit, farmers can do most about the microclimate, something about the mesoclimate, and not much about the macroclimate. So when we consider the impact of climate change, we are most likely to concentrate on the former two, and then mostly indirectly. Let me explain by first listing some of the more prominent manifestations of climate change of which I have become aware:
1. Extreme weather events are more prevalent than in the past.
2. The seasons have shifted. For example, in my earlier years as a winemaker, it was usual to start the harvest around February 5. In recent times, harvesting is starting earlier. For example, in 2007 the harvest began on January 23; in 2010, on January 21; and in 2015, on January 7.
3. We have had hot years before: if I recall, 1974, 1998, and 1999 were particularly hot years. However, in the past few years, we have had 3–4 days of particularly hot weather in the critical period between flowering and berry set (i.e., during November to January in the Southern Hemisphere).
4. We are getting more rainfall in the summer, whereas the Western Cape has always been associated with winter rainfall.
About 6 years ago, I noticed that the vineyards in Stellenbosch were greener than they had been in the past, and I started wondering what had caused this. First, I had to check for myself whether my observations were accurate. When I asked people whether they had noticed, the answer was invariably, “No, but now that I think about it …” So then I started wondering about the increasing summer rainfall, which, unlike our winter rains, came in the shape of thunderstorms. It was a small step from there to the windfall of extra nitrogen on the vineyards, so we started to measure the phenomenon and found that an additional 200 kg of nitrogen was being deposited per hectare for every 25 mm (1 inch) of rain. Nature can truly be kind!
As managers of a business, wine farmers are continually trying to increase output using the same amount of inputs, decreasing the cost of inputs to obtain the same amount of outputs, or going for the double whammy—higher output at lower cost. Of course, because we are working with wine, quality is the most important aspect of output when measured in monetary terms, but we still all dream of being able to maintain our standards of quality at the kinds of physical yields that can be obtained when standard wines are produced. I guess that in my lifetime there are three pertinent areas of vineyard management that have been given the most attention. These are canopy management, irrigation, and the improvement of the plant material.
All three of these are management tools that we use to influence the growth cycle of the vine in order to get the grape berries in optimal shape by the time they go into the cellar, but all three of these are influenced by climate change. So, for example, I cut my teeth in this business with the knowledge that the afternoon sun was the hottest and the morning sun was benign, but now I suspect that the intensity of the sun's rays is increasing. This is why vineyards in Stellenbosch tend to be on the southern slopes where many also have the benefit of the cooling sea breezes. However, we started noticing awhile ago that even the vines on the southern slopes were getting too much exposure to the sun. One of the solutions was more effective canopy management, training the vines vertically to a greater height than before, and then taking them horizontally in order to ensure that the fruit zone was in the shade when this was possible. This has proved to be very successful, and my measurements show that I can keep the temperature in the vicinity of the grape bunches at 24 °C even on very hot days.
We in the Southern Hemisphere have the luxury of being able to use irrigation as part of the management of soil and water interactions with the vines, even if it is expensive. Once again, irrigation is a tool that allows us to manage the growing season of the plant. However, increasing temperatures, and especially the increased extreme temperatures, mean that we are starting to take a leaf out of the book of the table-grape producers, who have introduced irrigation in the form of misting from above the vine. Of course, having irrigation at the top and the bottom of the vine is expensive, but this is all part of the elusive search for the best quality at the highest yield and the lowest cost of production.
Finally, I have experimented for many years with different combinations of rootstocks and grape varietals in the selection of what to plant, and I am convinced that finding the right combination enables one to manipulate the growing season. I reckon I can change the time of harvest by at least 10 days in this manner.
One outstanding issue that I believe warrants more research is the issue of the circulation of air—at the macro-, meso-, and microlevels. Stellenbosch is surrounded by mountains, each of which stands on a series of foothills, which point toward either the Atlantic or the Indian Ocean, and which sometimes intersect. This undulating landscape results in a very varied landscape. On my farm, I can go from valley floor up a north-facing slope, over the crown of the hill, and on to a south-facing slope all within 100 m. The Cape Peninsula and its interior is also known for its prevailing winds, which blow away the humidity usually associated with close proximity to the sea and long, hot summers. I am convinced that there are aspects of the air circulation around the vines and the grape bunches that affect the growing season, but I am also convinced that we know too little about this, and that it is time we do something about it.
In short, we are adopting new technologies and new management regimes so that we have more control over the “hanging time” of the grapes to ensure better quality, but at the same time, climate change seems to be working against us in myriad ways. Unless we can face up to that challenge with new technologies, better techniques, and more effective processes, we will lose the fight!
Short Biographies
David Adelsheim
David Adelsheim is President of Adelsheim Vineyard, which he founded with Ginny Adelsheim in 1971. His principal role today is strategic planning, focused on marketing and sales (export in particular), financial planning, and overall direction of vineyard and wine-making activities. In the course of his company's 43-year history, he has been the vineyard manager, winemaker, and the person in charge of sales, marketing, accounting, and fixing broken plumbing. His early wine-making experiences included work at the experimental winery of the Lycée Viticole in Beaune, France, and at the Eyrie Vineyards in Oregon. On behalf of the Oregon wine industry, he has led work on clonal importation, wine-labeling regulations, establishing statewide and regional industry organizations, and creation of industry events, such as the International Pinot Noir Celebration and Oregon Pinot Camp. As one of the founders of the Oregon wine industry, he helped set standards of excellence for that industry. He was given the industry's highest honor, the Lifetime Achievement Award, in February 2012 by the Oregon Wine Board (which he helped bring to life and on which he served for 8 years, appointed by Oregon's governor).
Clemens Busch
Clemens Busch joined the family winery, which was established in 1802, after completing his viticultural and enological studies in 1974. From the very beginning, he has experimented with organic grape growing and wine making. After taking over the winery in 1984, Clemens and his wife, Rita, finally converted fully to organic farming. He joined the Association of German Prädikat Wine Estates (VDP) in 2007. Meanwhile, the family vineyards have expanded from 2 to 17 ha, and Rita and Clemens's youngest son Johannes has joined the team.
Since 2005, Clemens Busch has also been working according to biodynamic principles. He has found like-minded winemakers in the respekt-BIODYN association, which serves as a platform for exchanging ideas and furthering biodynamic viticulture.
Laura Catena
Laura Catena is a fourth-generation Argentine vintner, biologist, physician, and author. Dr. Catena graduated magna cum laude from Harvard University in 1988 and has a Doctor of Medicine degree from Stanford University. In 1995, she founded the Catena Institute of Wine, which is dedicated to elevating Argentine wine for the next 100 years. Dr. Catena is currently the managing director of Bodega Catena Zapata and her own Luca Winery in Mendoza, Argentina, as well as a practicing emergency medicine physician in San Francisco. In 2010, she released her book Vino Argentino: An Insider's Guide to the Wines and Wine Country of Argentina (Chronicle Books).
Boris Champy
Boris Champy is the Technical Director at Domaine Louis Latour in Beaune, Burgundy. He was born in Champagne into a family of grape growers and has studied wine making at the University of Bordeaux. After an internship in Saint Emilion and Pomerol for Etablissements Jean-Pierre Moueix, he moved to California and worked for 10 years at Dominus Estate, the Napa Valley estate owned by Christian Moueix. After a decade in California working with Cabernet Sauvignon, Boris joined Domaine Louis Latour in Burgundy, supervising the famous Grand Cru holdings of Corton, Corton Charlemagne, Romanée Saint Vivant, but also the vineyards in Ardèche (Chardonnay), Var (Pinot Noir), and Beaujolais (Gamay and Pinot Noir).
Jan “Boland” Coetzee
Jan will be celebrating his 50th Stellenbosch harvest in 2017. A graduate of Stellenbosch University's Department of Viticulture and Oenology and of the university's rugby club, he is well known in South African wine circles as a former SpringbokFootnote 1 rugby player, doyen of the country's winemakers, raconteur, and innovator. Based at the farm Vriesenhof, he runs a wine business that is far broader than the farm alone. Jan was, many years ago, one of the founders of the Rural Foundation, a nongovernmental organization that tried to better the socioeconomic circumstances of South Africa's farmworkers, as well as a cofounder of the Cape Winemakers Guild.
Lawrence Coia
Lawrence Coia is owner of Coia Vineyards in Vineland, New Jersey, and cofounder of the Outer Coastal Plain Vineyard Association. His current interests are in promoting sustainable viticulture through identification of grape varieties that grow well and can produce high-quality wine in the Outer Coastal Plain AVA. He is a retired radiation oncologist, Fellow of the American Society of Radiation Oncologists, and Adjunct Professor at the University of Pennsylvania School of Medicine. His interest in grapes began in 1972 when, as an undergraduate in physics at Rensselaer Polytechnic Institute, he spent his junior year at the Swiss Federal Institute of Technology and recognized that quality wine grapes can be grown in climates other than the Mediterranean region or California. He is a member of the American Association of Wine Economists and has contributed to the Journal of Wine Economics with several book reviews.
Brian Croser
Brian Croser began as a winemaker with Thomas Hardy and Sons in 1969. In the early 1970s, Brian attended the University of California at Davis for a master's program and went on to establish the Wine Science program at Charles Sturt. By 1976, he had established Petaluma and in 1978 gave it a home in the Piccadilly Valley; in 1986, he established Argyle Winery in Oregon.
Brian served as Chairman of Adelaide, Canberra, Sydney, and Perth wine shows and twice as President of the Winemakers Federation. For his service to industry, he received an Order of Australia, won the Maurice O'Shea Award, and was Decanter magazine's Man of the Year in 2004.
Brian was Deputy Chancellor of University of Adelaide from 1999 to 2007 and was awarded the degree of Doctor of the University for his service. Brian still lives at the Tiers Vineyard in the Piccadilly Valley and is the winemaker for Tapanappa Wines and Tunkalilla Vineyard in Oregon. Brian is currently Deputy Chairman of the Australian Grape and Wine Authority.
Paul Draper
Paul Draper is the CEO and head winemaker of Ridge Vineyards. He grew up on an 40-acre farm near the Chicago suburb of Barrington. After attending the Choate School and receiving a degree in philosophy from Stanford University, he lived for 2 years in northern Italy. He went on to attend the University of Paris and traveled extensively in France. In both Italy and France, he sought out and studied traditional wine-making practices. In the mid-1960s, with a close friend, he set up a small winery in the coast range of Chile and produced several vintages of old vine Cabernet Sauvignon. He joined Ridge Vineyards in 1969 and resides atop Monte Bello Ridge with his wife, pianist and author Maureen McCarthy Draper. He is known for the fine Cabernets and Chardonnays of the Monte Bello estate vineyards and as a pioneer in the production of long-lived, complex Zinfandels.
Denis Dubourdieu
Denis Dubourdieu is a French winemaker and Professor of Oenology at the University of Bordeaux. He is owner or co-owner of several properties in Bordeaux (Château Reynon, Château Doisy Daëne, Château Cantegril, Château Haura, and Clos Floridène). He also consults for Château Cheval Blanc, Château Margaux, Château d'Yquem, Château Pichon Longueville Comtesse de Lalande, Maison Louis Jadot, Domaine Leflaive, Domaine Trimbach, and many others.
As part of his academic responsibilities, Dubourdieu is the director of l'Institut des Sciences de la Vigne et du Vin de l'Université de Bordeaux (ISVV), a multidisciplinary research center. Dubourdieu specializes in wine-making processes for white wines. He played a leading role in the improvement of white Bordeaux wines, which as late as the 1960s were sweet and of low quality, to become “serious, potentially profound dry whites.”
Frederick Frank
Frederick Frank is the third generation of the Frank family managing Dr. Konstantin Frank Wine Cellars and is its current President. Fred began his studies at Cornell University School of Agriculture. He later went to Germany to study wine making and viticulture at the Geisenheim Institute in Germany. He received experience working for Banfi Vintners as a state sales manager for 2 years and as the managing director of their Old Brookville Vineyards for 10 years. Fred enjoyed working with his grandfather Konstantin and father, Willy, and took over as president in 1993. Recently, Fred's daughter Meaghan joined the winery as General Manager. Fred looks forward to working with her to continue the winery's vision of excellence on into its fourth generation.
Heinz Frischengruber
Heinz Frischengruber, a Wachau native and graduate of oenology at Geisenheim in Germany, has been head winemaker at Domäne Wachau since spring 2005. Heinz's key contributions to the success of Domäne Wachau are the successful development of a quality improvement program in the vineyards and a focus on preserving the unique terroir character of the wines.
Roman Horvath
Roman Horvath has been the winery's director since 2004 and is responsible for the strategic positioning and consistent quality orientation of Domäne Wachau. Before making his home in the Wachau, he worked in wine trade and in wineries in Chile and France. He is the second Austrian to successfully complete the prestigious Master of Wine education at the Institute of Masters of Wine in London.
Alois Lageder
Alois Lageder is the fifth generation to run the Alois Lageder winery established in 1823. After studying economics and being trained in viticulture and enology, he took over the winery and its vineyards at the age of 24. He soon began to reposition the winery, improved quality, and adopted innovative production methods. He and his wife, Veronika Riz, both love contemporary art and music, which have a firm place in the winery. He was president of the Museum of Modern and Contemporary Art of Bozen (Museion) for about 10 years. Since 2008, he has been the president of the Ökoinstitut Bozen (Eco-Institute Bolzano). His son Alois Clemens—the second born of three children—has recently joined the winery.
Ernst Loosen
After having studied archaeology in college, Ernst Loosen took over his family's 200-year-old estate on the German Mosel in 1988 and began to produce high-quality Riesling wines. He has a degree in viticulture and enology from Geisenheim University. In 1992, Dr. Loosen estate joined the VDP, Germany's association of top-rated wine estates. Ernst was named Germany's Winemaker of the Year in the 2001 by Gault Millau's Weinguide Deutschland and Decanter magazine's Man of the Year in 2005. He was also the International Wine Challenge's White Winemaker of the Year in 2005. In addition to the Dr. Loosen estate, he now has a joint venture Riesling project with Château Ste. Michelle, in Washington State, as well as a Pinot Noir partnership, J. Christopher Wines, in Oregon.
Tamara Roberts
Tamara Roberts is the CEO of Ridgeview and one of five family members actively involved in the management of the winery. Tamara has overseen the growth of the winery from 50,000 bottles to 300,000 bottles in the past 10 years and is responsible for the strategic direction of the winery.
Matthew Strugnell
Matthew Strugnell is the Vineyard Manager at Ridgeview. His viticultural career started in 1999 in the Clare Valley and Mildura in Australia. He then studied an Higher National Diploma in Wine Studies at Plumpton College, before joining Ridgeview in 2002.
Miguel A. Torres
Miguel A. Torres is the president of Bodegas Torres. He was born in Barcelona in 1941 and is married to Waltraud Maczassek. Together, they have three children: Anna, Mireia, and Miguel. He belongs to the fourth generation of a family dedicated to making and distributing high-quality wines and brandies for the past 145 years. Torres studied Chemical Sciences for 2 years at the University of Barcelona (1957–1959) and Oenology and Viticulture at the University of Dijon (1959–1962). He joined the family business in 1962 and is currently the president of the company. He speaks Spanish, Catalan, English, French, and acceptable German and also studied Japanese, Chinese, and Russian for several years. He is also author of Viñas y Vinos (Vineyards and Wines), a book about the wine world published in 1977, translated into several languages and now in its seventh edition.
Marimar Torres
Marimar Torres has been involved in the wine business all her life. Born in 1945 in Barcelona, Spain, she is fluent in six languages and holds a degree in Business and Economics from the University of Barcelona. She is also a graduate of the Stanford Executive Program and studied Enology and Viticulture for a year at the University of California at Davis. At Marimar Estate Vineyards & Winery, she directs the activities at the winery and in both vineyards—Don Miguel (named after her late father) in the Russian River Valley and Doña Margarita (named after her late mother) in the Sonoma Coast American viticultural area (AVA), both in Sonoma County.
Prior to her involvement in the California operation, Marimar traveled extensively promoting Torres wines, first in Spain as the company's export director and later in North America, when California became her home in 1975. At that time, shipments of Torres wines to the United States totaled 15,000 cases; 10 years later, they reached 150,000. To achieve this was not easy, though; especially in the beginning, Marimar was confronted with the common notion that the wine business was no place for a woman. Eventually, her tenacity and business acumen helped her overcome this bias, and she became the best-known ambassador of Spanish wines in North America.