


INTRODUCTION
Importance of Accurate and Precise LGIT 14C Levels
Globally, the Last Glacial–Interglacial Transition (LGIT; 15,000–11,000 cal BP) experienced highly variable climatic and environmental change accompanied by human migration and expansion. High-resolution proxy archives have been developed to investigate climate, environmental, and archaeological change through the LGIT, including interhemispheric ocean-atmosphere leads and lags using lacustrine sediments, marine sediments, and ice cores (Björck et al. Reference Björck, Walker, Cwynar, Johnsen, Knudsen, Lowe and Wohlfarth1998; Mayle et al. Reference Mayle, Bell, Birks, Brooks, Coope, Lowe, Sheldrick, Shijie, Turney and Walker1999; Turney et al. Reference Turney, Kershaw, Lowe, van der Kaars, Johnston, Rule, Moss, Radke, Tibby, McGlone, Wilmshurst, Vandergoes, Fitzsimons, Bryant, James, Branch, Cowley, Kalin, Ogle, Jacobsen and Fifield2006; Lowe et al. Reference Lowe, Rasmussen, Björck, Hoek, Steffensen, Walker and Yu2008; Muscheler et al. Reference Muscheler, Kromer, Björck, Svensson, Friedrich, Kaiser and Southon2008; McGlone et al. Reference McGlone, Turney, Wilmshurst and Pahnke2010), abrupt global sea-level rise such as Meltwater Pulse 1A (MWP1A; Hanebuth et al. Reference Hanebuth, Stattegger and Grootes2000), megafaunal extinction (Cooper et al. Reference Cooper, Turney, Hughen, Brook, McDonald and Bradshaw2015; Metcalf et al. Reference Metcalf, Turney, Barnett, Martin, Bray, Vilstrup, Orlando, Salas-Gismondi, Loponte, Medina and De Nigris2016), and the expansion of modern humans into the Americas (Waters and Stafford Reference Waters and Stafford2007; Dillehay et al. Reference Dillehay, Ramírez, Pino, Collins, Rossen and Pino-Navarro2008). In the Northern Hemisphere (NH), the climate during the LGIT was characterized by abrupt temperature changes that included rapid warming at 14,700 cal BP, defined by the start of the Greenland Interstadial-1 (GI-1) in the Greenland ice-core isotope stratigraphy, and sustained severe cooling during Greenland Stadial-1 (GS-1; around 12,800–11,650 cal BP) (Rasmussen et al. Reference Rasmussen, Bigler, Blockley, Blunier, Buchardt, Clausen, Cvijanovic, Dahl-Jensen, Johnsen, Fischer, Gkinis, Guillevic, Hoek, Lowe, Pedro, Popp, Seierstad, Steffensen, Svensson, Vallelonga, Vinther, Walker, Wheatley and Winstrup2014). In marked contrast, the mid- to high latitudes of the Southern Hemisphere (SH) experienced multicentennial temperature changes that were markedly antiphase to those in the North Atlantic, including the Antarctic Cold Reversal (ACR; 14,700–13,000 cal BP), apparently asynchronous with GS-1 (WAIS Divide Project Members 2015). The precise alignment of ice sequences with radiocarbon-dated terrestrial and marine records remains uncertain (Blockley et al. Reference Blockley, Lane, Hardiman, Rasmussen, Seierstad, Steffensen, Svensson, Lotter, Turney and Bronk Ramsey2012; Muscheler et al. Reference Muscheler, Adolphi and Knudsen2014).
Testing hypotheses of synchronous change is heavily dependent upon 14C dating, with terrestrial samples requiring accurate representation of past atmospheric 14C concentration (Δ14C).Footnote 1 Because atmospheric Δ14C varies throughout time with fluctuating 14C production rates and changes in sequestration in the various global carbon reservoirs, 14C ages need to be placed on a calendar timescale using independently dated 14C calibration records: IntCal13 (Reimer et al. Reference Reimer, Bard, Bayliss, Beck, Blackwell, Bronk Ramsey, Grootes, Guilderson, Haflidason, Hajdas, Hatté, Heaton, Hoffmann, Hogg, Hughen, Kaiser, Kromer, Manning, Niu, Reimer, Richards, Scott, Southon, Staff, Turney and van der Plicht2013) for NH and SHCal13 (Hogg et al. Reference Hogg, Hua, Blackwell, Niu, Buck, Guilderson, Heaton, Palmer, Reimer, Reimer, Turney and Zimmerman2013b) for SH samples.
Atmospheric 14C measurements for the past ~14,000 yr (Reimer et al. Reference Reimer, Bard, Bayliss, Beck, Blackwell, Bronk Ramsey, Grootes, Guilderson, Haflidason, Hajdas, Hatté, Heaton, Hoffmann, Hogg, Hughen, Kaiser, Kromer, Manning, Niu, Reimer, Richards, Scott, Southon, Staff, Turney and van der Plicht2013), as derived from tree rings, are considered the gold standard for 14C calibration due to mostly independent dendrochronological dating. The Lateglacial and early Holocene period Δ14C record, as contained in IntCal13, has been compiled through largely decadally resolved 14C dating of 10-yr average tree rings from the following four key tree-ring chronologies:
-
(a) The “absolute” tree-ring chronology: This startsFootnote 2 at 12,410 cal BP, with the oldest section represented by the Preboreal pine chronology (PPC) dendro-linked to the calendar-dated Holocene oak chronology (HOC; Friedrich et al. Reference Friedrich, Remmele, Kromer, Hofmann, Spurk, Kaiser, Orcel and Küppers2004).
-
(b) YD-B: A tree-ring chronology built from Swiss pines, which was dendro-matched to the earliest part of the PPC, extending the absolute tree-ring chronology by 184 yr to 12,594 cal BP (Schaub et al. Reference Schaub, Kaiser, Frank, Buentgen, Kromer and Talamo2008a; Hua et al. Reference Hua, Barbetti, Fink, Kaiser, Friedrich, Kromer, Levchenko, Zoppi, Smith and Bertuch2009; Kaiser et al. Reference Kaiser, Friedrich, Miramont, Kromer, Sgier, Schaub, Boeren, Remmele, Talamo, Guibal and Sivan2012).
-
(c) Tasmanian huon pine chronology: Four floatingFootnote 3 Tasmanian huon pine (Lagarostrobos franklinii) trees combined by dendrochronology and 14C curve-matching to form a 617-yr series, overlapping with YD-B in age and spanning the early Younger Dryas (YD; Hua et al. Reference Hua, Barbetti, Fink, Kaiser, Friedrich, Kromer, Levchenko, Zoppi, Smith and Bertuch2009).
-
(d) CELM: The floating 1606-yr Central European Lateglacial Master Chronology (CELM; Kaiser et al. Reference Kaiser, Friedrich, Miramont, Kromer, Sgier, Schaub, Boeren, Remmele, Talamo, Guibal and Sivan2012). This record overlaps in time with the huon pine series, and starts at ~14,000 cal BP (Kromer et al. Reference Kromer, Friedrich, Hughen, Kaiser, Remmele, Schaub and Talamo2004; Kaiser et al. Reference Kaiser, Friedrich, Miramont, Kromer, Sgier, Schaub, Boeren, Remmele, Talamo, Guibal and Sivan2012).
Closer scrutiny of the tree-ring chronologies and 14C-dated sequences described above (a–d) has revealed some areas of concern and a general weakness in 14C calibration for this time period. These are each discussed in more detail in the following sections.
(a) Absolute Tree-Ring Chronology
The continuous European oak and pine tree-ring chronology as described by Friedrich et al. (Reference Friedrich, Remmele, Kromer, Hofmann, Spurk, Kaiser, Orcel and Küppers2004) started at 12,410 cal BP and is characterized as “absolute” because the tree-ring sequences were dated and linked by dendrochronology. The oldest section is represented by the Preboreal pine chronology dendro-linked to the calendar-dated Holocene oak chronology (Friedrich et al. Reference Friedrich, Remmele, Kromer, Hofmann, Spurk, Kaiser, Orcel and Küppers2004). The earliest part of the PPC (the two-tree, 215-yr “Zurich” Swiss pine chronology from Zurich-Wiedikon, connected to the younger German Cottbus chronology) has low replication, and although it utilized all available series from Switzerland and northeast and southern Germany, it could not be confirmed, with the linkage described as “tentative” in Friedrich et al. (Reference Friedrich, Remmele, Kromer, Hofmann, Spurk, Kaiser, Orcel and Küppers2004). Although a 14C curve-match supported this linkage (Friedrich et al. Reference Friedrich, Remmele, Kromer, Hofmann, Spurk, Kaiser, Orcel and Küppers2004), the new 14C data series presented here show that decadal 14C curve-matching for this time interval is unlikely to be conclusive, because all 14C dates lie on the ~10,400 BP 14C plateau which is ~300 yr long, spanning the interval ~12,450–12,150 cal BP. Dendrochronological reanalysis of the “Zurich” to Cottbus connection has since confirmed the unreliability of this linkage (as reported by Friedrich et al. at the 2015 Zurich IntCal-Dendro workshop).
In addition, the 14C data set of the older part of the absolute tree-ring chronology has uncertainties and a gap around ~12,000 cal BP, the time interval previously occupied by the discarded larch tree-ring series from Ollon, Switzerland (Ollon(VOD)505; Hogg et al. Reference Hogg, Turney, Palmer, Southon, Kromer, Bronk Ramsey, Boswijk, Fenwick, Noronha, Staff and Friedrich2013a; Reimer et al. Reference Reimer, Bard, Bayliss, Beck, Blackwell, Bronk Ramsey, Grootes, Guilderson, Haflidason, Hajdas, Hatté, Heaton, Hoffmann, Hogg, Hughen, Kaiser, Kromer, Manning, Niu, Reimer, Richards, Scott, Southon, Staff, Turney and van der Plicht2013). Indeed, the 425-yr period from 12,325–11,900 cal BP in the IntCal13 database (http://intcal.qub.ac.uk/intcal13/) contains only 12 decadal 14C measurements, with the low sample density significantly reducing the resolution of 14C calibration for samples of this age.
(b) Extension of Absolute Tree-Ring Chronology to 12,594 cal BP Using YD-B
Hua et al. (Reference Hua, Barbetti, Fink, Kaiser, Friedrich, Kromer, Levchenko, Zoppi, Smith and Bertuch2009) and Kaiser et al. (Reference Kaiser, Friedrich, Miramont, Kromer, Sgier, Schaub, Boeren, Remmele, Talamo, Guibal and Sivan2012) built upon the work of Schaub et al. (Reference Schaub, Kaiser, Frank, Buentgen, Kromer and Talamo2008a), and presented 14C data for the Swiss pine YD-B chronology, which extended the absolute tree-ring chronology to 12,594 cal BP, with the essential link to the absolute PPC still based on the “tentative” “Zurich” pine (called KW30 in Hua et al. Reference Hua, Barbetti, Fink, Kaiser, Friedrich, Kromer, Levchenko, Zoppi, Smith and Bertuch2009) to German Cottbus connection (Friedrich et al. Reference Friedrich, Remmele, Kromer, Hofmann, Spurk, Kaiser, Orcel and Küppers2004).
(c) Floating Tasmanian Huon Pine Chronology
Hua et al. (Reference Hua, Barbetti, Fink, Kaiser, Friedrich, Kromer, Levchenko, Zoppi, Smith and Bertuch2009) presented 21 14C dates from the NH YD-B chronology and a further 137 14C dates from a SH 617-yr huon pine sequence to anchor the floating 1382-yr Lateglacial pine (LGP) chronology (Kromer et al. Reference Kromer, Friedrich, Hughen, Kaiser, Remmele, Schaub and Talamo2004) and bridge the gap in the European tree-ring 14C record during the YD. However, because of the low replication of the huon pine tree-ring chronology, which is composed of only four logs, the dendro cross-matches also relied upon 14C curve-matching, introducing additional uncertainties, to identify the correct linkages. The calculated error in the older huon/LGP overlap is±16 yr (1σ errors); no errors are stated for the younger huon/absolute tree-ring chronology overlap, although the authors do acknowledge that the agreement, although evident, is not as good for the younger time period. Although the huon sequence extended far enough towards younger ages to overlap with both KW30 (“Zurich”) and Cottbus dates, it was not young enough to extend beyond the ~10,400 BP plateau and could not therefore verify the KW30/Cottbus connection.
(d) Floating CELM Chronology
Kaiser et al. (Reference Kaiser, Friedrich, Miramont, Kromer, Sgier, Schaub, Boeren, Remmele, Talamo, Guibal and Sivan2012) compiled an inventory of Lateglacial tree-ring chronologies from Switzerland, Germany, and France. Building upon the work of Schaub (Reference Schaub2007) and Schaub et al. (Reference Schaub, Kaiser, Frank, Buentgen, Kromer and Talamo2008a,Reference Schaub, Büntgen, Kaiser, Kromer, Talamo, Andersen and Rasmussenb), Kaiser et al. (Reference Kaiser, Friedrich, Miramont, Kromer, Sgier, Schaub, Boeren, Remmele, Talamo, Guibal and Sivan2012) initially constructed the Swiss Lateglacial Master Chronology (SWILM). Comparisons of the independently established tree-ring chronologies from Germany (Friedrich et al. Reference Friedrich, Kromer, Spurk, Hofmann and Kaiser1999, Reference Friedrich, Kromer, Kaiser, Spurk, Hughen and Johnsen2001a,Reference Friedrich, Knipping, von der Kroft, Renno, Ullrich and Vollbrechtb, Reference Friedrich, Remmele, Kromer, Hofmann, Spurk, Kaiser, Orcel and Küppers2004) and Switzerland provided a cross-check and permitted formation of the Central European Lateglacial Master Chronology (Kaiser et al. Reference Kaiser, Friedrich, Miramont, Kromer, Sgier, Schaub, Boeren, Remmele, Talamo, Guibal and Sivan2012).
Based on initial European floating Lateglacial tree-ring chronologies (Friedrich et al. Reference Friedrich, Kromer, Spurk, Hofmann and Kaiser1999, Reference Friedrich, Kromer, Kaiser, Spurk, Hughen and Johnsen2001a,Reference Friedrich, Knipping, von der Kroft, Renno, Ullrich and Vollbrechtb), Kromer et al. (Reference Kromer, Friedrich, Hughen, Kaiser, Remmele, Schaub and Talamo2004) constructed a 1382-yr Lateglacial pine 14C series with 106 14C dates from German and Swiss tree-ring series covering the 14C age interval of ~12,300–10,600 BP. Additional Lateglacial pine 14C dates from Swiss sites were obtained by Schaub et al. (Reference Schaub, Kaiser, Kromer and Talamo2005, Reference Schaub, Kaiser, Frank, Buentgen, Kromer and Talamo2008a). A revised 14C data set (which includes the LGP series of Kromer et al. Reference Kromer, Friedrich, Hughen, Kaiser, Remmele, Schaub and Talamo2004) comprising 232 dates from the CELM and covering the 14C age interval of 12,357 to 10,612 BP, was included in IntCal13 (Reimer et al. Reference Reimer, Bard, Bayliss, Beck, Blackwell, Bronk Ramsey, Grootes, Guilderson, Haflidason, Hajdas, Hatté, Heaton, Hoffmann, Hogg, Hughen, Kaiser, Kromer, Manning, Niu, Reimer, Richards, Scott, Southon, Staff, Turney and van der Plicht2013).Footnote 4 Various studies place the LGP end date between ~12,500 and 12,850 cal BP (see details below). It is clear that these floating records need to be more tightly constrained, to reduce calibration errors across the LGIT.
Importance of New Zealand Subfossil Kauri
Subfossil kauri (Agathis australis) logs ranging in age from late Holocene to at least Oxygen Isotope Stage (OIS) 7 (243,000–191,000 cal BP; Marra et al. Reference Marra, Alloway and Newnham2006) are preserved in remarkable condition in anaerobic bogs scattered from Waikato to Northland in the upper North Island of New Zealand (Ogden et al. Reference Ogden, Wilson, Hendy, Hogg and Newnham1992; Palmer et al. Reference Palmer, Lorrey, Turney, Hogg, Baillie, Fifield and Ogden2006, Reference Palmer, Turney, Hogg, Lorrey and Jones2015); see Figure 1. Some of the buried trees have more than 2000 rings and diameters greater than 4 m. Living trees have recently been linked to late-Holocene subfossil logs (Boswijk et al. Reference Boswijk, Fowler, Lorrey, Palmer and Ogden2006, Reference Boswijk, Fowler, Palmer, Fenwick, Hogg, Lorrey and Wunder2014) and numerous floating chronologies mainly from OIS 3 (60,000–25,000 cal BP) have also been constructed (Palmer et al. Reference Palmer, Turney, Hogg, Lorrey and Jones2015; Turney et al. Reference Turney, Palmer, Bronk Ramsey, Adolphi, Muscheler, Hughen, Staff, Jones, Thomas, Fogwill and Hogg2016). This wood contains high-resolution information about past environments, including climate and landforms, and is therefore a scientific resource of international significance (Turney et al. Reference Turney, Fifield, Palmer, Hogg, Baillie, Galbraith, Ogden, Lorrey and Tims2007).
Location of Younger Dryas/early Holocene subfossil kauri sites Towai and Finlayson Farm (FIN11), Northland, New Zealand.

Kauri logs were extracted from two geographic locations for this study. The first location was a farm site near Towai (35°30.393′S, 174°10.376′E; Figure 1) in Northland where a cohort of 37 subfossil kauri logs of YD age has recently been discovered (Hogg et al. Reference Hogg, Turney, Palmer, Southon, Kromer, Bronk Ramsey, Boswijk, Fenwick, Noronha, Staff and Friedrich2013a, Reference Hogg, Southon, Turney, Palmer, Bronk Ramsey, Fenwick, Boswijk, Friedrich, Helle, Hughen, Jones, Kromer, Noronha, Reynard, Staff and Wacker2016). The second site (Finlayson Farm, tree FIN11) near Kai Iwi Lakes in Northland (35°50′S, 173°39′E; Figure 1) contains a single YD/early Holocene-aged log, which overlaps in age with the Towai series.
The development of a robust 1451-yr kauri tree ring chronology from Towai and highly replicated decadal 14C analysis of the Towai wood by multiple laboratories enables us to address the YD calibration issues outlined above. Decadal 14C measurements were published by Hogg et al. (Reference Hogg, Southon, Turney, Palmer, Bronk Ramsey, Fenwick, Boswijk, Friedrich, Helle, Hughen, Jones, Kromer, Noronha, Reynard, Staff and Wacker2016). Here, we present individual kauri measurements from ~13,130–11,370 cal BP, with additional details relating to the reconstruction of the LGIT/early Holocene NH 14C record. In combination with the key NH data sets, we report improved SH and NH atmospheric tree-ring-based 14C data comparison curves, spanning the interval ~14,200 to the present. The new tree-ring-based 14C data sets, which can be accessed using OxCal (Bronk Ramsey Reference Bronk Ramsey2009), are not an official replacement for IntCal13 or SHCal13, but we propose they should be used in the interim as a tool for assessing possible LGIT/early Holocene calibration errors in the official calibration curves and testing hypotheses of regional and global synchroneity.
METHODS
Dendrochronology
The 1451-yr Towai floating subfossil kauri chronology compiled from 91 radial strips derived from 37 trees is well replicated and securely cross-dated with an average cross-correlation coefficient between all series of 0.71 (Hogg et al. Reference Hogg, Turney, Palmer, Southon, Kromer, Bronk Ramsey, Boswijk, Fenwick, Noronha, Staff and Friedrich2013a, Reference Hogg, Southon, Turney, Palmer, Bronk Ramsey, Fenwick, Boswijk, Friedrich, Helle, Hughen, Jones, Kromer, Noronha, Reynard, Staff and Wacker2016). The chronology has only 0.63% missing rings, with a mean ring width of 1.13 mm and average series length of 551 yr. Utilizing the expressed population signal (EPS; Wigley et al. Reference Wigley, Briffa and Jones1984) threshold of >0.85 as a measure of satisfactory replication to avoid dendrochronological dating errors, the Towai chronology has inadequate sample depth for the first (oldest) 115 rings and the last (youngest) 164 rings. The kauri tree FIN11 has two measured radii and 533 rings. Through comparison of the two radii, we estimate that the log contains a maximum of 10 missing rings. No crossmatch has been identified between the FIN11 tree-ring sequence to the Towai tree-ring chronology. However, comparison of the 14C series indicates there is a ~185-yr overlap between the 14C chronologies, with FIN11 extending a further ~290 yr into the early Holocene. The FIN11 measurements provide additional confidence in the lock of the Towai kauri series with the secure Lateglacial/early Holocene dendro-dated NH wood series forming IntCal13.
Wood Treatment and Δ14C Measurement
High-precision (HP) liquid scintillation (LS) spectrometry and accelerator mass spectrometry (AMS) 14C dating have been undertaken on cellulose extracted from decadal kauri samples covering the entire Younger Dryas Stadial and the beginning of the Holocene. Six 14C dating laboratories made contributions in compiling the 14C data sets (Table 1). Detailed wood pretreatment procedures and 14C analytic methods for the principal participating laboratories (University of California at Irvine, UCI; University of Waikato, Wk; University of Oxford, OxA) are given by Hogg et al. (Reference Hogg, Turney, Palmer, Southon, Kromer, Bronk Ramsey, Boswijk, Fenwick, Noronha, Staff and Friedrich2013a).
Individual laboratory contributions to the Towai and FIN11 14C data sets.

RESULTS
We present here the results of 789 14C measurements for the Towai chronology and a further 246 measurements from FIN11. 14C decadal means, rejection criteria, and statistical analysis methods for both data sets are given in Hogg et al. (Reference Hogg, Southon, Turney, Palmer, Bronk Ramsey, Fenwick, Boswijk, Friedrich, Helle, Hughen, Jones, Kromer, Noronha, Reynard, Staff and Wacker2016). From a total of 1035 results, 11 were rejected from the Towai chronology and 2 from the tree FIN11. Individual analyses are given as an XLS file (Radiocarbondating results.xls) in the online Supplementary Material (sheets named “Towai accepted,” “FIN11 accepted,” and “TOWAI_FIN11 rejected”). The χ2 agreement indices indicate a high level of reproducibility within each decade for both data sets—see Hogg et al. (Reference Hogg, Southon, Turney, Palmer, Bronk Ramsey, Fenwick, Boswijk, Friedrich, Helle, Hughen, Jones, Kromer, Noronha, Reynard, Staff and Wacker2016) for details. We also present the NH data with reassigned calendar ages (Radiocarbondating results.xls/NH).
DISCUSSION
Calendar Placement of Towai and FIN11 Data Sets
The floating Towai and FIN11 14C time series were curve-matched against IntCal13 (Reimer et al. Reference Reimer, Bard, Bayliss, Beck, Blackwell, Bronk Ramsey, Grootes, Guilderson, Haflidason, Hajdas, Hatté, Heaton, Hoffmann, Hogg, Hughen, Kaiser, Kromer, Manning, Niu, Reimer, Richards, Scott, Southon, Staff, Turney and van der Plicht2013) with the match restricted to the time interval unaffected by the removal of the Ollon505 data set (Hogg et al. Reference Hogg, Turney, Palmer, Southon, Kromer, Bronk Ramsey, Boswijk, Fenwick, Noronha, Staff and Friedrich2013a; Reimer et al. Reference Reimer, Bard, Bayliss, Beck, Blackwell, Bronk Ramsey, Grootes, Guilderson, Haflidason, Hajdas, Hatté, Heaton, Hoffmann, Hogg, Hughen, Kaiser, Kromer, Manning, Niu, Reimer, Richards, Scott, Southon, Staff, Turney and van der Plicht2013), i.e. IntCal13 14C data points younger than ~10,260 BP. The Towai 14C data set includes 18 such measurements younger than 10,260 BP. The curve-match utilized the OxCal Reservoir Offset (“Delta_R”) function (Bronk Ramsey Reference Bronk Ramsey2009) with a wide uniform prior of –120 to +120 yr to account for the interhemispheric (IHFootnote 5 ) offset. It also employed outlier analysis (Bronk Ramsey Reference Bronk Ramsey2009) using Outlier_Model (“SSimple”,N(0,2),0,“s”) with {Outlier, 0.05} (which allows individual samples—roughly 1 in 20—to be outliers) to down-weight outliers. A curve-match between the same, youngest, 18 Towai data points and FIN11 provided a check on the consistency of the Towai and FIN11 data sets. Results for the three curve-matches are summarized in Table 2.
Agreement data for comparison of floating Lateglacial kauri data to various calibration data sets.

* Offset function=((U(-120,120))).
§ χ2 agreement test: df=degrees of freedom; T=chi-square test statistic; 5%=comparison T-test value with a <5% probability of arising due to chance alone.
# If Holocene SH 14C data sets are curve-matched against a NH calibration curve, the IH offset has a positive sign, as in column 5 above. This becomes negative when Holocene NH data sets are matched against SH curves. To avoid confusion, all curve-matches in this paper are assumed to be SH 14C data matched against NH curves, irrespective of the origin of the 14C data.
The Towai chronology curve-match to IntCal13 (Table 2, run 2-1; Figure 2A) has high agreement for both individual analyses and the model as a whole (model agreement index Ac=262.3%) with the youngest decade having a mean calendar age of 11,694±7 cal BP and the decadal midpoints lying between 13,134 and 11,694±7 cal BP.
(A) Floating SH Towai and FIN11 data sets. (B) NH data sets: (i) Known calendar-age: Preboreal pine chronology (PPC) and Breitenthal (UCI); (ii) Floating: Ollon505 (new Wk and HD data; Hogg et al. Reference Hogg, Turney, Palmer, Southon, Kromer, Bronk Ramsey, Boswijk, Fenwick, Noronha, Staff and Friedrich2013a). IntCal13 curve (black 1σ error bars) given in both plots.

All 48 FIN11 decades were curve-matched to IntCal13 using the same Delta_R uniform offset prior of –120 to 120 yr (Table 2, run 2-2; Figure 2A). The model as a whole shows very good agreement (Ac=298.7%), with the youngest FIN11 decade having a mean calendar age of 11,366±3 cal BP. The FIN11 decadal midpoints therefore range from 11,869 to 11,366 cal BP (Figure 2A). As the curve-matches are based upon decadal data only, we consider the very low errors given here and elsewhere in this paper may be overly precise.
To test the calendar placement of the Towai chronology, we constructed a calibration data set from the FIN11 results and compared the Towai 14C time series with FIN11 (Table 2, run 2-3). Although the agreement indices are lower (Ac=91.9%), the agreement is still acceptable. Using the FIN11 data, the Towai chronology youngest decade midpoint has a mean calendar age of 11,690±3 cal BP. The two Towai chronology runs have produced statistically identical results (Table 2, runs 2-1 and 2-3).
For final placement of the Towai chronology, we have chosen the comparison with IntCal13 rather than FIN11. Although the FIN11 comparison produced a more precise result, the FIN11 tree is not dendrochronologically secure and may have up to 10 missing rings. On the basis of the three curve-matches as outlined above, we have assigned a calendar age range for the Towai 14C time series of 13,134–11,694 cal BP with a 1σ error of ±7 yr.
Despite the possibility of up to 10 missing rings in the tree FIN11, the majority of the FIN11 measurements match the IntCal13 data points and curve closely (Figure 2A). The FIN11 14C time series confirms there is no measurable change at decadal timescales in the IH offset at the beginning of the Holocene. The youngest 18 measurements from the Towai chronology also lock securely with both FIN11 and IntCal13 data points.
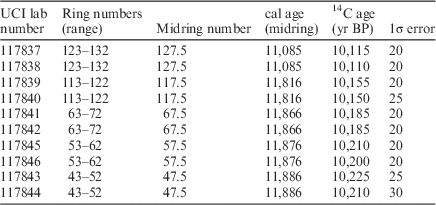
The comparison of YD/early Holocene SH data points and the IntCal13 curve in Figure 2A shows the SH data points deviate from the shape of IntCal13 from ~12,200 to 11,900 cal BP, the time interval previously occupied by the original Ollon505 measurements and for which no replacement NH data are yet available. Figure 2B shows the equivalent NH data: the absolute Preboreal pine chronology measurements (Friedrich et al. Reference Friedrich, Remmele, Kromer, Hofmann, Spurk, Kaiser, Orcel and Küppers2004), supplemented by a few new UCI AMS results from the known-age Breitenthal tree-ring series (Table 3). Two PPC dates from Tapfheim17 (11,926.5 cal BP, HD-16342 and 11,896.5 cal BP, HD-16427) may be a little young. We have also included measurements from the floating Ollon505 tree-ring series, as positioned in Hogg et al. (Reference Hogg, Turney, Palmer, Southon, Kromer, Bronk Ramsey, Boswijk, Fenwick, Noronha, Staff and Friedrich2013a). Although it is not conclusive, the NH data points for samples older than ~11,900 cal BP also tend to depart from IntCal13 and support the view that IntCal13 is too young between ~12,200 and 11,900 cal BP.
New UCI 14C determinations from the PPC Breitenthal tree-ring chronology (tree 198).
Refinement of the Lateglacial Atmospheric Δ14C Record
(a) Extension of Absolute Tree-Ring Chronology Using the YD-B Measurements
The youngest of the YD-B 14C dates from the KW30 series (the “Zurich” trees originally included in the PPC absolute tree-ring chronology by Friedrich et al. Reference Friedrich, Remmele, Kromer, Hofmann, Spurk, Kaiser, Orcel and Küppers2004 and Schaub et al. Reference Schaub, Kaiser, Frank, Buentgen, Kromer and Talamo2008a) as positioned in IntCal13 are plotted with contemporaneous PPC and Towai data points in Figure 3.
Positioning of YD-B KW30 measurements as included in IntCal13 (data as tabulated in the IntCal13 database–HD atmospheric, Set 5 Division 2). IntCal13 curve (black 1σ error bars) is also given.

The oldest of the Zurich pine KW30 measurements, HD-20109, in its IntCal13 position (12,401 cal BP), is >100 14C yr older than the equivalent Towai decadal value and causes the shape of the IntCal13 curve to deviate towards older 14C ages at this point. Because of the caveat by Friedrich et al. (Reference Friedrich, Remmele, Kromer, Hofmann, Spurk, Kaiser, Orcel and Küppers2004) that the link to the PPC is tentative, we compared the KW30 data points with the Towai kauri data set, to see if an alternative time range was possible for this series. We used OxCal with a uniform prior of (U(–120,120)) to account for the IH offset. The curve-match of KW30 with Towai resulted in six possible solutions (Table 4) of which only the younger two can be ignored with their large negative Delta_R values discordant with the expected IH offset values of ~40 yr, as indicated by the younger Towai/FIN11 data sets. This still leaves four possible positions, however, none of which can be entirely discounted.
Possible fits for 14C dates from tree KW30 compared with the Towai data set using a uniform reservoir function of Delta_R=(U(–120,120)).

^ n=10 , An=22.4%.
† df=9 (5% 16.9).
* IH=as derived from modeled Delta_R. See comments about the sign of the IH offset in the caption of Table 2.
As we were unable to assess the reliability of the Zurich pine KW30/German Cottbus linkage using only KW30 14C data, we matched the entire YD-B 14C chronology (including KW30) as a group to Towai to see if the larger 14C data series could provide a finite solution. Agreement data are given in Table 5. The YD-B tree-ring 14C data set, as it is positioned in IntCal13, is shown in Figure 4A.
Positioning of 14C dates from the YD-B tree-ring series: (A) as given in IntCal13; (B) curved-matched solution 1; (C) curve-matched solution 2. IntCal13 curve (black 1σ error bars) given in all plots.

Possible solutions for chronology YD-B compared with Towai using a uniform reservoir function of Delta_R=(U(–120,120)).

^ n=26, An=13.9%.
† df=25 (5% 37.6).
* IH=as derived from modeled Delta_R. See comments about the sign of the IH offset in the caption of Table 2.
Solution 3 can be ignored as the model fails for this position. Solution 2 (Figure 4C) can also be discounted, as the agreement index is low (63.4%), the YD-B data points at ~12,280 cal BP in this location are misaligned with the oldest PPC measurements, and the IH offset is –54 yr, compared with Holocene values averaging ~40 yr. Apart from the considerations discussed above, solution 1 is considered the most likely position, as it has the highest agreement index (202.6%) and closely follows the shape of the Towai data, with IH offset values (48±10 yr) statistically indistinguishable from the Holocene average of ~40 yr.
The accepted solution 1 calibrated age range for the YD-B series indicates that the ~10,400 14C BP plateau, as reported in IntCal13, is ~5 decades too short (Figure 4B). While 14C data sets from individual trees within YD-B cannot be satisfactorily curve-matched because of the ~10,400 14C BP plateau, the high YD-B chronology agreement values resulting from a match against Towai, provide confirmation in the integrity of this 14C chronology and maintenance of Holocene-like IH offset values for this time interval.
IntCal13 contains another series of Swiss pine 14C measurements for this period from a tree called Landikon F4 lying between 12,407.5 and 12,297.5 cal BP. Although it is not identified as such in IntCal13, this tree is floating (F Kaiser 2012, personal communication). We compared the Landikon F4 data points with the Towai kauri data set using a Delta_R uniform prior of U(–120,120) to see if the Landikon F4 data could help identify the correct shape for the NH curve. Landikon F4 locks onto Towai in six possible places, and as there is no single obvious solution, this data set cannot be used to identify the correct shape of the NH curve. Unless this sequence can be dendro-linked to other NH chronologies, it should be removed from future IntCal iterations.
(b) Connection of YD-B Tree-Ring Chronology to Floating Central European Lateglacial Pine Records (CELM)
Various methods have been used to obtain estimated calendar ages of the floating NH Lateglacial tree-ring 14C series. Kromer et al. (Reference Kromer, Friedrich, Hughen, Kaiser, Remmele, Schaub and Talamo2004) curve-matched the LGP dates against the marine Cariaco reference data set of Hughen et al. (Reference Hughen, Southon, Lehman and Overpeck2000) and found the sequence terminated at 12,844±32 cal BP. Muscheler et al. (Reference Muscheler, Kromer, Björck, Svensson, Friedrich, Kaiser and Southon2008, Reference Muscheler, Adolphi and Knudsen2014) correlated the Lateglacial 14C tree-ring records to ice-core timescales using the common cosmic production signal in the tree-ring 14C and ice-core 10Be concentrations. They determined the youngest part of the LGP record of Kromer et al. (Reference Kromer, Friedrich, Hughen, Kaiser, Remmele, Schaub and Talamo2004) at ~12,500 cal BP (Muscheler et al. Reference Muscheler, Kromer, Björck, Svensson, Friedrich, Kaiser and Southon2008) and considered the IntCal13 placement (IntCal13, data set 5 division 9–http://intcal.qub.ac.uk/intcal13/) of 12,597 cal BP too old (Muscheler et al. Reference Muscheler, Adolphi and Knudsen2014). Hua et al. (Reference Hua, Barbetti, Fink, Kaiser, Friedrich, Kromer, Levchenko, Zoppi, Smith and Bertuch2009) linked the LGP dates of Kromer et al. (Reference Kromer, Friedrich, Hughen, Kaiser, Remmele, Schaub and Talamo2004) to huon pine tree rings and derived an end date of 12,597±16 cal BP. Bronk Ramsey et al. (Reference Bronk Ramsey, Staff, Bryant, Brock, Kitagawa, van der Plicht, Schlolaut, Marshall, Brauer, Lamb and Payne2012) obtained an LGP end date of 12,627±35 cal BP based upon comparisons with the Lake Suigetsu data set.
The youngest 72 CELM 14C measurements (obtained from the IntCal13 database) overlap with the Towai data set and were compared with it using a uniform Delta_R prior of –120 to 120 yr. Despite the wide uniform prior, the model produced a single solution, with the youngest CELM date (G3: HD-22487) having a mean calendar age of 12,606±3 cal BP with a mean IH offset of 2.2±6.5 yr. This positioning places the youngest of the LGP samples (G5; HD-22482) at 12,618±3 cal BP. As the curve matches are based upon decadal data only, we consider the ±3 calendar year error overly precise. This calendar age is statistically indistinguishable from the IntCal13 placement and that determined by Hua et al. (Reference Hua, Barbetti, Fink, Kaiser, Friedrich, Kromer, Levchenko, Zoppi, Smith and Bertuch2009) and Bronk Ramsey et al. (Reference Bronk Ramsey, Staff, Bryant, Brock, Kitagawa, van der Plicht, Schlolaut, Marshall, Brauer, Lamb and Payne2012), but disagrees with the findings of Muscheler et al. (Reference Muscheler, Adolphi and Knudsen2014). The region of overlap between the CELM and Towai data sets is shown in Figure 5A.
Positioning of 14C dates from (A) the CELM 14C series and (B) the SWILM series, compared with the Towai, PPC, and YD-B (solution 1) data sets. IntCal13 curve (black 1σ error bars) also given.

To obtain the best possible fit between the CELM dates and Towai, we wanted to include in the match the short (~30 yr) 14C plateau occurring in the Towai curve at ~11,240 BP. This necessitated inclusion of CELM 14C dates older than the Towai curve (e.g. ~11,300 BP). As a result of this, no agreement data are available. However, it is clear from the plot and the outlier results that the CELM data generally agree well with Towai in the region of overlap. Seven data points (~10%) have posterior outlier values >10% (with one sample with a value of 29%), however, which suggests some additional scatter.
We also separately matched the 44 14C dates from the youngest part of the SWILM GAENALCH series (Kaiser at al. Reference Kaiser, Friedrich, Miramont, Kromer, Sgier, Schaub, Boeren, Remmele, Talamo, Guibal and Sivan2012), the youngest date from which is G5 (HD-22482). The advantage in using this series is that it completely spans the oldest part of the Towai chronology and 38 of the 14C dates (~87%) come from only two overlapping trees, G71 and G5, which together span the interval ~13,120–12,610 cal BP. The other six SWILM 14C dates come from the trees G28, G63, and G101. This model shows that the youngest SWILM date from G5 has a mean calendar age of 12,615±2 cal BP and a mean IH offset of –13.2±6.3 yr. In the model run for the CELM dates described above, the same sample had a mean age of 12,618±3, so the two runs resulted in statistically indistinguishable calendar placement. The SWILM data points are shown in Figure 5B. The complete SH Towai and FIN1114C time series are plotted with the NH CELM, YD-B (solution 1), and PPC data sets in Figure 6.
The complete SH Towai and FIN11 14C time series plotted with the NH CELM, YD-B, and PPC data sets. IntCal13 curve shown as a black line.

A summary of the calendar positioning of the SH (Towai and FIN11) and NH (PPC, YD-B, CELM) 14C time series derived from this research compared with the findings of Hua et al. (Reference Hua, Barbetti, Fink, Kaiser, Friedrich, Kromer, Levchenko, Zoppi, Smith and Bertuch2009) is given in Figure 7.
Temporal distribution of Northern and Southern Hemisphere Lateglacial tree-ring chronologies. The SH New Zealand kauri record (cross-hatched bar) has been locked to the absolutely dated Preboreal pine chronology (light gray; PPC; Friedrich et al. Reference Friedrich, Remmele, Kromer, Hofmann, Spurk, Kaiser, Orcel and Küppers2004) by 14C and serves as a 14C backbone through the Younger Dryas. The new kauri record enabled accurate curve-matching of the Northern Hemispheric floating Central European Lateglacial Master Chronology (black; CELM; Kaiser et al. Reference Kaiser, Friedrich, Miramont, Kromer, Sgier, Schaub, Boeren, Remmele, Talamo, Guibal and Sivan2012) and Younger Dryas B (black; YD-B; Hua et al. Reference Hua, Barbetti, Fink, Kaiser, Friedrich, Kromer, Levchenko, Zoppi, Smith and Bertuch2009). The former positions of the CELM and YD-B chronologies (dashed lines; Hua et al. Reference Hua, Barbetti, Fink, Kaiser, Friedrich, Kromer, Levchenko, Zoppi, Smith and Bertuch2009) are revised and adjusted in this work. The starting series of the PPC in this diagram is the Cottbus chronology beginning at 12,325 cal BP: the “Zurich” pine KW30 series is the end (youngest) member of the Hua et al. (Reference Hua, Barbetti, Fink, Kaiser, Friedrich, Kromer, Levchenko, Zoppi, Smith and Bertuch2009) YD-B series. In addition to the calendar timescale (cal BP), the diagram also shows the INTIMATE Greenland Isotope event stratigraphy (on the GICC05 timescale in cal BP; Blockley et al. Reference Blockley, Lane, Hardiman, Rasmussen, Seierstad, Steffensen, Svensson, Lotter, Turney and Bronk Ramsey2012; Rasmussen et al. Reference Rasmussen, Bigler, Blockley, Blunier, Buchardt, Clausen, Cvijanovic, Dahl-Jensen, Johnsen, Fischer, Gkinis, Guillevic, Hoek, Lowe, Pedro, Popp, Seierstad, Steffensen, Svensson, Vallelonga, Vinther, Walker, Wheatley and Winstrup2014) and European climate stratigraphy, including the Lateglacial Interstadial (the Bølling/Allerød); the onset of the YD is as given in Rach et al. (Reference Rach, Brauer, Wilkes and Sachse2014).

A comparison of the CELM and SWILM data sets with Towai and the time series plot in Figure 6 appear to show a sustained reduction in the IH offset for time periods older than ~12,700 cal BP. The IH offset for this older time interval is close to 0 yr (Table 6), compared with 48 to 37 yr for the younger YD-B, Towai, and FIN11 data sets. The IH offset for the time interval ~13,100–12,600 cal BP is clearly anomalous compared with typical values for younger time periods including the Holocene. If the reduction in offset noted in this research is confirmed by analysis of contemporaneous SH/NH sample pairs, it could be associated with increased ventilation of the Southern Ocean following the termination of the Antarctic Cold Reversal. This possibility is discussed fully in Hogg et al. (Reference Hogg, Southon, Turney, Palmer, Bronk Ramsey, Fenwick, Boswijk, Friedrich, Helle, Hughen, Jones, Kromer, Noronha, Reynard, Staff and Wacker2016).
Interhemispheric (IH) offset values for different tree-ring series or time intervals. See comments about the sign of the IH offset in the caption of Table 2.

^ Hogg et al. (Reference Hogg, McCormac, Higham, Baillie and Palmer2002).
* IH=as derived from modeled Delta_R.
Comparisons with Other 14C Time Series
In the following section, we compare the Towai 14C data set with other 14C records:
-
i. Huon pine (Hua et al. Reference Hua, Barbetti, Fink, Kaiser, Friedrich, Kromer, Levchenko, Zoppi, Smith and Bertuch2009);
-
ii. Speleothems (Bahamas: Beck et al. Reference Beck, Richards, Edwards, Silverman, Smart, Donahue, Hererra-Osterheld, Burr, Calsoyas, Jull and Biddulph2001; Hoffmann et al. Reference Hoffmann, Beck, Richards, Smart, Singarayer, Ketchmark and Hawkesworth2010; HuluH82: Southon et al. Reference Southon, Noronha, Cheng, Edwards and Wang2012);
-
iii. Lake Suigetsu terrestrial plant macrofossils (Bronk Ramsey et al. Reference Bronk Ramsey, Staff, Bryant, Brock, Kitagawa, van der Plicht, Schlolaut, Marshall, Brauer, Lamb and Payne2012);
-
iv. Marine archives including Cariaco (Hughen et al. Reference Hughen, Southon, Bertrand, Frantz and Zermeño2004, Reference Hughen, Southon, Lehman, Bertrand and Turnbull2006) and corals (Edwards et al. Reference Edwards, Beck, Burr, Donahue, Chappell, Bloom, Druffel and Taylor1993; Bard et al. Reference Bard, Arnold, Hamelin, Tisnerat-Laborde and Cabioch1998; Burr et al. Reference Burr, Beck, Taylor, Récy, Edwards, Cabioch, Corrège, Donahue and O’Malley1998, Reference Burr, Galang, Taylor, Gallup, Edwards, Cutler and Quirk2004; Cutler et al. Reference Cutler, Gray, Burr, Edwards, Taylor, Cabioch, Beck, Cheng and Moore2004; Fairbanks et al. Reference Fairbanks, Mortlock, Chiu, Cao, Kaplan, Guilderson, Fairbanks, Bloom, Grootes and Nadeau2005; Durand et al. Reference Durand, Deschamps, Bard, Hamelin, Camoin, Alexander, Thomas, Henderson, Yokoyama and Matsuzaki2013).
i. Huon Pine
The Tasmanian huon pine 14C chronology spans 617 yr during the early Younger Dryas (Hua et al. Reference Hua, Barbetti, Fink, Kaiser, Friedrich, Kromer, Levchenko, Zoppi, Smith and Bertuch2009). We compared the huon pine 14C data with the Towai series using an outlier model ((“SSimple”,N(0,2),0,“s”) with {Outlier, 0.05}) to improve the agreement. A comparison of all four huon trees as linked by Hua et al. (Reference Hua, Barbetti, Fink, Kaiser, Friedrich, Kromer, Levchenko, Zoppi, Smith and Bertuch2009) resulted in poor agreement with low convergence. Agreement was significantly better comparing the trees individually with Towai (Table 7), which also shows the differences between this comparison and the solution given by Hua et al. (Reference Hua, Barbetti, Fink, Kaiser, Friedrich, Kromer, Levchenko, Zoppi, Smith and Bertuch2009). Three of the four trees show a solution with a single range, with a mean difference of 42–53 yr older. The solution for SRT782 has a bimodal distribution and, using the three other results, we are able to identify the first (older) solution (22.1%) as the most likely one for this tree. Hua et al. (Reference Hua, Barbetti, Fink, Kaiser, Friedrich, Kromer, Levchenko, Zoppi, Smith and Bertuch2009) were unaware of the possibility of two positions for tree SRT782, which resulted in a more random spread of 14C ages on the 10,400 BP plateau. The four huon 14C series are plotted against Towai data in Figure 8.
Tasmanian huon data sets (Hua et al. Reference Hua, Barbetti, Fink, Kaiser, Friedrich, Kromer, Levchenko, Zoppi, Smith and Bertuch2009) plotted with Towai/FIN11 5-point moving average.

Calendar placement of huon pine 14C tree-ring series compared with Towai.

Although the huon data show more variability, the structure visible in the 14C distributions is clearly displayed by both huon and Towai data sets.
ii. Speleothems
Bahamas speleothems (GB89-24, Beck et al. Reference Beck, Richards, Edwards, Silverman, Smart, Donahue, Hererra-Osterheld, Burr, Calsoyas, Jull and Biddulph2001 and GB89-25, Hoffmann et al. Reference Hoffmann, Beck, Richards, Smart, Singarayer, Ketchmark and Hawkesworth2010 )
The two Bahamas speleothem records show relatively high levels of detrital thorium and large dead carbon fraction (DCF) values: 1512±244 yr for GB89-24 and 2139±313 yr (revised to 2500±90 yr in IntCal13 based on modeling against the Lake Suigetsu data set) for GB89-25-3. In addition, both records deviate significantly from the tree-ring data, particularly for samples younger than ~13,000 cal BP, and large errors have therefore been assigned to the DCF-corrected values in IntCal13. The growth of the Bahamas speleothems was slowing down in the YD, before finally ceasing in the early Holocene when they became submerged. During the interval ~12,600–12,100 cal BP, the GB89-24 data are clearly too young, while the GB89-25 data set is close to ~500 yr too old. The two speleothem data sets are compared with the NH and SH data sets in Figure 9A.
Comparison of YD terrestrial records with tree-ring 14C data sets: (A) GB89-24 (Beck et al. Reference Beck, Richards, Edwards, Silverman, Smart, Donahue, Hererra-Osterheld, Burr, Calsoyas, Jull and Biddulph2001) and GB89-25 (Hoffmann et al. Reference Hoffmann, Beck, Richards, Smart, Singarayer, Ketchmark and Hawkesworth2010) speleothems and (B) HuluH82 speleothem (Southon et al. Reference Southon, Noronha, Cheng, Edwards and Wang2012) and Lake Suigetsu macrofossils (Bronk Ramsey et al. Reference Bronk Ramsey, Staff, Bryant, Brock, Kitagawa, van der Plicht, Schlolaut, Marshall, Brauer, Lamb and Payne2012).

HuluH82 ( Southon et al. Reference Southon, Noronha, Cheng, Edwards and Wang2012 )
The Hulu Cave H82 speleothem (HuluH82), from a site in eastern China, provided an atmospheric 14C record with calendar ages established by U-Th series dating and spanning 26,800–10,600 cal BP. The atmospheric data set was determined by subtracting the DCF from the measured 14C ages. The DCF, determined by comparison of contemporaneous speleothem and IntCal09 tree-ring measurements, was found to be remarkably constant with a value of 450±50 yr.
The HuluH82 data agree very closely with the Towai/FIN11 data sets (Figure 9B) except for two data points at 12,558 cal BP, which appear to be ~170 14C yr too old. We compared HuluH82 with Towai/FIN11, using a uniform Delta_R of –120 to +120 yr and Outlier_Model(“RScaledN”,N(0,1),U(0,4),“r”); with {Outlier, 0.05} to test the accuracy and precision of both data sets for the common time interval (Figure 9B and Table 8).
Calendar placement of HuluH82 speleothem and Lake Suigetsu macrofossil 14C values compared with Towai/FIN11, using Outlier_Model(“RScaledN”,N(0,1),U(0,4),“r”) with {Outlier, 0.05} and Delta_R(U(-120,120));.

* Speleothem measurements corrected for DCF.
# Four outliers with posterior outlier values >30% removed.
The HuluH82 measurements matched against Towai/FIN11 have a high agreement index (Acomb=192.9, n=38, An=11.5), with only one outlier >10%. Although the modeled age is close to the measured calendar ages within errors, the curve-match has effectively shifted the HuluH82 series ~37 yr towards younger ages. We are unsure why the HuluH82 12,558 cal BP values are older, but they may reflect a discrepancy in the U-Th ages or an error in the match of the 14C curves (and hence on the shape of these curves).
iii. Lake Suigetsu
Floating terrestrial 14C data were obtained from measurements on terrestrial plant macrofossils extracted from varved sediments in Lake Suigetsu (SG062012), Japan (Bronk Ramsey et al. Reference Bronk Ramsey, Staff, Bryant, Brock, Kitagawa, van der Plicht, Schlolaut, Marshall, Brauer, Lamb and Payne2012). We compared SG062012 data with Towai, using a uniform Delta_R of –120 to 120 yr and Outlier_Model(“RScaledN”,N(0,1),U(0,4),“r”) with {Outlier, 0.05} to test the accuracy and precision of both data sets for the common time interval (Table 8 and Figure 9B). The Suigetsu data set also matches Towai closely (Acomb=146.3, n=50, An=10.0) when the four most prominent outliers are removed (Table 8). Despite the larger scatter and higher uncertainties, the Suigetsu data, within its stated uncertainties, conforms to Towai data and reinforces the view that the Towai kauri data set is correctly linked to IntCal13.
The Suigetsu and HuluH82 data for the interval ~12,200–11,900 cal BP seem to follow the Towai curve and not the younger IntCal13 envelope, although there are too few data points for this to be definitive.
iv. Marine 14C Archives
A comparison of marine and tree-ring 14C data is important because it provides a means of calculating the local marine reservoir correction (R value, the difference in 14C yr between the marine and atmospheric 14C ages) for each marine archive. In using marine data to provide an atmospheric 14C record, an assumption is made that the R value is constant and it is already known that this is not always the case. The R value in Cariaco Basin varved records, for example, deviates significantly during distinct intervals in both the YD (Kromer et al. Reference Kromer, Friedrich, Hughen, Kaiser, Remmele, Schaub and Talamo2004; Muscheler et al. Reference Muscheler, Kromer, Björck, Svensson, Friedrich, Kaiser and Southon2008; Hua et al. Reference Hua, Barbetti, Fink, Kaiser, Friedrich, Kromer, Levchenko, Zoppi, Smith and Bertuch2009; Hogg et al. Reference Hogg, Southon, Turney, Palmer, Bronk Ramsey, Fenwick, Boswijk, Friedrich, Helle, Hughen, Jones, Kromer, Noronha, Reynard, Staff and Wacker2016) and Heinrich Stadial 1 (Southon et al. Reference Southon, Noronha, Cheng, Edwards and Wang2012; Reimer et al. Reference Reimer, Bard, Bayliss, Beck, Blackwell, Bronk Ramsey, Grootes, Guilderson, Haflidason, Hajdas, Hatté, Heaton, Hoffmann, Hogg, Hughen, Kaiser, Kromer, Manning, Niu, Reimer, Richards, Scott, Southon, Staff, Turney and van der Plicht2013) and for this reason, the derived atmospheric 14C values for these time intervals were omitted from IntCal13. Comparison of marine data with the more accurate SH and NH records presented here could provide more robust R values and hence more reliable atmospheric data derived from the marine archives.
The reservoir-corrected Pacific coral records are compared with the tree-ring records in Figure 10A. The Kiritimatai (Fairbanks et al. Reference Fairbanks, Mortlock, Chiu, Cao, Kaplan, Guilderson, Fairbanks, Bloom, Grootes and Nadeau2005), Tahiti and Mururoa (Bard et al. Reference Bard, Arnold, Hamelin, Tisnerat-Laborde and Cabioch1998), Vanuatu (Burr et al. Reference Burr, Beck, Taylor, Récy, Edwards, Cabioch, Corrège, Donahue and O’Malley1998), Tasmaloum (Cutler et al. Reference Cutler, Gray, Burr, Edwards, Taylor, Cabioch, Beck, Cheng and Moore2004), and Tahiti (Durand et al. Reference Durand, Deschamps, Bard, Hamelin, Camoin, Alexander, Thomas, Henderson, Yokoyama and Matsuzaki2013) records (Figure 10A) are in general agreement with the tree-ring data sets, suggesting that the R values for these sites are accurate, at least for this time period. This contrasts with Papua New Guinea (PNG) data (Figure 10A; Edwards et al. Reference Edwards, Beck, Burr, Donahue, Chappell, Bloom, Druffel and Taylor1993; Burr et al. Reference Burr, Galang, Taylor, Gallup, Edwards, Cutler and Quirk2004; Cutler et al. Reference Cutler, Gray, Burr, Edwards, Taylor, Cabioch, Beck, Cheng and Moore2004), which are 150–320 14C yr too young for the interval 14,180–10,670 cal BP. Reservoir age discrepancies in the PNG records are likely caused by the complex interplay of ocean currents encircling PNG, as indicated by marine shell/identified charcoal paired dates and pre-1950 shell dates derived from archaeological sites, with R values for the Huon Peninsula ranging from 71±51 yr to 611±16 yr (Petchey and Ulm Reference Petchey and Ulm2012). The large range of R values for PNG have resulted in a large error term for ages used in IntCal13 (R=495±155), with the R errors propagated with the 14C date measurement errors.
Comparison of marine records with tree-ring 14C data sets: (A) Pacific marine corals (Papua New Guinea: Cutler et al. Reference Cutler, Gray, Burr, Edwards, Taylor, Cabioch, Beck, Cheng and Moore2004; Edwards et al. Reference Edwards, Beck, Burr, Donahue, Chappell, Bloom, Druffel and Taylor1993; Burr et al. Reference Burr, Galang, Taylor, Gallup, Edwards, Cutler and Quirk2004. Tahiti and Mururoa: Bard et al. Reference Bard, Arnold, Hamelin, Tisnerat-Laborde and Cabioch1998; Durand et al. Reference Durand, Deschamps, Bard, Hamelin, Camoin, Alexander, Thomas, Henderson, Yokoyama and Matsuzaki2013. Kiritimatai: Fairbanks et al. Reference Fairbanks, Mortlock, Chiu, Cao, Kaplan, Guilderson, Fairbanks, Bloom, Grootes and Nadeau2005. Vanuatu: Burr et al. Reference Burr, Beck, Taylor, Récy, Edwards, Cabioch, Corrège, Donahue and O’Malley1998. Tasmaloum: Cutler et al. Reference Cutler, Gray, Burr, Edwards, Taylor, Cabioch, Beck, Cheng and Moore2004. Urlepa: Cutler et al. Reference Cutler, Gray, Burr, Edwards, Taylor, Cabioch, Beck, Cheng and Moore2004); (B) North Atlantic marine (Cariaco varved sediments: Hughen et al. Reference Hughen, Southon, Bertrand, Frantz and Zermeño2004, Reference Hughen, Southon, Lehman, Bertrand and Turnbull2006. Barbados corals: Bard et al. Reference Bard, Arnold, Hamelin, Tisnerat-Laborde and Cabioch1998; Fairbanks et al. Reference Fairbanks, Mortlock, Chiu, Cao, Kaplan, Guilderson, Fairbanks, Bloom, Grootes and Nadeau2005).

The reservoir-corrected Atlantic marine records are compared with tree-ring data in Figure 10B. As noted by earlier studies (e.g. Kromer et al. Reference Kromer, Friedrich, Hughen, Kaiser, Remmele, Schaub and Talamo2004; Hua et al. Reference Hua, Barbetti, Fink, Kaiser, Friedrich, Kromer, Levchenko, Zoppi, Smith and Bertuch2009; Hogg et al. Reference Hogg, Southon, Turney, Palmer, Bronk Ramsey, Fenwick, Boswijk, Friedrich, Helle, Hughen, Jones, Kromer, Noronha, Reynard, Staff and Wacker2016), the Cariaco Basin varved foraminifera sediment record shows very good agreement before ~12,920 cal BP and after ~12,640 cal BP. The interval ~12,920 to 12,640 cal BP shows systematic differences, however, due to reduced R value, possibly as a result of freshwater hosing reducing Atlantic Meridional Overturning Circulation (AMOC), discussed more fully by Hogg et al. (Reference Hogg, Southon, Turney, Palmer, Bronk Ramsey, Fenwick, Boswijk, Friedrich, Helle, Hughen, Jones, Kromer, Noronha, Reynard, Staff and Wacker2016). The Barbados coral records (Bard et al. Reference Bard, Arnold, Hamelin, Tisnerat-Laborde and Cabioch1998; Fairbanks et al. Reference Fairbanks, Mortlock, Chiu, Cao, Kaplan, Guilderson, Fairbanks, Bloom, Grootes and Nadeau2005) are in reasonable agreement with the tree-ring data sets except for some data points around 12,100–12,250 cal BP, but follow Cariaco in deviating towards younger ages in the ~12,920–12,640 cal BP interval.
Revised Southern Hemisphere and Northern Hemisphere Tree-Ring-Based Comparison Curves for the LGIT
We have improved the calendar-age positioning of LGIT/early Holocene NH tree-ring 14C records, as a result of anchored Towai and FIN11 kauri data sets and repositioned NH floating YD-B and CELM 14C series, allowing us to develop comparison curves that span almost all of the LGIT. As a consequence, we can now present tree-ring-based SH (SHkauri16) and NH (NHpine16) comparison curves, which can be accessed from the OxCal web site (https://c14.arch.ox.ac.uk/oxcal) and are not subject to the errors occurring in SHCal13 and IntCal13. These errors include ages that are too young between ~12,200–11,900 cal BP (the time interval previously occupied by the Swiss larch Ollon505 data set; Hogg et al. Reference Hogg, Turney, Palmer, Southon, Kromer, Bronk Ramsey, Boswijk, Fenwick, Noronha, Staff and Friedrich2013a), and the time interval ~12,450–12,150 cal BP, where the ~10,400 14C BP plateau is ~5 decades too short, resulting in a better placement of the YD-B and CELM pine series.
These new comparison curves, used in conjunction with the official calibration curves SHCal13 and IntCal13, will give researchers more confidence when calibrating samples within the LGIT/early Holocene. The curves contain only tree-ring-based 14C data, with the SH curve spanning 13,134–0 cal BP and the NH curve 14,174–0 cal BP. Adjustments have been made to the NH comparison curve for the interval 12,164–11,874 cal BP by inserting SH kauri data, adjusted for an IH offset of 40±13 yr (the measured 2nd millennium AD value derived from Hogg et al. Reference Hogg, McCormac, Higham, Baillie and Palmer2002; Table 6) and adding the errors in quadrature. An approximate IH offset value of 40 yr can be justified because earlier time periods (e.g. 12,615–12,292, the YD-B interval; Table 6) as well as later time periods (e.g. 11,864–11,694, the youngest Towai dates; Table 6) have IH offset values in this range (48±10 yr and 38±8 yr, respectively). This approximation should be more accurate than IntCal13 for this part of the curve, but new NH data are required to confirm this. The SH and NH comparison curves for the interval 13,200–11,200 cal BP are given in Figures 11–13.
SH (SHkauri16, black) and NH (NHpine16, red) comparison curves for the interval 13,200–11,200 cal BP (see text for more details).

SH (SHkauri16) curve and data points plotted with the SHCal13 curve for the interval 13,200–11,200 cal BP. Measured Towai and FIN11 data are appended to IntCal13 RWM data at 11,365 cal BP (see text for more details).

NH (NHpine16) curve and data points plotted with the IntCal13 curve for the interval 13,200–11,200 cal BP. A 5-point moving average has been applied to the revised decadal NH data points, from 14,120–11,420 cal BP. IntCal13 RWM data is appended at 11,415 cal BP (see text for more details).

The SH curve (Figure 12) has 5-yr resolution. It uses the decadal kauri data given by Hogg et al. (Reference Hogg, Southon, Turney, Palmer, Bronk Ramsey, Fenwick, Boswijk, Friedrich, Helle, Hughen, Jones, Kromer, Noronha, Reynard, Staff and Wacker2016) from 13,130–11,365 cal BP appended to SHCal13 random walk model (RWM) data from 11,360–0 cal BP. We have not averaged the decadal kauri data (Towai plus FIN11) as the 193 decadal means given by Hogg et al. (Reference Hogg, Southon, Turney, Palmer, Bronk Ramsey, Fenwick, Boswijk, Friedrich, Helle, Hughen, Jones, Kromer, Noronha, Reynard, Staff and Wacker2016) are derived from 1035 measurements.
The NH curve (Figure 13) also has 5-yr resolution. Because the NH data (online Supplementary Material, Radiocarbondating results.xls/NH) are not derived from decadal means, we have used a 5-point moving average (weighted 0.1, 0.2, 0.4, 0.2, 0.1) for the revised NH decadal measurements from 14,174–11,420 cal BP. IntCal13 RWM data is appended from 11,415–0 cal BP. Towai kauri decadal data minus an IH offset value of 40±13 yr has been inserted into the interval 12,164–11,874 cal BP in the absence of other NH data as detailed above. Three NH data points (HD-16342, HD-16427, and HD-20699) in this interval may be a little too young and have been removed. It should be stressed that the comparison curves presented here are not official calibration curves and will be supplanted by SHCal and IntCal revisions that are in progress.
CONCLUSIONS
14C measurements from the New Zealand 37-tree Towai kauri chronology (confirmed by additional measurements from the tree FIN11) provide a secure lock with the absolutely dated European Pre-boreal pine chronology (PPC) and define the shape of the atmospheric 14C curves from ~13,100–11,700 cal BP. The 14C calibration curve IntCal13 is clearly aberrant from ~12,200–11,900 cal BP, the time interval previously occupied by the discarded Ollon505 series (within the YD), with new measurements on existing calendar-dated trees from Germany in preparation. Comparisons between 14C data from the YD-B chronology and Towai kauri data indicate that the YD-B chronology is incorrectly linked by dendrochronology to the PPC (Cottbus) tree-ring chronology. Because of the incorrect placement of KW30, the youngest of the YD-B series, the ~10,400 BP 14C plateau in the current calibration data set IntCal13 is ~5 decades too short and should extend from ~12,450–12,150 cal BP. The floating Swiss pine 14C data set Landikon F4 is incorrectly located in IntCal13 and should be removed from the NH calibration data set if it cannot be dendro-linked to other NH chronologies. Furthermore, the new Towai/FIN11 kauri data sets indicate that the Central European Lateglacial Master (CELM) series begins at ~14,174 cal BP and ends at ~12,618 cal BP.
The new Towai chronology significantly improves 14C calibration during the LGIT. The new SH (SHkauri16) and NH (NHpine16) comparison curves for the Lateglacial presented here are available via the OxCal calibration software, and may be used in conjunction with the official calibration curves SHCal13 and IntCal13 until revised curves are available. The 14C interhemispheric offset appears to be lower during the early part of the YD, and changes at ~12,660 cal BP to Holocene-like levels, suggesting significant changes in Southern Ocean ventilation. This finding is based upon existing published data sets complied by different labs, however, and needs to be confirmed by analysis of contemporaneous SH/NH sample pairs.
ACKNOWLEDGMENTS
We thank Mr A Crawford who owns Towai Farm for access to the site and Mr N Parker for providing the wood. This work was part funded by the Foundation for Research, Science and Technology (FRST)—now Ministry for Business, Innovation & Employment (MBIE)-PROP-20224-SFK-UOA), a Royal Society of New Zealand grant, the Australian Research Council (FL100100195 and DP0664898), and the Natural Environment Research Council (NE/H009922/1, NE/I007660/1, NER/A/S/2001/01037 and NE/H007865/1). Two anonymous reviewers kindly helped improve the original manuscript.
SUPPLEMENTARY MATERIAL
To view supplementary material for this article, please visit http://dx.doi.org/10.1017/RDC.2016.86



