1. Introduction
Achieving a diversified and sustainable energy supply for future generations is one of the major challenges for today's policymakers. Global energy demand is projected to grow by around 45 per cent by 2030: more than three-quarters of the increased demand will come from developing and transition countries (IEA, 2008). Energy demand will continue to be covered mainly by conventional fossil fuels, such as coal, oil and natural gas; accordingly, energy-related pollution is predicted to increase by up to 45 per cent. Although Organization for Economic Co-operation and Development (OECD) countries will still be major polluters, 97 per cent of the estimated increase will come from non-OECD countries, especially China, India and the Middle East (IEA, 2008). Meanwhile, many estimates predict that oil and possibly natural gas production will plateau around the same time, casting doubt on future energy security.Footnote 1 Hence, achieving a sustainable energy supply requires diversifying energy sources and changing the current dependence on non-renewable and polluting hydrocarbon fuels. For example, in a recent report the UN Commission on Sustainable Development states:
‘Energy is crucial for sustainable development, poverty eradication and achieving the internationally agreed development goals, including the Millennium Development Goals. [. . .] Access to reliable, affordable, economically viable, socially acceptable and environmentally sound energy services is crucial, particularly in developing countries. [. . .] While fossil fuels will continue to play an important role in the energy supply in the decades to come, every effort must be made to diversify the energy mix’ (UN, 2007: 15).
Renewable energy technologies (RETs) can bring about both environmental and socio-economic benefits.Footnote 2 They generally entail fewer emissions, use local resources – including labour – foster basic electrification in developing countries and increase energy security.Footnote 3 However, although there are already several commercially available and economically attractive RETs, they still account for only a modest proportion of global energy generation. This fact suggests that there are some missing links between the potential of RETs and their implementation. One problem regards the institutional framework and the absence of a policy design to effectively foster RETs. In this paper, we focus on another important missing link: the financing of renewable energy (RE) projects, in particular the relationship between financial sector and RET development in transition and developing countries.This missing link has been pointed out by numerous practitioners, who see the absence of well-developed financial intermediaries and the consequent financing difficulties as one of the most important obstacles during the realization of RE projects in developing countries (e.g., Painuly and Wohlgemuth, Reference Painuly and Wohlgemuth2006).
Energy projects generally demand high levels of financing, which producers in less developed economies in particular can rarely cover on their own (World Bank, 1999; IEA, 2003). In turn, the financing for RETs is closely connected to the development of the financial sector. On the one hand, energy sector privatisation and liberalisation during the course of the 1990s increased the contribution of smaller private power projects, and at the same time induced a shift in external financing from the local government and multilateral institutions to private investors (Babbar and Schuster, Reference Babbar and Schuster1998; Tharakan et al., Reference Tharakan, de Castro and Kroeger2007; Tirpak and Adams, Reference Tirpak and Adams2008). On the other hand, RE projects have very high start-up costs relative to the expected monetary returns, and lengthy payback periods: they therefore typically require long-term maturity loans (UNEP FI, 2004; Sonntag-O'Brien and Usher, Reference Sonntag-O'Brien and Usher2004b). The result was a plunge in energy project investment in the mid 1990s as large bilateral and multilateral donors pulled out, and investment in this sector has struggled to take off again.
The problem of financing RE projects is twofold: firstly, RET firms generally need long-term loans, whose availability in turn is positively linked to the development of the banking system (Demirgüç-Kunt and Maksimovic, Reference Demirgüç-Kunt and Maksimovic1999). In less developed economies, the banking sector is the major source of external financing (Tadesse, Reference Tadesse2002; Carlin and Mayer, Reference Carlin and Mayer2003; Beck et al., Reference Beck, Demirgüç-Kunt and Maksimovic2004b), and access to bank credit is a serious problem especially for small- and medium-sized companies (Beck et al., Reference Beck, Demirgüç-Kunt, Laeven and Maksimovic2004a). As a consequence, RE projects in less developed countries are at a particular disadvantage. Secondly, RET firms have limited access to financing because RE projects compete against fossil fuel projects, which have a longer track record, relatively lower up-front costs, shorter lead times, and often favourable political treatment (Churchill and Saunders, Reference Churchill and Saunders1989; Head, Reference Head2000; World Bank, 2002; Sonntag-O'Brien and Usher, Reference Sonntag-O'Brien and Usher2004b).
It is worth noting that in both cases, underinvestment in RET firms can be interpreted in terms of imperfect information between firms and financiers: projects aimed at developing new technologies bear, almost by definition, greater information costs to investors, which are more easily borne by a highly developed financial sector. Where the latter is not given, the result may well be a market distortion in favour of less risky investments, such as fossil fuel projects and large-sized enterprises. This is consistent with the view that the development of the domestic financial sector is a crucial factor in meeting the booming energy demand in less developed economies (Ishiguro and Akiyama, Reference Ishiguro and Akiyama1995; World Bank, 2003).
RE adoption is one of the targets of the Kyoto Protocol. There are two mechanisms in particular which can potentially help to overcome the financing hurdle, namely the Clean Development Mechanism (CDM) and the Joint Implementation (JI) programme. Both are designed to help Kyoto Protocol member countries – in particular Annex B countries – meet their emission targets, and to encourage the private sector to contribute to emission reduction efforts (see e.g., Pacudan, Reference Pacudan and Iacomelli2005). The CDM mechanism, in particular, has been quite popular since its inception in 2006, with more than 1,000 projects already approved. It is the only Kyoto Protocol mechanism that includes developing countries: it allows Annex B countries that are subject to emission-reduction targets to implement emission-reduction projects in non-Annex B developing countries, and earn certified emission reduction credits (JI programmes on the other hand involve joint projects by two Annex B countries). Some RE projects were already initiated in the late 1990s as CDM or JI pilot programmes, such as the Tejona wind farm in Costa Rica.Footnote 4 The Kyoto Protocol's adoption in December 1997 obviously marks a major change in global climate policy: we incorporate the potential ‘Kyoto effects’ into our study to further isolate the impact of financial sector development on the RE sector. However, it is still too early to gauge the full impact of the new Kyoto financing possibilities on the adoption of RE in developing and transition countries; this question is therefore left to future research.Footnote 5
The analysis of the role of the financial sector – commercial banking, financial markets, insurance, etc. – for economic performance has generated a vast literature during the past two decades (see e.g., Demirgüç-Kunt and Levine, Reference Demirgüç-Kunt and Levine2001 for an overview). The importance of the (private) financial sector particularly for the development of the energy sector has also been pointed out in several studies. In one of the earliest analyses of energy sector financing in developing countries, Churchill and Saunders (Reference Churchill and Saunders1989) discuss a proper policy framework to encourage private sector financial involvement. Ten years later, Babbar and Schuster (Reference Babbar and Schuster1998) and Head (Reference Head2000) still find substantial gaps in the financing of power projects, particularly RE projects. The financing obstacles for RETs are confirmed in the overview by Wohlgemuth and Painuly (Reference Wohlgemuth and Painuly1999), where efforts in different countries and regions are discussed and several policy recommendations derived. More recently, Sonntag-O'Brien and Usher (Reference Sonntag-O'Brien and Usher2004a) and Painuly and Wohlgemuth (Reference Painuly and Wohlgemuth2006) take a look at the experience to date with RET implementation in developing and transition countries, and again point to the (private sector) financing problems that RE projects encounter, as well as to some successful models that have been adopted. MacLean and Siegel (Reference MacLean and Siegel2007) concentrate on the financing of small-scale RE projects and distinguish three financing areas: end-user finance, business finance and small-scale project finance. The need for well-informed (local) commercial financiers, often to act as financing partners for the government and/or international development organizations, is a recurrent theme in all three areas.Footnote 6
Despite the importance of the financial sector for the development of RETs particularly in developing and transition countries, which is borne out by numerous case studies and anecdotal evidence, the subject has received little academic research attention. This paper contributes to the knowledge on what determines RET implementation by empirically analysing the relationship between financial intermediation and RE sector development, with a focus on non-OECD countries. To the best of our knowledge, this is the first attempt to examine this issue in a systematic empirical analysis.Footnote 7
The literature discussed above suggests that a more highly developed financial sector will have a positive impact on the development of the RE sector. A well-functioning and unrestricted banking sector should be particularly relevant for credit allocation to RE companies in developing and transition countries, where financial markets are still relatively small and bond or equity financing is therefore difficult or impossible. Of course, a well-developed financial sector alone is no guarantee for the success of RETs: the availability of adequate financing mechanisms should be viewed in the wider context of an appropriate RE policy framework.Footnote 8
We propose an empirical framework to test the effect of financial sector development on RETs. We construct a panel dataset for up to 119 non-OECD countries for the period 1980–2006, using electricity generation per capita from RE technologies as a proxy for RE sector development. We isolate the financial sector effects by controlling for energy-relevant policy measures, as well as measures of more general institutional quality. The empirical results from generalised least squares (GLS) and dynamic Arellano–Bond Generalised Method-of-Moments (GMM) panel estimations confirm the positive effect of financial sector and especially commercial banking sector development on RET use in developing and transition countries. The effects are particularly strong and economically significant for the newer RETs, including wind, solar, geothermal and biomass, while the overall impact on RE and hydropower generation is much more limited in magnitude, though still statistically significant.
The results also suggest that the adoption of the Kyoto Protocol has had a strong positive effect on the diffusion of RETs throughout developing and transition countries. The findings are robust to the inclusion of other covariates which could influence RE sector development, such as oil, coal and natural gas production and prices and proxies for RE potential. The implication is that without proper (private sector) finance, RE is unlikely to reach its full potential in the developing world. An adequate financing framework should therefore be part of a more general RE sector development policy.
The paper is organised as follows. The data and empirical methodology are described in section 2, while the results are presented in section 3. Section 4 concludes with a brief summary and discussion.
2. Data and methodology
The discussion of the role of commercial finance in the development of RE has so far been based mainly on case studies and anecdotal evidence. The lack of a more systematic empirical analysis of the correlation between financial sector and RE development, independent of (or complementary to) a specific RE policy framework, has probably also been due to the data problem regarding the quantification of the RE sector, especially in the developing world.
The obstacles begin with the definition of RE in official statistics: traditionally, hydropower – mostly provided by large plants – has delivered the lion's share of RE in countries’ energy generation mix, with other types of RE – when included – making up barely a few per cent of overall energy production. Recently, however, some environmentalists and policymakers have contended that large hydropower projects should not be viewed as viable contributions to sustainable energy production, as they often cause serious negative environmental and social externalities (notable examples are the giant Three Gorges Dam on the Yangtze River in China or the Ilisu dam project in Turkey). Moreover, most traditional, large hydro projects in the developing world have been co-financed by multilateral financial institutions and the local governments, with little or no involvement sought of commercial finance (World Bank, 2003). The use of an overall RE measure could therefore introduce a downward bias into the results on the importance of the financial sector for more modern RETs such as wind, geothermal and solar power. A further possible issue concerns the negative impact on agricultural (food) production of encouraging biomass production for use as biofuel, as demonstrated by the recent large fluctuations in the prices of grains and other foodstuffs.
We consider these issues when testing the importance of financial intermediation for RET development. First, we distinguish between different types of RE generation, in addition to the aggregate measure. Second, as a proxy for our dependent variable, RE sector development, we use electricity generated with renewable resources in per-capita terms, and therefore avoid the issue of biofuels.
We construct three separate measures of RE sector development. The first, repc, measures the overall renewable resource electricity generation – including all types of hydropower, wood and waste, geothermal, solar and wind – in billion kwh per capita. The second variable, hydropc, considers only hydroelectric power generation, again in billion kwh per capita. This distinction takes into account the importance of large hydropower in electricity generation, and their possible distorting effect on the results found using the data on total RE generation. The third and final dependent variable, geopc, considers electricity produced from all non-hydro RE types including some of the latest RETs, i.e., geothermal, solar, wind and wood and waste energy resources. Again, this measure is in billion kwh per capita.
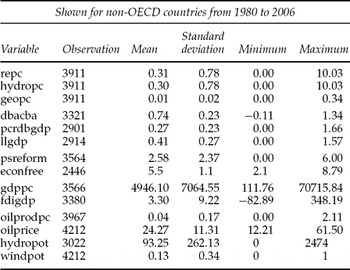
The electricity generation data for all three dependent variables is freely available from the US Energy Information Administration (EIA) on a yearly basis since 1980 (or since the early 1990s for countries of the former Soviet Union and former Yugoslavia). The EIA notes that the sum of components in the data may not equal the total listed due to independent rounding. Detailed descriptions of all variables and their sources can be found in the appendix. The descriptive statistics in table 1 show that the dependent variables repc and hydropc have a wide variation in per capita RE resource intensity, while the generation of non-hydro renewable resource electricity (geopc) is more limited.
Descriptive statistics

A look at the share of RE in overall electricity generation shows that on average, in non-OECD countries around 34 per cent of electric power was produced by RE resources between 1980 and 2006, compared with around 32 per cent in OECD countries. This relatively similar picture remains when we consider the share of hydroelectric power generation in overall electricity generation, which was on average around 33 per cent for non-OECD and 29 per cent for OECD countries. In both groups of countries, hydropower covered from 0 per cent right up to 100 per cent of total electricity generation. The situation is more varied when we look at the non-hydro RE share: in non-OECD countries, wood, waste, wind, solar and geothermal energy produced barely 1 per cent of total electricity on average, but up to 40 per cent in low- to middle-income countries like El Salvador and Nicaragua. In OECD countries, the average share of electricity generated from non-hydro RE was three per cent, reaching up to nearly 20 per cent in Luxembourg and 30 per cent in Denmark.Footnote 9
As noted above, the adoption of the Kyoto Protocol in late 1997 marks a huge shift in global climate policy, which also affects RE policy. It is therefore interesting to examine the data for any prima facie evidence of a change in RE use since 1998. In general, there has indeed been an increase in electricity generation with RETs in non-OECD countries: overall RE electricity generation went from an average of 263.4 million kwh per capita before Kyoto to 393.8 million kwh per capita post-Kyoto. This was due to a large increase in hydropower, but also to a near doubling of non-hydro electricity production from an average 5 million kwh per capita to 9.6 million kwh per capita. Further analysis reveals that the post-Kyoto increase in RE use is common for all country income groups. It is also observable in all regions of the world, with a particularly large jump in RE use in South-Eastern Asia: here, average overall RE electricity generation went from 295.8 billion kwh per capita to 507.8 billion kwh per capita post-Kyoto. Again, most of the increase in this region comes from more hydropower; but non-hydro electricity generation increased more than 27-fold from a comparatively very modest 21 thousand kwh per capita to an average 569.4 thousand kwh per capita in the period after 1998. These initial findings are suggestive of a strong ‘Kyoto effect’, which we will test for in the estimations below.
The main explanatory variables include three different indicators of financial sector development, and a vector of control variables. The measures of financial sector development are taken from Beck et al. (Reference Beck, Demirgüç-Kunt and Levine2000). They are not direct measures of banks’ efficiency in credit allocation, but rather different proxies for financial intermediary development tested in the literature.Footnote 10 The first indicator of financial sector development, dbacba, measures the importance of commercial banks’ asset share versus that of the central bank. In more highly developed and open economies, the commercial financial sector handles a greater share of household savings than the central bank. Assuming that the commercial financial sector is more efficient than the public one in allocating credits, dbacba should positively correlate with RET development. This variable has also been tested several times in the finance literature, e.g., in King and Levine (Reference King and Levine1993a, Reference King and Levineb) and Levine et al. (Reference Levine, Loayza and Beck2000).
The second variable, pcrdbgdp, captures the amount of credit provided by financial institutions to the private sector as a share of gross domestic product (GDP). It excludes credits issued by governments and development banks. An unrestricted financial sector can be expected to account for a larger share of lending to the private sector. In fact, this variable has been shown by Levine et al. (Reference Levine, Loayza and Beck2000) to be a reliable measure of financial intermediary development, i.e., the ability of financial institutions to efficiently mobilise and allocate resources to profitable ventures. Earlier versions of the measure were used for example in King and Levine (Reference King and Levine1993a, Reference King and Levineb) and Levine and Zervos (Reference Levine and Zervos1998). We expect pcrdbgdp to correlate positively with the level of development of the RE sector.
The third and final financial variable, llgdp, is a general measure of financial sector development commonly known as ‘financial depth’. It is defined as liquid liabilities of the financial system – currency plus demand and interest-bearing liabilities of banks and other financial intermediaries or, more generally, M2 – divided by GDP. Financial depth is the broadest measure of financial intermediation, giving an indication of the overall size of the financial sector without distinguishing either between commercial and non-commercial banks and other financial intermediaries, or between the use of the liabilities. The assumption is that the relative size of the financial intermediary sector is positively correlated with the quantity and quality of the financial services provided, and we would therefore again expect a positive influence on the development of RETs.
All three financial variables are measured in current prices, and GDP is purchasing power parity (PPP) adjusted (see Beck et al., Reference Beck, Demirgüç-Kunt and Levine2000 for more details). Table 1 shows that there is considerable variation in the financial sector development in non-OECD countries, ranging from practically non-existent in some countries to levels comparable with many OECD countries.Footnote 11 As is to be expected, the means of all three indices were higher throughout the period for upper-middle-income and high-income non-OECD countries: the average values of dbacba, pcrdbgdp and llgdp were, respectively, 0.86, 0.39 and 0.53, as opposed to 0.67, 0.19 and 0.33 in low- and lower-middle-income countries. These numbers also seem to indicate that the three variables measure slightly different aspects of the financial sector: in fact, dbacba has a 0.5 correlation with pcrdbgdp and 0.39 with llgdp, while pcrdbgdp and llgdp are more highly correlated (0.8). We will use the three financial sector variables separately to minimise multicollinearity issues.
We expect RE sector development to depend on several factors other than financial intermediation. One obvious factor is the regulatory (or policy) framework for RE. We introduce two variables to capture different aspects of energy sector regulation. The first, psreform, describes the level of power sector reform, without special reference to RETs. It is based on a broad qualitative survey by the World Bank conducted in 1998 (ESMAP, 1999) and takes on values from 0 (least reformed) to 6 (reforms in all relevant areas have been implemented). The evaluation considers measures to create equal market opportunities for all energy resource types and encourage private firms' participation and competition (‘competition’ being a main reform criterion). Hence, psreform is a proxy for government energy policies – although unfortunately a time-invariant proxy, since it is based on a one-time study. The ESMAP study was conducted for a large number of developing and transition economies, but not for most high-income and OECD countries. We assigned a value of 6 to all high-income non-OECD economies – ten mainly small island states – and the OECD countries (used in comparison estimations). In robustness tests, we add a dummy variable for ‘artificially’ assigned top scores, or alternatively drop these countries altogether; both methods do not alter our main results, and even reinforce them (see below). The descriptive statistics show that power sector reforms have a relatively low mean of 2.58.
The second policy measure seeks to capture more specific RE policies by looking at the effects of the adoption of the Kyoto Protocol, which also includes efforts to diversify energy production to include more RETs. For this, we construct a simple zero-one dummy variable that takes on value one for all years from 1998 onwards. The adoption of the Kyoto Protocol arguably also marks a greater awareness of environmental issues, which is not limited to industrialised countries. The level of ‘environmentalism’ may also contribute to the diffusion of RETs.
As discussed in the previous section, the institutional framework is also a crucial element of financiers' information costs on RETs, signalling a government's commitment to levelling the playing field for energy providers or even positively encouraging RETs, thereby reducing uncertainty about future profitability of a RE project. Since there is no reliable data available on creditor evaluation costs in less developed economies, these crude policy proxies will have to suffice. We expect a positive impact of both power sector reforms and the Kyoto dummy on the RE sector.
In addition to the two energy policy variables, we also use measures of overall institutional quality in robustness tests. It is in fact likely that RE projects, like other types of investment projects, benefit from general political stability, sound regulatory frameworks, effective governance and secure property rights. Moreover, institutional quality in general could be correlated with financial sector development in particular, although correlation coefficients range between a modest 0.38 and 0.5 (with the exception of pcrdbgdp, which has correlation coefficients between 0.52 and 0.61 with the institutional quality measures). We consider three different institutional measures: the first is an economic freedom index compiled by Gwartney et al. (Reference Gwartney, Lawson, Hall and Norton2008) on a five yearly basis until 2000, and on a yearly basis since 2001 (values for the most recent year were used for intermediate years before 2000). The index ranges from 1 (worst) to 10 (best) and includes evaluations of the legal structure and security of property rights, government size, access to sound money, trade freedom and regulation of credit, labour and business. The other two measures capture regulatory quality and government effectiveness, respectively, and are taken from Kaufmann et al. (Reference Kaufmann, Kraay and Mastruzzi2008). These are available for a wider range of countries than the economic freedom index, but they have only been compiled since 1996. Although institutions change only slowly, we concentrate on the economic freedom index and only briefly discuss results using the other two measures, where the 1996 values were used for earlier years.
Several other control variables are included. Income per capita in US$ (gdppc) controls for the possibility that richer and economically more developed countries may simply have higher energy production. The ratio of net foreign direct investment inflows to GDP (fdigdp) accounts for non-domestic investment, including investment by foreign development banks. We would generally expect this measure to positively affect RE sector development.Footnote 12
The prices of the most common conventional fuels may affect investment in alternative energy sources. We therefore control for the possible exogenous effects on RE development of the costs of non-RE resources production by including the average annual market price of crude oil (oilprice), coal (coalprice) and natural gas (natgasprice), as well as the respective per capita production rates (oilprodpc, coalprodpc and natgaspdopc). Furthermore, an interaction term controls for the possibility that large fossil fuel producers react differently to price changes than small producers or countries without any fossil fuels at all. In fossil fuel poor countries, we would expect a clear positive effect of a fossil fuel price increase on the share of RE in power production. Conversely, the more fossil fuels a country produces, the less likely it will be to invest in alternative energy resources, particularly in times of high prices and returns.
We also control for regional effects, as well as two specific time effects in the estimation period, namely the fall of the Soviet bloc and the start of the economic (and political) transition of Central and Eastern European and Central Asian countries, and the financial crisis of East Asia, Latin America and Russia. We introduce a variable called transition for the former event, which has value zero until 1991 and then increases with every year after transition for transition countries, remaining zero for all others. This is meant to account for the time-diminishing overall negative economic effect of the transition shock. The variable fincrisis captures the second event (common to all countries), assuming value zero until 1997, and then increasing with every successive post-crisis year. Both time variables are expected to have a positive effect on RE sector development, as investment in developing and transition countries generally slumped after the shocks and then gradually picked up again.
Finally, we seek to control for RE potential by including two variables for the two most important and widely diffused RETs. hydropot measures the technically exploitable part of gross theoretical hydropower capability, in twh per year. Where not available, gross theoretical capability was used instead. The data was taken from the World Energy Council triannual Survey of Energy Resources (WEC, 1980–2007); intermediate years were filled in with the latest available value. windpot measures the potential for the currently most widely employed non-hydro RET, namely wind power. The measure is based on a recent study by Archer and Jacobson (Reference Archer and Jacobson2005), who present the first attempt at quantifying global wind power potential from real data. We construct a dummy variable where zero equals poor or very poor potential, and one equals moderate to high potential. According to the authors of the study, moderate (economic) potential starts at wind speeds at 80 m (the hub-height of modern, 77 m diameter, 1500 kw turbines) between 6.8 and 7.5 m/s. They find substantial potential in all regions, particularly in North America and (northern) Europe, as well as the southern tip of South America. Interestingly, the data of Archer and Jacobson (Reference Archer and Jacobson2005) show that no wind-speed reporting station in mainland China suggests moderate to high wind power potential. This runs counter to other studies focusing on China, and to the increasing number of wind farms in China itself. Although their study is the first to calculate wind power potential with a consistent methodology for the entire world, their data is available for one year only (generally 2000), which may be problematic if wind patterns change over time, for example due to effects of El Niño.
The EIA RE dataset contains several missing years due to newly independent countries and gives us an unbalanced panel covering 119 non-OECD countries for the period from 1980 to 2006.Footnote 13 Results including OECD countries are also shown for comparison.
In our main estimations, we perform GLS regressions for the equation

where Yit is the dependent variable (repc, hydropc or geopc) in country i at time t, Fit denotes the financial sector development variable and Xit the vector of control variables. The composite error term ωit consists of the country-specific error component εi and the combined cross-section and time series error component uit, according to ωit = εi + uit.Footnote 14
The main estimations were performed with one-year-lags for all relevant independent variables, since financial sector and other economic changes are not expected to have immediate effects on electricity generation. Alternative lag durations of up to five years confirm the results (available upon request), but reduce the number of observations. As there is no clear theoretical indication regarding the ideal lag number, we show results using one-year-lags.Footnote 15 Time-invariant measures – the Kyoto, transition and financial crisis variables – were not lagged.
In further sensitivity tests that account for the possible dynamic effects of RE sector development and test the causality, we perform a dynamic panel data analysis. Linear dynamic panel analysis following Arellano and Bond (Reference Arellano and Bond1991) is also designed for panels where the cross-section dimension exceeds the time dimension, as in our case where we have up to 119 non-OECD countries and a maximum of 26 years. Dynamic models include unobserved country-level effects, which by construction are correlated with the lagged dependent variable, making standard estimators inconsistent. The Arellano and Bond (Reference Arellano and Bond1991) first-differenced GMM estimator is consistent for the parameters of this model, though it still requires that there be no second-order serial autocorrelation in the idiosyncratic errors, which we systematically test for after two-step GMM estimations (not shown).
The basic estimation equation remains much the same as above (excluding time-invariant regressors), with the addition of the lagged dependent variable Y i(t − 1):

3. Estimation results
It is of particular interest to observe the sign and statistical validity of the financial sector coefficients α2 and β2. The aim is to observe whether the development of the RE sector is – other things equal – positively influenced by the financial intermediary sector in general (captured by the broad financial depth measure llgdp), and especially by the commercial banking system (proxied by the commercial bank asset share dbacba and the private credit allocation pcrdbgdp). Controlling for variables which affect RE or financial sector development allows us to draw conclusions on the causal impact of finance on RETs.
3.1. Generalised least squares estimations
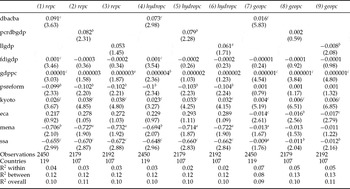
We begin by presenting random-effects GLS estimations according to equation (1) for our unbalanced panel of non-OECD countries.Footnote 16 Table 2 shows results for a parsimonious, basic specification including a financial sector variable, income per capita, FDI/GDP, the two energy sector policy measures psreform and kyoto and regional dummy variables. Columns (1)–(3) give results with the total RE produced per capita (repc), while columns (4)–(6) show results for hydroelectric power (hydropc), and columns (7)–(9) for non-hydro power generation (geopc).
Financial development and per capita RE generation in non-OECD countries

Notes: All regressions are random-effects GLS on sample panel of non-OECD countries from 1980 to 2006 with one-year-lags for all indicators except psreform, kyoto and the three regional dummies. Absolute z-statistics in parentheses. Constant term included in all specifications (not shown). a, b, c statistically significant at 10, 5 and 1 per cent levels, respectively.
First of all, it is striking that all three financial sector development measures have the expected positive sign in all but the very last specification, and are moreover mostly significant. As far as the magnitude of the effects is concerned, in terms of beta coefficients we see for example from column (1) that a one-standard-deviation increase in the commercial bank asset share would – other things equal – lead to a small increase of 0.03 standard deviations in the RE per capita produced ((0.23 × 0.091)/0.78). The effects on the overall RE generation per capita are slightly smaller in magnitude for the other two measures of financial sector development, weighing in at around 0.02. The effects are similarly minimal when we consider only hydro power, with beta coefficients again around 0.02. However, the effect of financial intermediation appears to be much more substantial when we consider only non-hydro RE: a one-standard-deviation increase in the commercial bank asset share leads to an increase in geopc by 0.184 of a standard deviation (using results from column (7)). The large negative effect of ‘financial depth’ in the last column is puzzling: it appears that financial sector development in general diminishes RET use, while commercial banking increases it. However, this effect is not robust to dropping outliers (see below).
Regarding the other covariates in table 2, we find on the one hand that power sector reforms have a counter-intuitive effect on RE generation: the coefficient has a negative sign in all but the estimations using non-hydro RE. Note however that in robustness tests including a dummy variable for countries that were ‘artificially’ assigned a top score of six for power sector reforms, or alternatively dropped from the estimations, the significance on the negative coefficients disappeared, while the positive coefficients became significant (results available upon request). On the other hand, the results show a consistently strong positive RE sector development trend since the adoption of the Kyoto Protocol, suggesting that the connected emission-reduction policies (or possibly the greater environmental awareness linked to the widespread discussion of the Protocol) have led to greater RET diffusion. In additional estimations (available upon request), the possibility of time-specific effects was further investigated by including year and five-year period dummies. Both variations showed that RE sector development has picked up markedly since the mid-1990s and the trend even accelerated after 2000, lending further support to the idea that the Kyoto Protocol has indeed had positive effects.
Per capita income has the expected positive sign and is often highly significant, confirming that richer countries also produce more energy. The FDI shares of GDP however have no consistent sign, being positive and highly significant in columns (1) and (4), and negative and insignificant otherwise. Finally, there appear to be significant differences in Middle Eastern and North African countries (mena), which include most OPEC countries, and sub-Saharan African countries (ssa): both regions have lower RE electricity generation on average than other non-OECD countries. Non-hydro RE use is significantly lower especially in sub-Saharan Africa and Europe and Central Asia (eca), in the latter case probably due to Soviet-era policies.
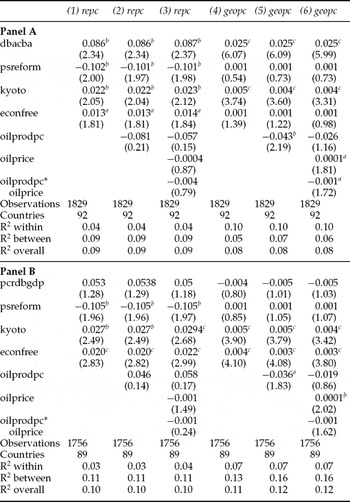
The first results are encouraging, but still leave room for some omitted variables bias: the explanatory power given by the R-squareds, though not unusually low for such a large and varied sample of countries, is modest. In table 3, we therefore consider additional variables. We control for overall institutional quality (econfree) and the effects of oil production and prices. For space reasons, we concentrate on the two narrower financial sector variables dbacba (panel A) and pcrdbgdp (panel B) and do not show results for hydropc (which are very similar to those for repc), as well as for the control variables income per capita, FDI/GDP and the regional dummies.
Robustness analysis with additional regressors

Notes: All regressions are random-effects GLS on sample panel of non-OECD countries, with one-year-lags for all indicators except (psreform), kyoto, and the regional dummies (not shown). Also not shown are the coefficients for gdppc and fdigdp, as well as the constant term. Absolute z-statistics in parentheses. a, b, c statistically significant at 10, 5 and 1 per cent levels, respectively.
Panel A shows that commercial banking (dbacba) continues to have a strong positive effect on RE use. The coefficients in columns (1)–(3) for all types of RETs remain in the same order of magnitude as in table 2; however, the coefficients in columns (4)–(6) increase remarkably, with beta coefficients for a one-standard-deviation change in commercial banking development of 0.29. This indicates that this particular area of the financial sector can have a real impact on the adoption of non-hydro RETs, even once we take into account the policy and institutional environment. The same can however not be said for credit to the private sector (pcrdbgdp) in panel B, which is not robust to controlling for institutional quality (econfree) and oil production and prices.Footnote 17
The measure of economic freedom (econfree) has the expected positive sign and is mostly significant, especially in panel B, indicating that a stable institutional framework positively affects investments in the RE power sector. Oil production and oil prices seem to have most impact on the use of non-hydro RETs (columns (4)–(6)): oil producers have less electricity generated with wind, solar, geothermal and other non-hydro RE. An oil price increase, on the other hand, makes investment in these RETs more worthwhile, indicated by the positive sign. However, the interaction term oilprodpc × oilprice shows that this ‘substitution effect’ away from conventional fossil fuels to RETs is less pronounced in oil-producing countries and may even be completely cancelled out. For example, at the sample mean oil production of 0.04 barrels per day and per capita, an oil price increase of one standard deviation (11.31 US$ per barrel) would – other things equal – lead to an increase in the non-hydro RE use in electricity generation of 0.034 standard deviations: a negligible effect.Footnote 18 However, the same price increase in the relatively largest oil producer (Qatar, with 2.11 barrels per day and per capita) would hypothetically lead to a massive decrease in the use of non-hydro RE of over one standard deviation.
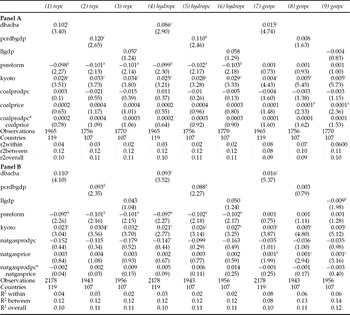
Table A of the appendix shows results using coal and natural gas. The pattern for natural gas (panel B) is similar to that for oil, while the effects of coal price increases are consistent across all countries, coal producers and otherwise (panel A). This suggests that (major) oil and natural gas producers generally have lower levels of RE use, probably reflecting different investment incentives.
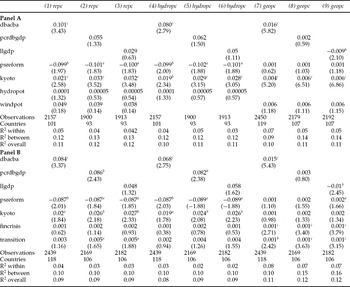
In additional estimations shown in table B in the appendix, we found that the economic transition of former East Bloc countries had a weakly significant impact on RE generation: power production with all types of RE has increased steadily since the transition shock. The financial markets shock of 1997–1998, however, had no strong impact on overall RE production in developing and transition countries; but non-hydro RET use has increased significantly since the financial crisis of the late 1990s. Note however that this positive impact may be combined with a post-Kyoto effect, since the time periods coincide: in fact, the simple Kyoto dummy variable – which is otherwise consistently highly significant – loses its strength here. Our measures of RE potential prove inconclusive: both have positive signs, but neither approaches conventional levels of significance.
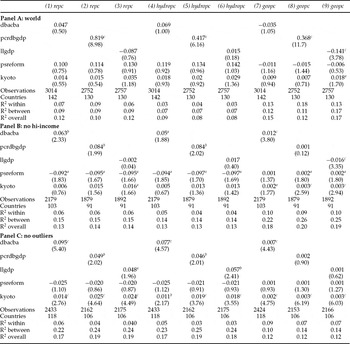
Finally, we compare different samples in table C, starting with the entire world in panel A. Credit to the private sector (pcrdbgdp) is the only significantly positive financial sector variable, while financial depth (llgdp) once again shows a significant negative impact on non-hydro RE use. Note that the effect of (pcrdbgdp) is much higher than we saw previously for non-OECD countries, and strongly significant for all types of RE, while at the same time financial depth (llgdp) shows an increased negative effect on geopc.
Interestingly, there appears to be no consistent post-Kyoto effect in the entire world sample: this may point to policies on RE which were already being enforced prior to the adoption of the Kyoto Protocol. For example, according to the World Energy Council's Survey of Energy Resources of 1998, many OECD countries were already close to realising their technically exploitable hydropower capacity at the time. They were probably farther away from their capacity frontiers as regards non-hydro RETs; the Kyoto dummy is marginally significant in column (9), indicating the possibility of positive effects of the commitments undertaken within the Kyoto Protocol. However, the effect is too weak to draw any more definite conclusions.
Panel B includes only low- to upper-middle-income non-OECD countries (no high-income): the main effects from tables 2–3 are confirmed, and the explanatory power increases substantially. Panel C shows results for non-OECD countries without outliers Paraguay (as regards overall RE and hydro electricity generation) and Costa Rica (for non-hydro production), which again confirm the main results. Overall, the positive impact of financial sector development on RE, and especially non-hydro electricity generation, seems remarkably robust. Note that the negative effect of llgdp on geopc appears to be driven by the outlier Costa Rica, as it disappears when we drop that country.
3.2. Dynamic panel data estimations
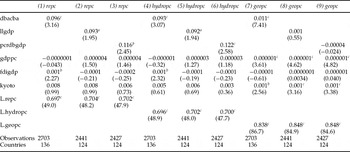
The results of the panel estimations shown above are very suggestive of a robust impact of financial sector development – especially commercial bank asset share and private credit share – on RE production in non-OECD countries. However, the explanatory power of the specifications is generally between 9 and 20 per cent of the overall sample variation, indicating some possible omitted variable bias; moreover, energy sector development may display a dynamic development over time. In order to address these points and also confirm the causal relationship, we perform dynamic one-step GMM estimations after Arellano and Bond (Reference Arellano and Bond1991).Footnote 19 Table 4 presents the results of the basic regressions using equation (2). The highly significant lagged dependent variables suggest that a dynamic approach is justified. Beyond this, we note that the results from the dynamic estimations confirm the positive and significant effect of financial sector development on RE production. A post-Kyoto (policy) effect is noticeable only for non-hydro RETs, shown in columns (7)–(9). The magnitudes of the single impacts remain similar to those seen above with GLS, though they are slightly higher for repc and hydropc, and slightly lower for geopc.
Dynamic panel estimations

Notes: All regressions are Arellano–Bond dynamic panel regressions using sample panel of non-OECD countries with one-year-lags for all indicators. Absolute z-statistics in parentheses. Constant term included in all specifications (not shown). a, b, c statistically significant at 10, 5 and 1 per cent levels, respectively.
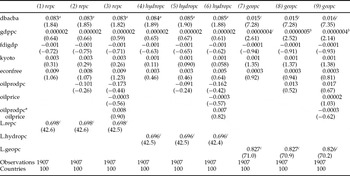
In table 5, we show results with additional variables econfree and oil production and prices, similar to table 3. For space reasons, we concentrate on commercial banking (dbacba), which again proves the most robust financial sector variable, particularly as regards geopc. Note that the coefficients for the commercial banking share now approach the magnitudes seen in table 2 above. However, the oil variables no longer appear to have any impact, and in some cases even change signs. There is also no longer any observable ‘Kyoto effect’ on RET use in electricity production. Overall, the results for the dynamic GMM estimations prove weaker than for GLS, although financial sector development – in particular the commercial banking share – still has significant positive impacts on RE use.
Dynamic panel estimations with additional regressors

Notes: All regressions are Arellano–Bond dynamic panel regressions using sample panel of non-OECD countries with one-year-lags for all indicators. Absolute z-statistics in parentheses. gdppc, fdigdp and constant term included in all specifications (not shown). a, b, c statistically significant at 10, 5 and 1 per cent levels, respectively.
In sum, the results of the empirical analysis support the idea that financial intermediary development encourages the growth of the RE sector. However, the effect is quite small in magnitude when we consider the beta coefficients: only for the case of non-hydro RE is the impact economically important throughout the specifications. Moreover, not all financial measures are equally important: commercial banking seems to deliver the best support for the realisation of RE projects. As regards policy, we find an ambiguous impact of the power sector reform index; it is difficult to explain this, as unfortunately it is a time-invariant index and does not specifically examine RE policies, but looks at how level the playing field is for all types of resources and producers. The more RE-relevant Kyoto dummy however shows that there has been a clear positive development in RET use in transition and developing countries since the adoption of the Kyoto Protocol in late 1997. This may be due to the growing number of CDM projects, or to a growing environmental awareness with domestic RE policies, or both. Finally, the findings are robust to the inclusion of other covariates which could influence RE sector development, and to various different sample sizes.
4. Discussion and conclusions
This paper examines the effects of financial intermediation on the development of the RE sector in a series of panel data estimations for the period 1980–2006. Energy production today relies on exhaustible and polluting conventional fossil fuels, and a larger share of alternative energy sources in primary energy production would not only have positive environmental effects, but would also bring greater energy security for future generations, as RETs exploit domestic RE resources. The increased use of RETs is one of the instruments to achieve the emission-reduction goals of the Kyoto Protocol, and it is also mentioned for example by the UN as a crucial part of achieving sustainable development.
The focus is on non-OECD developing and transition countries. Energy firms in less developed economies are largely dependent on external financing to realise new projects; in turn, external financing in these countries relies on the banking sector, as stock and bond markets, as well as venture capitalism, are not well enough established to provide large-scale funding. However, the underdevelopment of the banking sector, in addition to specific RE-sector problems such as high up-front and information costs and long lead times, hamper the emergence of RE entrepreneurs. The financing problems are combined with the greater issue of energy sector regulations and RET policies, which do not always offer a level playing field for all energy producers, as fossil fuel generation often benefits from special incentives, as well as the advantage of well-established technologies and hence fewer unknowns for potential investors.
The empirical estimations, using RE electricity generation per capita as a proxy for RE sector development, show that financial sector development does indeed have a robust and significant positive effect on the amount of RE produced, which is independent of (or in addition to) energy policy. We found that the effect is particularly large when we consider non-hydropower RE (i.e., geothermal, solar, wind, wood and waste), where a one-standard-deviation increase in our financial intermediation measures leads to an increase in non-hydro RE of up to 0.3 of a standard deviation. Of the three financial sector measures used, the commercial bank asset share and the private credit share proved the most robust, while financial depth is probably too broad a measure to adequately capture the more bank-focused development that is assumed to be important in developing and emerging economies. The results are robust to controlling for additional effects and to different sample specifications.
The findings also suggest that there has been a strong positive post-Kyoto effect in RET use in non-OECD countries, though we cannot pinpoint the exact cause to either the Kyoto Protocol mechanisms such as CDM and JI, or a growing environmental awareness with consequent domestic RE policies. The power sector reforms indicator had an ambiguous impact on RE sector development: the effect on overall RE use and hydropower tended to be negative, while the influence on non-hydro RETs was more positive. The lack of a clearer conclusion in this regard may be due to the data: the power sector reform index provided by ESMAP (1999) is available for only one year (1998), and concentrates on evaluating competitiveness and creating a level playing field for all types of energy resources, with no particular focus on RETs. Moreover, the mixed reform results to date in non-OECD countries have led to a general rethinking of the objectives and underlying assumptions of power sector reform (e.g., Williams and Ghanadan, Reference Williams and Ghanadan2006), which will hopefully lead to more adequate measures (and incentives) of reform progress.
As regards possible differences in fossil fuel producing countries, there is indeed some indication that (major) oil and natural gas producers generally see less electricity generation with RETs, particularly non-hydro RE, than other countries. Fossil fuel price increases likely weaken the incentives to invest in RETs in major producers, while their effect is opposite in smaller producers and fossil fuel-poor countries.
The approach offers a first attempt at empirically verifying the role of finance for the development of the RE industry. The availability of quality data on RE development and investment has so far hampered empirical studies in this area; further work is needed to corroborate the results, especially in the form of case studies. Additionally, it will be interesting to see the future impacts and developments of the Kyoto Protocol.
Any policy recommendations must remain tentative at this point. Nevertheless, it seems safe to say that the financial sector does indeed have a measurable impact on the emergence of RE producers. A regulatory framework aimed at fostering the RE sector cannot neglect the financing aspects, and particularly the availability of private sector financial intermediation. Developing and strengthening the financial sector of course has greater macroeconomic benefits, as demonstrated by the vast finance-and-growth literature; however, it also has a non-negligible influence on the success of RE, especially the most recent non-hydro RETs.
Appendix: Definitions and sources
All data were collected for non-OECD countries (as of 1980 – the recent OECD members Czech Republic, Hungary, Korea, Mexico, Poland and Slovakia were included in the estimations) and for OECD countries for comparison, for the years 1980–2006 (where available).

Robustness analysis with coal and natural gas production

Notes: All regressions are random-effects panel regressions; fdigdp, gdppc, regional dummy variables and constant term included but not shown. One-year-lags for all indicators with the exception of psreform and regional dummies. Absolute z-statistics in parentheses. a, b, c statistically significant at 10, 5 and 1 per cent levels, respectively.
RE potential and time shock variables

Notes: All regressions are random-effects panel regressions using sample panel of non-OECD countries with one-year-lags for all indicators, with the exception of psreform, kyoto, fincrisis and transition. Constant term, psreform, kyoto, gdppc, fdigdp and regional dummies not shown for space reasons. Absolute z-statistics in parentheses. Constant term included in all specifications (not shown). a, b, c statistically significant at 10, 5 and 1 per cent levels, respectively.
Outlier analysis and world comparison

Notes: All regressions are random-effects panel regressions; fdigdp, gdppc, regional dummy variables and constant term included but not shown. One-year-lags for all indicators with the exception of psreform and regional dummies. Panel A shows world sample; Panel B shows sample of non-OECD without high-income countries; Panel C shows sample of non-OECD countries without outliers Paraguay (columns 1–6) and Costa Rica (columns 7–9). Absolute z-statistics in parentheses. a, b, c statistically significant at 10, 5 and 1 per cent levels, respectively.