I. INTRODUCTION
Semiconductor nanowires (NWs) have emerged as one of the most powerful and versatile building blocks for integration of nanoscale devices with current technology. The geometry of NWs permits efficient strain relaxation, which in turn allows the combination of materials not normally compatible, as well as the growth of III–V NWs on Si.Reference Mårtensson, Svensson, Wacaser, Larsson, Seifert, Deppert, Gustafsson, Wallenberg and Samuelson1, Reference Bakkers, Borgström and Verheijen2 Numerous technically and scientifically interesting devices have been demonstrated using NWs, such as field effect transistors (FETs),Reference Cui and Lieber3 single-electron transistors,Reference Thelander, Mårtensson, Björk, Ohlsson, Larsson, Wallenberg and Samuelson4 and spin-orbit qubits.Reference Nadj-Perge, Frolov, Bakkers and Kouwenhoven5
Doping is necessary in most device applications to control the conductivity of the NWs. Doping of semiconductor NWs was first investigated almost two decades ago by the pioneering group of Hiruma, who demonstrated GaAs p–n junctions.Reference Haraguchi, Katsuyama, Hiruma and Ogawa6 Interest in NWs developed rapidly after Lieber’s group demonstrated controlled doping in Si NWs,Reference Cui, Duan, Hu and Lieber7 and successful doping has since then enabled fabrication of photovoltaic devices,Reference Kempa, Tian, Kim, Hu, Zheng and Lieber8 single-quantum-dot light-emitting diodes,Reference Minot, Kelkensberg, van Kouwen, van Dam, Kouwenhoven, Zwiller, Borgström, Wunnicke, Verheijen and Bakkers9 and tunneling FETs.Reference Björk, Knoch, Schmid, Riel and Riess10 The rapid development of the field of NW doping is demonstrated by the fact that about half of the references in this review were published during the past 3 years.
Despite these advances, many challenges remain in both understanding and controlling the doping of NWs. The size of NWs prevents the use of standard Hall measurements to determine doping levels, and the evaluation of carrier concentrations and mobilities remains difficult. The dynamics of NW growth is complex, even without considering doping, and, as discussed in a special section, the effects of doping are often much stronger than in thin-film growth. Furthermore, NWs are often grown at significantly lower temperatures than thin films, for which an understanding of doping has been developed.Reference Stringfellow11 While the non-nitride III–V semiconductors grow in the cubic zincblende (ZB) form in bulk, III–V NWs commonly exhibit a mixture of ZB and the lower symmetry, hexagonal wurtzite (WZ) crystal structure. This polytypism has been the focus of much research during recent years,Reference Caroff, Bolinsson and Johansson12 and the crystal structure can to some extent be controlled by growth conditions such as temperature and V/III ratio. Interestingly, it has also been found that doping can strongly affect the crystal structure of III–V NWs.Reference Xu, Su, Chen, Xiao, Zhu, Zhou and Li13, Reference Algra, Verheijen, Borgström, Feiner, Immink, van Enckevort, Vlieg and Bakkers14
There are many requirements for doping of semiconductor NWs. Obviously, it must be possible to achieve suitable high carrier concentrations, and, as will be discussed later, there are good reasons to believe that higher dopant concentrations than in bulk will be needed in NWs. For commercial applications, the doping method should allow large-scale production at a reasonable cost. The spatial distribution of the dopants must also be sufficiently controlled for the application. For instance, the position of a single dopant atom may strongly affect the performance of FETs at gate lengths below 10 nm.Reference Seoane, Martinez, Brown, Barker and Asenov15
Since NWs are typically grown vertically on the substrate, it is natural to define devices and therefore doping profiles vertically, in contrast to traditional planar devices. A vertical geometry poses special challenges for diffusion and ion implantation, the two currently dominating doping methods for planar devices. Since the NWs discussed in this review are based on epitaxial growth, it is attractive to introduce dopants during growth, and we will therefore mainly discuss in situ doping in this review.
Below, we discuss the mechanisms, growth effects, and measurements of doping of epitaxially grown semiconductor NWs, rather than the applications. We focus on the doping of NWs grown using the popular vapor–liquid–solid (VLS) method, but other methods of growth are discussed as well. Most of the pioneering work in NW growth using the VLS method has been done with gold as the seed material, and this is also reflected in this review. We have mainly reviewed intentional doping with the purpose of modifying the carrier concentration although we also include some other types of doping.
We first present a table of references regarding in situ doping of NWs. This is followed by a qualitative model for dopant incorporation during in situ doping and the discussion of some of the key results in this field. The effects of doping on NW growth have received increasing attention during recent years and thus warrant a special section. Thereafter, other methods used for NW doping are discussed. Finally, we present an overview of methods that have been used for characterization of doping in NWs.
II. IN SITU DOPING REFERENCE LIST
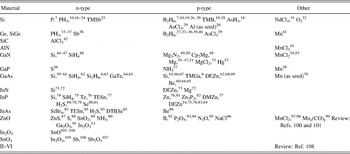
In Table I, we present a comprehensive but not exhaustive list of references to articles concerning in situ doping of semiconductor NWs, sorted according to the NW material.
Table of references regarding in situ doping of semiconductor NWs.

III. INCORPORATION DURING IN SITU DOPING
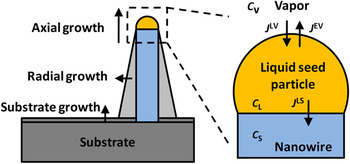
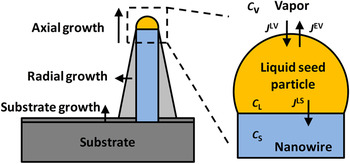
In this section, we present a qualitative model for doping during VLS growth of NWs and discuss key results in this area. There are numerous publications concerning undoped NW growth, and two recent reviews can be found in Refs. Reference Wacaser, Dick, Johansson, Borgström, Deppert and Samuelson109 and Reference Dick110. We assume here that the NWs are grown from a liquid metal seed particle and that the growth material and the dopant precursors are supplied from the vapor phase. Apart from axial growth, which creates the NWs, there is normally also radial growth, often leading to a tapered shape, as well as competitive substrate growth (indicated in Fig. 1).
Schematic of the concentrations and fluxes of dopant in vapor–liquid–solid nanowire (NW) growth.
Dopants may enter the NW in the axial growth via the seed particle or via the particle–NW interface. Several authors have found dopant incorporation to be more efficient in the radial growth than in the axial growth.Reference Dufouleur, Colombo, Garma, Ketterer, Uccelli, Nicotra and Morral66, Reference Allen, Perea, Hemesath and Lauhon111 The dopants may be incorporated in the radial growth via adsorption and capture. Some dopants have high solid diffusivity and may possibly diffuse into the NW from the side facets. Conversely, it is also possible that dopants may leave the crystal via diffusion from the side facets if the dopant source is turned off.
Nonintentional radial overgrowth is usually undesirable as it can disturb the performance of axially defined devices. Tapering can be reduced by adjusting the growth conditions,Reference Verheijen, Immink, de Smet, Borgström and Bakkers112 and it has been shown that in situ etching can completely prevent tapering in NW growth.Reference Borgström, Wallentin, Trägårdh, Ramvall, Ek, Wallenberg, Samuelson and Deppert113 The radial incorporation of dopants is probably well described by established thin-film growth models although the unusual side facets and growth temperatures must be taken into consideration. We therefore mainly discuss the incorporation of dopants in the axial growth.
Our model is influenced by the boundary-layer model developed by Stringfellow for doping in thin-film metal organic vapor phase epitaxy (MOVPE).Reference Stringfellow11 Consider a NW growing at steady state. The concentrations of dopant are c V, c L, and c S, in the vapor, liquid, and solid, respectively (see Fig. 1). The fluxes of dopant are J LV, from the vapor into the liquid, J LS, from the seed particle into the crystal, and J EV, reevaporation from the liquid into the vapor. The flux of seed metal into the crystal is assumed to be negligible.
We assume that doping at the interface locally occurs as in a liquid-phase epitaxy (LPE) system, as recently suggested by Dufouleur et al.Reference Dufouleur, Colombo, Garma, Ketterer, Uccelli, Nicotra and Morral66 The segregation coefficients here may differ from those established in regular LPE, due to the presence of the seed metal. We note that the segregation coefficients established in regular LPE show considerable variation between different dopants for the same host material and between different host materials for the same dopant. For instance, LPE of InP shows dopant segregation coefficients that vary from 30 for Si to 2 × 10⁻³ for Sn.Reference Kuphal114
Two extreme types of dopants can be identified:
Type A: For a dopant with low solubility in the seed particle but high segregation coefficient into the solid, the dopants will be depleted out of the seed particle and the concentration c L will be low. The reevaporation, J EV, will therefore also be negligible, which means that J LV = J LS.
Type B: Conversely, if the dopant has high solubility in the seed particle but a low segregation coefficient for solid incorporation, the reevaporation J EV will be significant and much larger than J LS. The steady-state concentration c L will be determined by the thermodynamic phase diagram of the liquid–vapor system. The solid concentration is given by the segregation coefficient k, defined by c S = k c L.
A typical type A dopant seems to be P in the doping of Ge and Si NWs using Au seed particles. Schmid et al.Reference Schmid, Björk, Knoch, Karg, Riel and Riess20 investigated P doping of Si NWs and found that the concentration could be increased continuously with the molar fraction of phosphine (PH3) until the solid solubility limit of P in Si was reached. An example of a type B dopant is Sb doping in the Au-seeded growth of Ge, where the liquid particle has recently been observed in situ using transmission electron microscopy to contain several tens of percent of Sb.Reference Sutter and Sutter38 Another example is Si doping of Ga-seeded GaAs NWs,Reference Dufouleur, Colombo, Garma, Ketterer, Uccelli, Nicotra and Morral66 which is interesting since it is probably one of the few systems for which relevant data on the distribution coefficient can be found.
The model described here can be compared with Stringfellow’s, where he considered a boundary-layer model and distinguished between case I and case II dopants depending on their vapor pressure.Reference Stringfellow11 The case I dopant, with low vapor pressure, would correspond to the type A dopant defined here, while the case II, with high vapor pressure, would correspond to the type B dopant. Case I is also the kinetically limited case, where mass transport of the dopant governs the solid concentration. Perea et al.Reference Perea, Hemesath, Schwalbach, Lensch-Falk, Voorhees and Lauhon21 investigated P doping of Au-seeded Ge NWs. Using mass transport arguments, they concluded that in this case the concentration of dopant in the solid was given by the ratio of fluxes into the seed particle. However, the solid concentration is not necessarily equal to the ratio of the fluxes or molar fractions in the vapor phase since the diffusion lengths, decomposition rates, and sticking coefficients may be different for the dopant and the growth precursor. Case II is the thermodynamically limited case, where reevaporation dominates and mass transport arguments are inadequate.
Note that in VLS growth it is not the vapor pressure in the vapor–solid system that determines which category a dopant belongs to, but a combination of the liquid–vapor thermodynamics and the liquid–solid segregation coefficients, as described earlier. For example, consider sulfur doping of InP. S has a high vapor pressure and is therefore considered a case II dopant in thin-film growth. In NW growth, S has low solubility in liquid metals but can be efficiently incorporated into InPReference Logan, Tanbunek and Sergent115 and is therefore probably a type A dopant. Some other typical n-dopants such as P and As (for group IV NWs) can also be expected to show type A behavior since they have low solubility in liquid metals. Most other dopants have high solubility in metals, but their segregation coefficients vary considerably and are generally unknown for relevant conditions.
The solubility of the dopants in the seed particle can be expected to have a strong influence on the gradient when the dopant source is turned on or off, and the steady state assumption is no longer valid. This gradient can be of critical importance for devices such as FETs. For type A dopants, it should in principle be possible to achieve gradients as sharp as those achieved in thin-film growth. Diffusion through a liquid seed particle is expected to be fast and should not limit the dopant incorporation. In support of this assumption, Schmid et al.Reference Schmid, Björk, Knoch, Karg, Riel and Riess20 found a diameter-independent P incorporation in Si NWs and demonstrated 30-nm-short doped segments. For type B dopants, the dopants will be stored in the seed particle and the expected gradient should be less abrupt.
Although these nonsteady-state effects are difficult to investigate thoroughly for doping because of the difficulty in performing accurate measurements, comparisons can be made with NW heterostructures that have been studied in great detail. A theoretical comparison was made by Li et al.Reference Li, Tan and Gösele116 Group V elements in III–V NWs have similarly low solubility as type A dopants, and very abrupt InAs–InP heterostructures have been observed using chemical beam epitaxy (CBE).Reference Björk, Ohlsson, Sass, Persson, Thelander, Magnusson, Deppert, Wallenberg and Samuelson117 In MOVPE, the gradient becomes limited by reactor memory effects,Reference Borgström, Verheijen, Immink, de Smet and Bakkers118 similar to the case in thin films. By contrast, Si and Ge as well as group III elements have high solubility, like the type B dopants, and when switching these elements, the heterostructure gradients are on the order of the NW diameter.Reference Wallentin, Persson, Wagner, Samuelson, Deppert and Borgström69, Reference Li, Tan and Gösele116 For the growth components, the consumption of material out of the seed particle is naturally on the same order as the growth rate, but for dopants, the segregation coefficient should also be considered. With low segregation coefficients, the consumption of dopant will be low and the memory effects in principle long. However, the dopants often have a much higher vapor pressure than the group III or IV growth precursors, and reevaporation could reduce the memory effects significantly. The sharpness of doping profiles can be examined by creating Esaki tunnel diodes, which require p-n junctions with a depletion width on the order of 10 nm for successful operation. Our group was able to demonstrate efficient tunnel diodes, despite NW diameters and InP?GaAs heterojunction gradients of almost 100 nm.Reference Wallentin, Persson, Wagner, Samuelson, Deppert and Borgström69 Techniques that have been used for heterointerfaces and which could be explored for sharp doping gradients are growth interrupts,Reference Borgström, Verheijen, Immink, de Smet and Bakkers118, Reference Fröberg, Wacaser, Wagner, Jeppesen, Ohlsson, Deppert and Samuelson119 where one element is purged from the seed particle before turning on the new one, and growth from solid seed particles,Reference Wen, Reuter, Bruley, Tersoff, Kodambaka, Stach and Ross120 which exploits the much lower solubility in the solid state.
For compound semiconductors, the relative fluxes or partial pressures of the anions and cations must be considered. It is well known in thin-film growth that, for example, a relatively low AsH3 flow enhances S incorporation in GaAsReference Stringfellow11 since S is incorporated on group V lattice sites. Although the V/III ratio in the vapor may be quite high, the ratio in the seed particle is normally much lower since the group V elements have lower solubility. Indeed recent experiments suggest that the group V element supersaturation could be growth limiting.Reference Glas, Harmand and Patriarche121 The low local V/III ratio suggests that p-type doping of III–V NWs would be more difficult than in thin films, but, as discussed earlier, the solubility of p-type dopants in the seed particle is typically much higher than that of n-type dopants. These effects are critical when using amphoteric dopants, which can induce n- or p-type doping depending on which lattice site they occupy. Colombo et al.Reference Colombo, Heibeta, Gratzel and Fontcuberta i Morral61 showed that the type of doping achieved by Si doping of GaAs NWs depends on the growth conditions, and they used this to create a p–i–n structure using only Si as dopant.
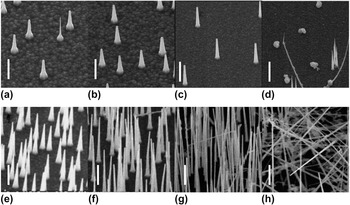
In MOVPE, the dopants are introduced via molecular precursors rather than as elements. Depending on the growth temperature and the precursor, the decomposition of the dopant precursor must be considered. For instance, silane pyrolysis is not complete even at bulk growth temperatures of GaAs; therefore, Si doping increases with temperature.Reference Stringfellow11 Since the growth temperature for NWs is often 100–300 °C below that of the corresponding thin films, pyrolysis may be important for precursors that are completely cracked in thin-film growth. Our group has investigated both DMZnReference Borgström, Norberg, Wickert, Nilsson, Trägårdh, Dick, Statkute, Ramvall, Deppert and Samuelson77 and DEZnReference Wallentin, Ek, Wallenberg, Samuelson, Deppert and Borgström83, Reference Borgström, Wallentin, Heurlin, Fält, Wickert, Leene, Magnusson, Deppert and Samuelson84 as p-type dopants of InP, shown in Fig. 2. Using DEZn, we found a growth rate that was independent of the DEZn molar fraction, while DMZn strongly increased the growth rate (as discussed in more detail in the next section). We attributed this difference to the higher decomposition temperature of DMZn as the undecomposed DMZn precursor could act as a surface passivator suppressing competitive thin-film growth. If the dopant precursors are not fully decomposed, catalytic decomposition on the seed particle surface as well as heterogeneous reactions should also be considered.
Growth effects of InP NWs doped with varying molar fractions (χ) of (a)–(d) DEZn and (e)–(h) DMZn: (a) χ DEZn = 0 (ref), (b) χ DEZn = 0.7 × 10⁻⁶, (c) χ DEZn = 10.7 × 10⁻⁶, (d) χ DEZn = 21.4 × 10⁻⁶, (e) χ DMZn = 1 × 10⁻⁶, (f) χ DMZn = 9.8 × 10⁻⁶, (g) χ DMZn = 48.7 × 10⁻⁶, and (h) χ DMZn = 97.5 × 10⁻⁶. Tilt 30° to the normal. Scale bars 1μm.

NWs have a large surface-to-volume ratio, which may influence dopant incorporation. Theoretical investigations have predicted that it will be energetically favorable for dopants to segregate to the surfaceReference Peelaers, Partoens and Peeters122, Reference Fernandez-Serra, Adessi and Blase123 although these calculations were performed for few-nanometer-diameter NWs with much higher surface-to-volume ratio than typical NWs. Xie et al.Reference Xie, Hu, Fang, Huang and Lieber124 investigated doped Si and Ge NWs experimentally and found a “transition diameter” of around 22 nm. Below this diameter, the doping in the bulk of the NW was low and most of the dopants were found in a surface layer, while for NWs with larger diameter, there was significant bulk doping together with a highly doped shell. The authors explained this in terms of a fixed number of surface states to which the dopants could segregate. Above the transition diameter, the surface-to-volume ratio would be sufficiently small for all these states to be occupied, thus allowing for effective bulk doping. In this context, it is important to bear in mind that it is also possible that dopants could leave the crystal via diffusion and desorption from the side facets. If such a process would be efficient, a lower-doped surface would be expected instead; however, to the best of our knowledge, this has not been observed experimentally.
Although thermodynamic arguments are important, NWs are by shape and definition not in the lowest energy state. It is, for instance, well established that the crystal structure of NWs is governed by kinetics rather than thermodynamics.Reference Johansson, Karlsson, Svensson, Mårtensson, Wacaser, Deppert, Samuelson and Seifert125 NW growth rates are usually significantly higher than those of regular thin films, which can have implications for dopant incorporation. For instance, Zn doping of thin-film InP is more effective at higher growth rates.Reference Chichibu, Kushibe, Eguchi, Funemizu and Ohba126
So far, the incorporation of dopants rather than carrier generation has been considered. In thin films, most dopants can safely be assumed to be ionized at room temperature. Theoretical predictionsReference Diarra, Niquet, Delerue and Allan127 and experimentsReference Björk, Schmid, Knoch, Riel and Riess128 have shown that the ionization energy of dopants increases in thin NWs because of electrostatic effects. As discussed earlier, there can be a tendency for dopants to segregate at the surface, and this raises the question of whether these dopants will generate carriers or be neutralized. Theoretical work has suggested that the dopants will be passivated,Reference Hong, Kim, Lee, Shin and Chung129 but there is experimental evidence of electrically active dopants at the surface.Reference Xie, Hu, Fang, Huang and Lieber124 These could provide high carrier concentrations while the mobility-limiting ions would reside away from the channel where carrier transport takes place, similar to the remote doping used for high-mobility 2DEGs.
Despite all the complex mechanisms discussed earlier, the overall tendency seems to be that NWs can be doped to similar levels as the corresponding thin films. Although accurate determination of doping levels is challenging, indirect evidence of high doping can be found in the performance of devices such as tunnel diodesReference Wallentin, Persson, Wagner, Samuelson, Deppert and Borgström69 and tunnel-FETs,Reference Björk, Knoch, Schmid, Riel and Riess10 as well as the nanosized ohmic contacts formed to many NWs.
IV. EFFECTS OF IN SITU DOPING ON NANOWIRE GROWTH
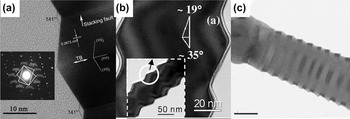
While in situ doping can affect thin-film growth by, for instance, step bunching, it can have quite dramatic effects on the growth of NWs. In this section, we will first discuss structural and morphological effects. GivargizovReference Givargizov29 reported periodic instabilities and faceting during growth of undoped Si and Ge NWs as early as 1973. He found that small additions of AsCl3 prevented these instabilities and also observed that this dopant precursor improved the wetting of the seed particle. Much later, periodic faceting and periodic twinning were observed in In-doped ZnO NWsReference Xu, Su, Chen, Xiao, Zhu, Zhou and Li13 [see Fig. 3(a)]. Similarly, Li et al.Reference Li, Nellist and Cockayne19 reported that diborane induced saw-tooth faceting on the sidewalls of Si NWs [see Fig. 3(b)], unlike undoped and PH3-doped segments which were smooth. When growing undoped segments followed by diborane-doped segments, they observed that faceting also developed on the undoped segments. This demonstrated that in this case the faceting developed during the radial overgrowth. Algra et al.Reference Algra, Verheijen, Borgström, Feiner, Immink, van Enckevort, Vlieg and Bakkers14 reported that undoped InP NWs grew with a mixed crystal structure, but that the addition of DEZn induced growth in a pure ZB crystal structure with rotational twins [see Fig. 3(c)]. Higher DEZn flows created a so-called twinning superlattice in which the distance between the twins was highly regular. These results were explained by changes in the surface energies of the seed particle, but no changes in contact angle between the seed particle and NW were found. Our group has recently investigated the same precursor, and we also observed a gradual transition to ZB structure with twinning.Reference Wallentin, Ek, Wallenberg, Samuelson, Deppert and Borgström83 In contrast to the results of Algra et al., we reported strong effects on the wetting of the seed particle. In line with the observations by Givargizov, we found that the periodic twinning correlated with a poor wetting of the seed particle although DEZn had the opposite effect of AsCl3. We have previously shown a transition to ZB structure with twinning in InP NWs grown with DMZn,Reference Borgström, Norberg, Wickert, Nilsson, Trägårdh, Dick, Statkute, Ramvall, Deppert and Samuelson77 which indicates that Zn, rather than the precursors, is responsible for the change in crystal structure. Effects on crystal structure from in situ doping have also been observed in GaN.Reference Arbiol, Estrade, Prades, Cirera, Furtmayr, Stark, Laufer, Stutzmann, Eickhoff, Gass, Bleloch, Peiro and Morante130
Crystal structure effects in doped nanowires: (a) ZnO NWs doped with In2O3. (Adapted from Ref. Reference Xu, Su, Chen, Xiao, Zhu, Zhou and Li13, with permission from the American Chemical Society.) (b) Si NW doped using diborane. (Adapted from Ref. Reference Li, Nellist and Cockayne19, with permission from the American Institute of Physics.) (c) InP NW doped with DEZn, scale bar 50 nm. (Adapted from Ref. Reference Xu, Su, Chen, Xiao, Zhu, Zhou and Li14, with permission from Nature Publishing Group.)

The addition of dopants often affects the growth rate of NWs, both axially and radially. Lauhon et al. found that doping Si NWs with diborane created an amorphous Si shell,Reference Lauhon, Gudiksen, Wang and Lieber27 but the shell could be made crystalline by high-temperature annealing. The reason for the radial overgrowth is that diborane improves the decomposition of silane, thereby enhancing film growth. Similarly, Tutuc et al.Reference Tutuc, Guha and Chu40 reported that diborane strongly increased the radial growth of Ge NWs. Lew et al.Reference Lew, Pan, Bogart, Dilts, Dickey, Redwing, Wang, Cabassi, Mayer and Novak28 compared diborane with trimethylboron and observed no amorphous shell in the latter case. This effect was attributed to the higher stability of trimethylboron.
In contrast to the complex behavior of diborane, the n-dopant PH3 has not shown strong effects on Si NW growth.Reference Zheng, Lu, Jin and Lieber16, Reference Wang, Lew, Ho, Pan, Novak, Dickey, Redwing and Mayer22 Schmid et al.Reference Schmid, Björk, Knoch, Karg, Riel and Riess20 found that PH3 had a minimal effect on the growth rate, but at sufficiently high concentrations, NW growth was completely inhibited. It has previously been observed that the addition of AsH3Reference Schmid, Björk, Knoch, Riel, Riess, Rice and Topuria18 or TMSbReference Nimmatoori, Zhang, Dickey and Redwing25 can suppress Si NW growth. Schmid et al. were also able to create n-type segments as short as 30 nm, demonstrating the limited memory effects and radial growth of this precursor. By contrast, Tutuc et al.Reference Tutuc, Chu, Ott and Guha37 reported that phosphorus incorporates mainly in a radial shell for Ge NW growth.
We have studied the growth rates of InP NWs grown with DMZnReference Borgström, Norberg, Wickert, Nilsson, Trägårdh, Dick, Statkute, Ramvall, Deppert and Samuelson77 and DEZn.Reference Wallentin, Ek, Wallenberg, Samuelson, Deppert and Borgström83 As shown in Fig. 2, DMZn significantly increased the growth rate, while DEZn had little effect on the growth rate. The difference was attributed to the higher pyrolysis temperature of DMZn, which could allow the precursor to act as a surface passivator for radial growth. At very high molar fractions, we found that DEZn completely prevented InP NW growth. By contrast, it has been shown that the n-dopant H2S induces perfect WZ crystal structure in InP NWs,Reference Wallentin, Mergenthaler, Ek, Wallenberg, Samuelson, Deppert, Pistol and Borgström79 in agreement with previous indications.Reference van Weert, Helman, van den Einden, Algra, Verheijen, Borgström, Immink, Kelly, Kouwenhoven and Bakkers78, Reference Borgström, Wallentin, Heurlin, Fält, Wickert, Leene, Magnusson, Deppert and Samuelson84 H2S also increases the axial growth rate and reduces the radial growth rate,Reference Wallentin, Mergenthaler, Ek, Wallenberg, Samuelson, Deppert, Pistol and Borgström79, Reference Borgström, Wallentin, Heurlin, Fält, Wickert, Leene, Magnusson, Deppert and Samuelson84 which is not surprising given that sulfur is a known surface passivator for InP. Rigutti et al.Reference Rigutti, Bugallo, Tchernycheva, Jacopin, Julien, Cirlin, Patriarche, Lucot, Travers and Harmand74 found that Si doping of InP NWs increased the tapering and reduced the growth rate.
Thelander et al.Reference Thelander, Dick, Borgström, Fröberg, Caroff, Nilsson and Samuelson85 investigated the effect of several doping precursors on InAs NW growth using both MOVPE and CBE. They observed an increased ZB content because of Se doping of InAs, using DTBSe both in CBE and MOVPE. At high DTBSe flows in MOVPE, the NWs were pure ZB without twins and had a triangular cross section. These NWs exhibited strong radial growth with a 3% Se concentration. Using SiBr4 in CBE, they found that this dopant induced growth of a doped shell, similar to the observations by Rigutti et al.Reference Rigutti, Bugallo, Tchernycheva, Jacopin, Julien, Cirlin, Patriarche, Lucot, Travers and Harmand74 Finally, doping of GaN NWs has been found to have strong effects on growth and faceting.Reference Limbach, Schafer-Nolte, Caterino, Gotschke, Stoica, Sutter and Calarco51, Reference Radovanovic, Stamplecoskie and Pautler55, Reference Liu, Bando, Tang, Xu and Golberg131
To summarize this section, in situ doping of NWs has in many cases been shown to have greater and more complex effects on NW growth than in the corresponding thin films. The effects of doping on, for example, growth rate and crystal structure are often stronger than the effects of changes in growth parameters such as V/III ratio. While some of these effects can be problematic, others such as higher crystal purity or decreased radial growth can be advantageous for applications.
V. OTHER DOPING METHODS
The two traditional methods of doping semiconductors, diffusion and ion implantation, have also been explored for NW doping, but to a lesser extent than in situ doping. For laterally defined devices, it can be cumbersome to position dopants in situ with epitaxy, but for vertical NW-based devices it instead the traditional methods that have geometrical challenges. Being nonequilibrium methods, they can in principle offer very high doping levels. Ford et al. were successful in carrying out challenging p-type doping in InAs NWs, using diffusion doping with Zn,Reference Ford, Chuang, Ho, Chueh, Fan and Javey132 while others have investigated Si NWs.Reference Moselund, Ghoneim, Schmid, Björk, Lortscher, Karg, Signorello, Webb, Tschudy, Beyeler and Riel133 Ho et al.Reference Ho, Yerushalmi, Jacobson, Fan, Alley and Javey134 took advantage of the geometry and crystallinity of NWs by depositing a monolayer of dopant-containing molecules and demonstrated controlled p- and n-type doping of Si NWs after high-temperature annealing. Dharra et al. used Ga ions to n-type doped GaN NWs,Reference Dhara, Datta, Wu, Lan, Chen, Wang, Chen, Hsu, Chen, Lin and Chen135 and others have explored ion implantation for SiReference Hayden, Björk, Schmid, Riel, Drechsler, Karg, Lortscher and Riess136, Reference Cohen, Rooks, Chu, Laux, Solomon, Ott, Miller and Haensch137 and GaAsReference Stichtenoth, Wegener, Gutsche, Regolin, Tegude, Prost, Seibt and Ronning138 NWs. Colli et al.Reference Colli, Fasoli, Ronning, Pisana, Piscanec and Ferrari139 investigated ion implantation of Si NWs in more detail and found that implantation induced limited amounts of structural disorder, which could be removed by annealing at 800 °C. Others have reported implantation of Si NWs standing as-grown.Reference Das Kanungo, Kögler, Nguyen-Duc, Zakharov, Werner and Gösele140, Reference Hoffmann, Bauer, Ronning, Stelzner, Michler, Ballif, Sivakov and Christiansen141
Several other methods of doping NWs have been explored. The reason for doping in most applications is to increase the carrier density, while the ionized dopants are unimportant or even detrimental to performance. Li et al.Reference Li, Wunnicke, Borgström, Immink, van Weert, Verheijen and Bakkers142 used a doped InP shell to remotely p-dope an InAs core. Strain-induced polarization fields have been explored as a doping source in thin films,Reference Simon, Protasenko, Lian, Xing and Jena143 and similar effects have been predicted in strained core-shell NWs.Reference Boxberg, Søndergaard and Xu144 Finally, stoichiometric control of N vacancies has been used to tune the carrier concentration in GaN NWs.Reference Kim, Kim, Lee, Kim, Kim, Lyu and Lee145, Reference Stern, Cheng, Cimpoiasu, Klie, Guthrie, Klemic, Kretzschmar, Steinlauf, Turner-Evans, Broomfield, Hyland, Koudelka, Boone, Young, Sanders, Munden, Lee, Routenberg and Reed146
VI. METHODS OF EVALUATING DOPING IN NANOWIRES
Our understanding of NW doping is closely related to our ability to evaluate the doping. Traditional Hall measurements have not been used because of the small size of NWs. Quantitative doping measurements are still a major challenge in NW research although there has been a considerable development in recent years. Electrical measurements have historically been the most important, but recently many groups have demonstrated quantitative measurements using other techniques.
A. Electrical methods
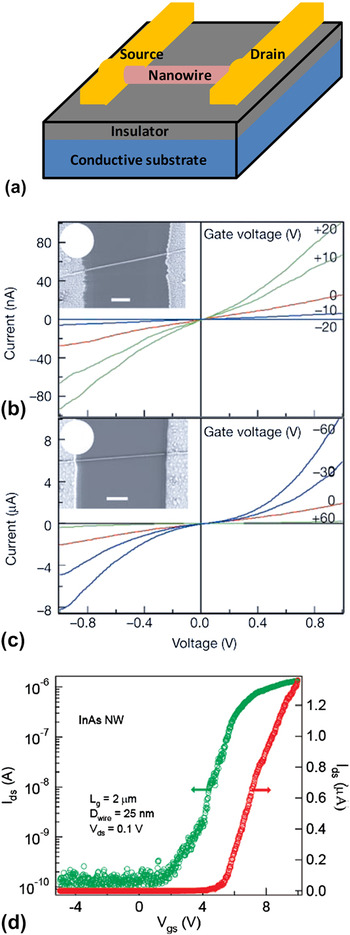
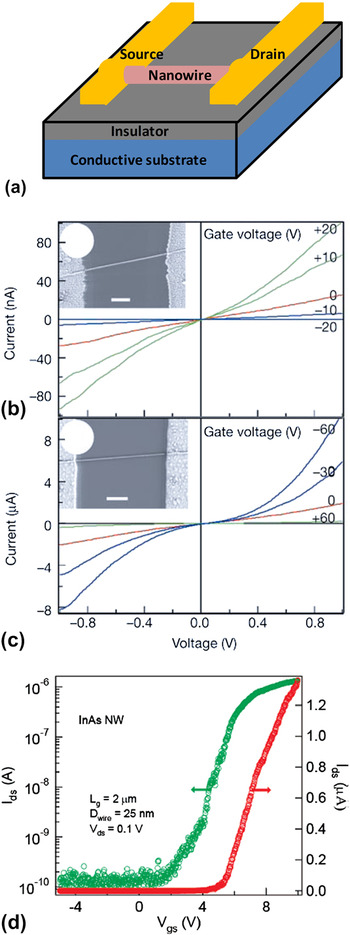
The most commonly used method for quantitative characterization of doping is to create so-called nanowire field-effect transistor (NW-FET)Reference Cui, Duan, Hu and Lieber7 devices, shown in Fig. 4. These consist of a NW which has been broken off the growth substrate, placed on an insulating substrate, and contacted on both ends. The conductivity of the NW can be measured by sweeping the source–drain voltage and measuring the current. The conductivity, σ, is related to the carrier concentration n asReference Sze147

Nanowire field-effect transistor (NW-FET) measurements. (a) Schematic of a NW-FET. (b) and (c) source–drain measurements of InP NWs doped with Te (b) and Zn (c). (Adapted from Ref. Reference Xu, Su, Chen, Xiao, Zhu, Zhou and Li76, with permission from Nature Publishing Group.) (d) Back gate-dependence of the source–drain current for an InAs NW-FET. (Adapted from Ref. Reference Xu, Su, Chen, Xiao, Zhu, Zhou and Li187, with permission from the American Chemical Society.)
where q is the elementary charge and μ is the carrier mobility. By changing the potential of the back gate in the substrate, the transconductance can be measured, which can be used to estimate the mobility. In the linear transistor regime, the transconductance g m is related to the mobility μ 147:

Here, I SD is the source–drain current of the NW-FET, V SD and V G are the source–drain and gate voltages, respectively, and L is the length of the active region. C is the capacitance, which is usually modeled as a metallic cylinder surrounded by a dielectric some distance from an infinite, flat metallic back gate, leading to the following expressionReference Morse and Feshbach148:

where ε r is the relative dielectric constant, ε 0 is the vacuum permittivity, R is the NW radius, and h is the distance between the gate and the bottom edge of the NW. Improved electrostatic control can be achieved by using a top gateReference Lauhon, Gudiksen, Wang and Lieber27 or by creating a vertical transistor with a wrap gate.Reference Ng, Han, Yamada, Nguyen, Chen and Meyyappan149
In principle, both the carrier concentration and the mobility can be accurately determined with this method. However, many assumptions have been made which lead to limitations of the described model, as discussed in detail by WunnickeReference Wunnicke150 and Khanal and WuReference Khanal and Wu151 First, the dielectric does not surround the NW, but is rather a thin film, which leads to a reduction in capacitance by about a factor of two. Second, Eq. (3) is based on the assumption of an electrostatically metallic NW, while the NW is in fact semiconducting. Khanal and Wu simulated the effective capacitance for different doping levels and found that for highly doped NWs this holds quite well. In the case of nonmetallic NWs, the field penetrates the NW and the charge distribution is far from uniform. Furthermore, the coupling depends on the carrier concentration, and the effective capacitance of low-doped samples can be less than half than of high-doped ones. An accurate model of the capacitance should also include the finite length of the NWReference Khanal and Wu151 and screening by the source and drain contacts.Reference Kretinin, Popovitz-Biro, Mahalu and Shtrikman152
A technical challenge associated with NW-FETs is making good electrical contacts. This can be difficult even with some bulk semiconductors, but NWs pose several additional problems. Theoretical models suggest that higher relative doping levels are needed in NW devices than in planar devices because of depletion.Reference Park, Beresford, Hong and Xu153 Before metal deposition, any oxide should be removed, but because of the small size of the NWs, only gentle processing is possible. Additionally, many contact recipes developed for bulk semiconductors are based on high-temperature annealing, which leads to the formation of compounds and local drive-in of dopants that have been added to the metal layers. For example, a Pd/Zn/Pd/Au combination has been used for ohmic contacts to bulk p-type InP.Reference Ivey, Jian, Wan, Bruce, Eicher and Blaauw154 At a temperature of around 400 °C, Pd reacts with InP and the Zn is driven into the InP since the second Pd layer acts as a cap. However, in a nanometer-scale device such as an NW-FET, such reactions may lead to the entire device becoming metallic. The Zn may also diffuse out into the ambient rather than into the NW. Metals that are known to spike, that is, locally diffuse very deeply, such as Au and Ni, may also be problematic.
Despite these challenges, low-resistance ohmic contacts have been formed to NWs in many cases, for example, p-typeReference Cui, Zhong, Wang, Wang and Lieber155 and n-typeReference Zheng, Lu, Jin and Lieber16 Si, p-typeReference Greytak, Lauhon, Gudiksen and Lieber33, Reference Wang, Wang, Javey, Tu, Dai, Kim, McIntyre, Krishnamohan and Saraswat39 and n-typeReference Greytak, Lauhon, Gudiksen and Lieber33 Ge, p-type GaAsReference Gutsche, Regolin, Blekker, Lysov, Prost and Tegude68 and n-type InP,Reference Duan, Huang, Cui, Wang and Lieber76 and n-typeReference Huang, Duan, Cui and Lieber156 and p-type GaN.Reference Tang, Chen, Song, Lee, Cong, Cheng, Zhang, Bello and Lee52 It is of the utmost importance that the semiconductor is highly doped since this creates a thin Schottky barrier through which carriers may tunnel, although theoretical predictions suggest that this effect is reduced in thin NWs.Reference Leonard and Talin157 With reasonably good ohmic contacts, the contact resistance can be decoupled using transmission line measurements in which the channel length is varied. Four-point measurements can also be used to separate the contact resistance, but Thelander et al.Reference Thelander, Björk, Larsson, Hansen, Wallenberg and Samuelson158 showed that for InAs NW-FETs with low-resistance contacts the inner probes were invasive. Lower-doped materials typically show nonlinear Schottky-like contacts.Reference Borgström, Norberg, Wickert, Nilsson, Trägårdh, Dick, Statkute, Ramvall, Deppert and Samuelson77 Notably, InAs has a degenerate surface inversion layer, which allows ohmic contact formation even to nominally undoped material.
Without high-quality contacts to the NW, the resistance is normally limited by the contacts rather than the NW channel. Since the back gate affects the contacts and the NW channel simultaneously, poor contacts make the interpretation of both source–drain and gate–sweep measurements difficult. Zhang et al.Reference Zhang, Yao, Liu, Jin, Liang, Chen and Peng159 studied the source–drain characteristics of NW-FETs with nonohmic contacts in detail. Even without ohmic contacts, the gate–sweep measurements can be used to identify the type of majority carrier in the device (n- or p-type), and an estimate of the carrier concentration can be obtained from the threshold voltage.Reference Borgström, Norberg, Wickert, Nilsson, Trägårdh, Dick, Statkute, Ramvall, Deppert and Samuelson77
A strategy to circumvent the problems associated with contacts is to highly dope the ends of the NW while leaving the middle segment low-doped.Reference Hayden, Björk, Schmid, Riel, Drechsler, Karg, Lortscher and Riess136, Reference Cohen, Rooks, Chu, Laux, Solomon, Ott, Miller and Haensch137 This type of structure can have very low contact resistance relative to the channel resistance and allows for devices with doping profiles more similar to planar MOSFETs. An extreme version of this concept was developed by Weber et al.,Reference Weber, Geelhaar, Unger, Cheze, Kreupl, Riechert and Lugli160 who deposited Ni contacts on Si NWs and controllably transformed the ends to metallic NiSi2 by annealing.
Overall, NW-FET measurements can often give precise data in terms of device resistance and transconductance. Converting these into quantitative material properties such as carrier concentration and mobility is straightforward, but the actual precision is often questionable because of the number of assumptions made.
Another electrical method involves capacitance–voltage (C–V) measurements, which, when used for thin films, typically utilizes a MOS structure. Information about the carrier density profile can be obtained by measuring the capacitance as a function of the gate voltage. C–V measurements on individual NWs were first demonstrated by Tu et al.Reference Tu, Zhang, Nishi and Dai161 These measurements are difficult since the very low capacitances in NW devices are often hidden by much larger background capacitances, but by careful screening, the authors were able to estimate the mobility of Ge NWs. Roddaro et al. extended the C–V method to vertical devices,Reference Roddaro, Nilsson, Astromskas, Samuelson, Wernersson, Karlström and Wacker162 using small arrays of NWs, and later estimated the carrier concentration as well as the surface state density.Reference Karlström, Wacker, Nilsson, Astromskas, Roddaro, Samuelson and Wernersson163 Recently, this model was also used for studying doping incorporation in InAs NWs.Reference Astromskas, Storm, Karlström, Caroff, Borgström and Wernersson164 Garnett et al.Reference Garnett, Tseng, Khanal, Wu, Bokor and Yang165 used lateral devices combined with theoretical modeling to estimate the radial distribution of carriers in Si NWs. Finally, Bakkers et al.Reference Bakkers, Van Dam, De Franceschi, Kouwenhoven, Kaiser, Verheijen, Wondergem and Van der Sluis166 probed the resistivity of NWs by using a conductive atomic force microscopy tip put on NWs standing as-grown on the substrate.
B. Optical methods
Optical methods are attractive because they usually require no processing and may therefore be simpler and faster than electrical measurements. Although many authors have used photoluminescence (PL) and observed spectra that are characteristic of doped semiconductors, we concentrate here on optical methods intended for quantitative determination of the carrier concentration.
For highly doped semiconductors with low effective mass, the PL can be blue-shifted since the Fermi level shifts above the band edge, a so-called Burstein–Moss shift.Reference Bugajski and Lewandowski167 In a simple parabolic-band model, the shift is given by

However, the high carrier concentration also causes a red-shift because of band gap renormalization, which complicates the analysis. Bugajski and LewandowskiReference Bugajski and Lewandowski167 measured and accurately modeled the peak position and peak width as functions of the carrier concentration in bulk n-doped InP, while Liu et al. found agreement between electrical and optical measurements for n-doped InP NWs.Reference Liu, Dai, You, Xu and Qin81 For NWs grown in the bulk crystal structure, comparisons with published data or bulk reference samples should be able to give accurate estimates of the carrier concentration. Our group has recently observed PL shifted well into the visible region in InP NWs doped using H2S,Reference Wallentin, Mergenthaler, Ek, Wallenberg, Samuelson, Deppert, Pistol and Borgström79 although the doping also caused a transition to the WZ crystal structure for which bulk reference samples are not available.
Raman spectroscopy is another popular optical technique. Kawashima et al.Reference Kawashima, Imamura, Saitoh, Komori, Fujii and Hayashi168 found that highly B-doped Si NWs exhibited a broadened signal toward the high–wave number side, which they attributed to a Fano resonance caused by interference between optical phonon Raman scattering and electric Raman scattering due to intra valence band hole excitation. They also observed a local vibrational mode of B incorporated into Si. Using modeling, they were able to estimate the carrier concentrations, and later these authors used the same technique to estimate the axial carrier distribution in single Si NWs.Reference Imamura, Kawashima, Fujii, Nishimura, Saitoh and Hayashi26 Others have used Raman spectroscopy to study the doping of GaN,Reference Parkinson, Joyce, Gao, Tan, Zhang, Zou, Jagadish, Herz and Johnston169 InN,Reference Cusco, Domenech-Amador, Artus, Gotschke, Jeganathan, Stoica and Calarco72 and GaAsReference Hilse, Ramsteiner, Breuer, Geelhaar and Riechert60, Reference Ketterer, Mikheev, Uccelli and Fontcuberta i Morral67 NWs.
Parkinson et al.Reference Parkinson, Joyce, Gao, Tan, Zhang, Zou, Jagadish, Herz and Johnston170 pioneered the use of transient terahertz photoconductivity measurements for the analysis of NWs. This method is quite complex and relies on computer modeling for quantitative results. However, accurate information on not only the carrier concentration but also the mobility can be obtained. With a related technique, Richter et al.Reference Richter, Luth, Meijers, Calarco and Marso171 and later Sanford et al.Reference Sanford, Blanchard, Bertness, Mansfield, Schlager, Sanders, Roshko, Burton and George172 used photoconductivity measurements of contacted GaN NWs to estimate the carrier concentration, mobility, and surface properties.
C. Mass spectrometric methods
Secondary-ion mass spectrometry (SIMS) is a standard technique for characterizing thin-film semiconductors. It offers extremely high sensitivity but it is a destructive method. The spatial resolution depends strongly on the details of the system used. Note that SIMS, unlike the electrical and optical techniques described earlier, measures the dopant concentration rather than the carrier concentration. Lew et al.Reference Lew, Pan, Bogart, Dilts, Dickey, Redwing, Wang, Cabassi, Mayer and Novak28 used SIMS to compare different B precursors for doping of Si NWs. Putnam et al.Reference Putnam, Filler, Kayes, Kelzenberg, Guan, Lewis, Eiler and Atwater173 investigated the radial distribution of the Au concentration in Au-seeded, micrometer-diameter wires and set an upper limit of 1.7 × 10¹⁶ atoms/cm3.
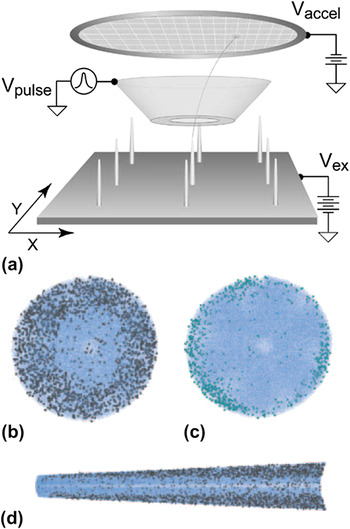
Atom probe tomography (APT), shown in Fig. 5, is a development of SIMS in which a needle-shaped sample is exposed to pulsed electrical fields that remove ions by field emission. By combining time-of-flight measurements with array mass spectrometer detection, a three-dimensional reconstruction of the probed sample can be created. The detection limit can be lower than 1018 atoms/cm3 and the spatial resolution can be in the sub-nanometer range. In principle, the original position of every ion detected—up to 50% of the ions emitted—can be determined. Perea et al. pioneered the use of APT for NW characterization,Reference Perea, Allen, May, Wessels, Seidman and Lauhon174 and later studied Au incorporationReference Allen, Hemesath, Perea, Lensch-Falk, Li, Yin, Gass, Wang, Bleloch, Palmer and Lauhon175 and dopant incorporationReference Perea, Hemesath, Schwalbach, Lensch-Falk, Voorhees and Lauhon21 in NWs. Others have studied B incorporation in Si NW.Reference Xu, Nys, Grandidier, Stievenard, Coffinier, Boukherroub, Larde, Cadel and Pareige176 In some ways, the combination of low detection limits and high spatial resolution makes APT the ultimate tool for characterization of doping, but it also has limitations. The process is relatively slow and only a part of the NW volume can be sampled. The technique requires elaborate sample preparation, such as growing NWs on predefined pillarsReference Xu, Nys, Grandidier, Stievenard, Coffinier, Boukherroub, Larde, Cadel and Pareige176, Reference Perea, Lensch, May, Wessels and Lauhon177 or transferring NWs with a lift-out process using a micromanipulator and a focused ion beam.Reference Prosa, Alvis, Tsakalakos and Smentkowski178 For a recent review of APT analysis of semiconductors, see Ref. Reference Ma, Lee and Lee180.
Atom probe tomography (APT) of nanowires. (a) Schematic of APT instrument. (Adapted from Fig. 1 in Ref. Reference Prosa, Alvis, Tsakalakos and Smentkowski178, with permission from Springer Science+Business Media B.V.) (b, c) End-on view of Ge nanowire highlighting the distribution of (b) phosphorus (grey spheres) and (c) oxygen (light blue spheres) in germanium (blue dots). (d) Side view of nanowire cross section. [(b)–(d) Adapted from Ref. Reference Perea, Hemesath, Schwalbach, Lensch-Falk, Voorhees and Lauhon21, courtesy of Nature Publishing Group.]

D. Scanning probe methods
Various scanning probe techniques have been used to investigate NW doping.Reference Ma, Lee and Lee180–Reference Vinaji, Lochthofen, Mertin, Regolin, Gutsche, Prost, Tegude and Bacher182 Scanning probe methods can have very high spatial resolution and are typically surface sensitive. Similarly to optical techniques, qualitative indications of doping can often be obtained, but quantitative measurements are more challenging. The doping of Si NW was quantitatively studied by Allen et al.Reference Allen, Perea, Hemesath and Lauhon111 with scanning photocurrent microscopy (SPCM). Koren et al. used Kelvin probe force microscopy (KPFM) and successive etching steps to obtain the radial distribution of dopants in Si NWs,Reference Koren, Berkovitch and Rosenwaks183 and they also combined KPFM with SPCM to investigate the axial doping profile of Si NWs.Reference Koren, Rosenwaks, Allen, Hemesath and Lauhon23 Scanning spreading resistance microscopy has also been used to measure the conductivity of NWs standing as-grown,Reference Celle, Mouchet, Rouviere, Simonato, Mariolle, Chevalier and Brioude24 as well as in cross-section.Reference Ou, Das Kanungo, Kögler, Werner, Gösele, Skorupa and Wang184 Finally, Stiegler et al.Reference Stiegler, Huber, Diedenhofen, Rivas, Algra, Bakkers and Hillenbrand185 investigated doped InP NWs with scattering-type scanning near-field optical microscopy.
E. Electron beam methods
Electron beam techniques such as energy dispersive x-ray spectroscopy are often standard techniques for the characterization of NW heterostructures. These have high spatial resolution but the relatively low sensitivity limits their use in characterizing doping. Our group has recently been able to detect Se in InAs NWs,Reference Thelander, Dick, Borgström, Fröberg, Caroff, Nilsson and Samuelson85 Zn in InP NWs,Reference Wallentin, Ek, Wallenberg, Samuelson, Deppert and Borgström83 and S in H2S-doped InP NWs.Reference Wallentin, Mergenthaler, Ek, Wallenberg, Samuelson, Deppert, Pistol and Borgström79 In the last case, the signal was strong enough to allow radial scans displaying increased signal at the surface of the NWs. Wang et al.Reference Wang, Song, Chen, Wang, Wang, Liu, Shen, Wan, Wang and Xu186 recently measured the Co distribution in ZnO NWs with electron energy loss spectroscopy.
VII. CONCLUSIONS
The doping of semiconductor NWs has seen tremendous development during the past years. The most promising results have been achieved with in situ doping, with which many materials have been successfully doped to levels similar to the corresponding thin films. Although much progress has been made in the measurement of NW doping, the fundamental understanding of NW doping is still hampered by the lack of simple and precise measurement methods. In situ doping has many strong and interesting effects on NW growth, effects which are sometimes greater than those achieved by tuning regular growth parameters. Although these effects further complicate the already complex area of NW growth, many authors have demonstrated successful devices using in situ doping.
ACKNOWLEDGMENTS
This work was performed within the Nanometer Structure Consortium at Lund University and was supported by the Swedish Research Council, the Swedish Foundation for Strategic Research, the Nordic Innovation Centre project Nanordsun, and the EU program AMON-RA (214814). This report is based on a project that was funded by E.ON AG as part of the E.ON International Research Initiative. The authors thank Claes Thelander and Knut Deppert for valuable discussions.