Introduction
Multiple sclerosis (MS) is an inflammatory, demyelinating disease of the central nervous system that includes neurodegeneration in its pathogenesis, and it is considered a chronic, immune-mediated neurological disorder (Kornek & Lassmann, Reference Kornek and Lassmann2003; Prinster et al., Reference Prinster, Quarantelli, Orefice, Lanzillo, Brunetti, Mollica, Salvatore, Morra, Coppola, Vacca, Alfano and Salvatore2006; Charil & Filippi, Reference Charil and Filippi2007; Cohen, Reference Cohen2009; Bendfeldt et al., Reference Bendfeldt, Egger, Nichols, Loetscher, Denier and Kuster2010; Fusco et al., Reference Fusco, Guerini, Nocera, Ventrella, Caputo and Valentino2010; Havrdova et al., Reference Havrdova, Galetta, Stefoski and Comi2010). This disease is more prevalent in North America, Northern Europe, and the Middle East (Mortazavi et al., Reference Mortazavi, Kouzani and Soltanian-Zadeh2012).
Visual dysfunctions are frequent features of this disease, and optic neuritis (ON) is the most common early clinical manifestation (Glisson & Galetta, Reference Glisson and Galetta2009). A number of recent studies conducted on MS patients with or without a history of ON assessed visual functions by using Snellen, Pelli–Robson, and Sloan 1.25% and Sloan 2.5% charts, and CS is mainly estimated with the Pelli–Robson chart. In accordance, two studies found impairments of visual acuity in people with MS using the Sloan’s tables of letters that involve low levels of contrast (Fisher et al., Reference Fisher, Jacobs, Markowitz, Galetta, Volpe, Nano-Schiavi, Baier, Frohman, Winslow, Frohman, Calabresi, Maguire, Cutter and Balcer2006; Mowry et al., Reference Mowry, Loguidice, Daniels, Jacobs, Markowitz, Galetta, Nano-Schiavi, Cutter, Maguire and Balcer2009). Indeed, Balcer and Frohman (Reference Balcer and Frohman2010) have argued that the traditional vision test charts that measure visual acuity with high contrast (e.g., the Snellen chart) have been insufficient in detecting subtle visual changes, including when there is no history of ON. But this is not the case when measurements involve the evaluation of visual functions at low levels of contrast (Graves et al., Reference Graves, Galetta, Palmer, Margolin, Rizzo, Bilbruck and Balcer2013).
In addition, Merle et al. (Reference Merle, Olindo, Donnio, Beral, Richer, Smadja and Cabre2010) estimated visual function employing four charts: the visual acuity Snellen chart; the Pelli–Robson chart; the Sloan 1.25% chart; and the Sloan 2.5% chart. The researchers found no differences between volunteers with MS, without a history of ON and the CG, except across both Sloan charts. Besides, they found no significant correlations between the overall average thickness of the retinal nerve fiber layer (RNFL) and the tested visual functions, including CS, for the MS non-ON group as compared to the CG. A more recent study by Walter et al. (Reference Walter, Ishikawa, Galetta, Sakai, Feller, Henderson, Wilson, Maguire, Galetta, Frohman, Calabresi, Schuman and Balcer2012) observed significant thinning of the macular RNFL, even in MS non-ON eyes. However, no differences were found in the ganglion cell layer (GCL), the inner plexiform layer (IPL), or across any of the other retinal layers in the same group.
Contrast sensitivity has been traditionally defined as being the reciprocal of contrast threshold, and a variation in CS over a range of spatial frequencies is described as the CSF (Campbell & Robson, Reference Campbell and Robson1968). The CSF is commonly described in logarithmic units of CS as a function of spatial frequency, which are normally expressed in cycles per degree (cpd) of the visual angle (Campbell, Reference Campbell1983). In addition, the CSF reproduces the shape of an inverted letter “U” (Leguire et al., Reference Leguire, Algaze, Kashou, Lewis, Rogers and Roberts2011), where the peak refers to a maximum CS in human vision, and attenuation occurs at low and high spatial frequencies.
The CSF became one of the main tools used in the theoretical and clinical analysis of sight or vision structure (Adams & Courage, Reference Adams and Courage2002). It has been used to characterize the response of the human visual system to elementary stimuli. And the most frequently used stimuli are vertical sine-wave gratings, which consist of spatially periodic stimuli (Cornsweet, 1970; Campbell & Maffei, Reference Campbell and Maffei1974; Schwartz, Reference Schwartz2004; Díez-Ajenjo & Capilla, Reference Díez-Ajenjo and Capilla2010), and are defined in a cartesian system of coordinates. According to the literature, this pattern is mostly processed in the striatal (primary) areas of vision (Wilson et al., Reference Wilson, Wilkinson and Asaad1997; Wilkinson et al., Reference Wilkinson, Wilson and Habak1998).
A research by Regan et al. (Reference Regan, Silver and Murray1977) presented the first results on decreased CS in MS, for the authors observed the decline in CSF exactly at the peak of sensitivity in human vision. This was also observed in a similar way, in the research of Sisto et al. (Reference Sisto, Trojano, Vetrugno, Trabucco, Iliceto and Sborgia2005) using the CSV-1000 test, but with high frequencies (12 cpd and 18 cpd). In the study by Logi et al. (Reference Logi, Pellegrinetti, Bonfiglio, Baglini, Siciliano, Lucide and Sartucci2001), participants with MS needed greater contrast to detect vertical sine-wave gratings, as compared to horizontal ones, when CS to spatial frequencies of 0.5, 1, 3.7, 5, 10, and 20 cpd were tested.
But, the evaluation of the specific characteristics of visual damage, or loss, is highly dependent, in part, on the spatial configuration of the stimulus pattern used in the measurements (Flanagan & Markulev, Reference Flanagan and Markulev2005). Thus, a resumption of research methods that used vertical sine-wave stimuli (e.g., Regan et al., Reference Regan, Silver and Murray1977) is needed to compare the results obtained with angular frequency stimuli that are processed by different groups of neurons.
An angular frequency stimulus is defined in a polar system of coordinates (Simas, Reference Simas1985; Simas & Dodwell, Reference Simas and Dodwell1990; Gallant et al., Reference Gallant, Braun and Essen1993). This type of stimulus is dimensionless and independent of the distance from the observer. In this stimulus, contrast varies in accordance with angle, and angular frequencies are always given by an integer number of cycles per 360°. According to Simas (Reference Simas1985), the angular frequency stimulus is the result of adding an orthogonal component to the target stimulus, which is presented as radial J 0 (circular and symmetrical), as introduced previously by Kelly (Kelly, Reference Kelly1960; Kelly & Magnuski, Reference Kelly and Magnuski1975).
Simas et al. (Reference Simas, Santos and Thiers1997) measured the CSF for angular frequency stimuli and vertical sine-wave gratings and compared their respective maximum contrast sensitivities. They found that the CS for angular frequency stimuli was 1.6-fold higher than that for vertical sine-wave gratings. This is probably due to the fact that patterns in polar coordinates are integrated at the post-striatal visual areas (Wilkinson et al., Reference Wilkinson, James, Wilson, Gati, Menon and Goodale2000).
There are only a few theoretical and clinical studies that have been conducted with stimuli defined by polar coordinates, particularly among MS patients. The effects of MS on CS in response to angular frequency stimuli are unprecedented in the literature on MS. Therefore, the objective of this study was to evaluate CS in adults with relapsing–remitting MS by measuring the CSF using sine-wave vertical gratings and angular frequency stimuli.
Materials and methods
Participants
This research was submitted to and approved by the Committee of Research Ethics. Volunteer participation required the signing of a consent form. The study included 20 volunteers (21–44 years old, with an average age of 30.8 ± 8.2 years), 10 of whom were diagnosed with clinically definite MS (McDonald et al., Reference McDonald, Compston, Edan, Goodkin, Hartung and Lublin2001; Polman et al., Reference Polman, Reingold, Edan, Filippi, Hartung and Kappos2005) and of the relapsing–remitting clinical form (Lublin & Reingold, Reference Lublin and Reingold1996). None of the subjects had ON, as verified by MRI, neuro-ophthalmologic assessment, and data from the patients’ medical records. All patients were referred to the experiments during the symptom remission phase.
A selection of volunteers with the clinical form of relapsing–remitting MS is established based on the fact that over 85% of cases begin the course of this disease with this clinical expression (Courtney et al., Reference Courtney, Lcsw-Acp, Bsn and Frohman2009).
According to the epidemiological data from the Health Secretary of the State of Paraíba, there are 66 people with MS in the city of João Pessoa, Paraíba, Brazil. This study could only draw 46 people who were eligible to participate in the experiments; among the total of 66 individuals, two people were under 20 years and 18 were over the age of 50 years. Of the 46 adults eligible for the survey, there were a total of 25 adult respondents. However, 15 of these individuals were removed based on the following exclusion criteria: the presence of ON, cataract, strabismus, nystagmus, depression, smoking, peripheral neuropathy, glaucoma, and a visual acuity of 30/40.
The other 10 volunteers, all of which were without neurological or ophthalmological damages, were randomly selected for participation in the control group. The volunteers in the control group were chosen based both on their similarity to the ages of the experimental group (20–44 years; mean age of 28.6 ± 6.8 years), and on their occupation equivalent: graduation and high school students, or commerce employees.
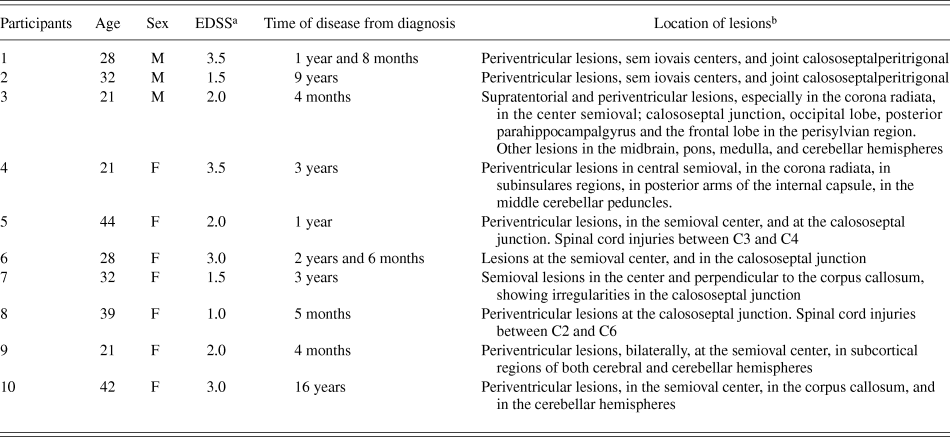
The characteristics and additional clinical information about these volunteers are shown in Table 1.
Clinical characteristics of participants with multiple sclerosis

a EDSS = expanded disability status scale (Kurtzke, Reference Kurtzke1983).
b Records obtained by magnetic resonance imaging, with T2 – weighted gadolinium-enhanced and T1 – weighted techniques.
Both groups had no prior knowledge of the tests, and they attended the same training session prior to the experiments. All volunteers showed satisfactory performance on tests of color vision with Ishihara plates, in addition to 20/20 visual acuity, and normal or corrected to normal vision. The latter factor was measured with Rasquin’s “E” optotypes presented at high contrast, 600 cm away from the screen, monocularly (Rubin et al., Reference Rubin, Muñoz, Bandeen-Roche and West2000).
Equipment
The stimuli were presented on a 19-inch LG video monitor (cathode ray tube), which was driven by the video processor, BITS + + (Cambridge Research Systems, Rochester, United Kingdom), to increase the linear dynamic range of contrast levels. The screen luminance calibration and the gamma correction were made with a Color Cal photometer (Cambridge Research Systems).
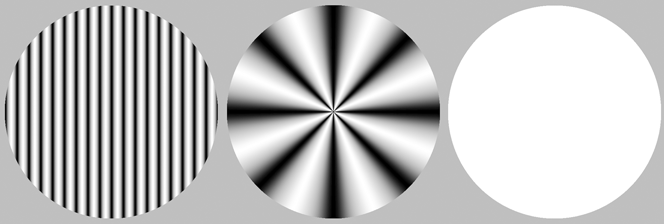
An achromatic, static, and circular stimulus with a visual angle diameter of 4.7° was presented at the center of the display. The vertical sine-wave gratings had spatial frequencies of 0.5, 1.25, 2.5, 4, 7.5, 10, and 20 cycles per degree and the angular frequency stimulus had spatial frequencies of 1, 2, 4, 24, and 48 cycles/360°. We also used a gray circle at mean luminance as the noise stimulus in the forced-choice procedure (Fig. 1).
Examples of visual stimuli used: vertical sine-wave grating in cpd; angular frequency in cycles/360°; and neutral at mean luminance.
Experimental procedures
We employed a psychophysical forced-choice method (Wetherill & Levitt, Reference Wetherill and Levitt1965) to evaluate the CS within a detection paradigm, in which the volunteer had to choose between two stimuli—one containing the test frequency (sine-wave grating or angular frequency stimulus) and the other at mean luminance (noise). This method is based on the probability of correct consecutive choices made by the participant. So, following three consecutive correct responses, contrast is decreased by 20% and, following each error, contrast is increased by 20%. Measurements of the CSF were carried out binocularly (Rubin et al., Reference Rubin, Muñoz, Bandeen-Roche and West2000) at a distance of 300 cm from the monitor display, in photopic conditions, with a mean luminance of 41.05 cd/m2.
Participants were subjected to successive discriminations between pairs of stimuli presented at the center of the monitor screen. The order of stimulus presentation was random. Prior to each experimental session, volunteers were instructed to press the left button of the mouse (or number 1) when they perceived the test stimulus in the first presentation and the right button (or number 2) when they perceived the test stimulus in the second presentation. The experiments were only initiated when participants acknowledged that they fully understood the procedure. Each stimulus was presented for 2 s, with intervals of 1 s between stimuli. The intervals between the trials lasted a minimum of 3 s, starting only after each response was made by the participant. The experimental sessions, for each test frequency, began with contrast levels set at suprathreshold levels. The number of presentations needed to estimate the contrast threshold varied depending on the correct responses and errors made by the observer, and it also depended on the criteria of five maxima and five minima per session. Two measures for each frequency were obtained for all volunteers (those with MS and those in the CG), always on different days.
Results
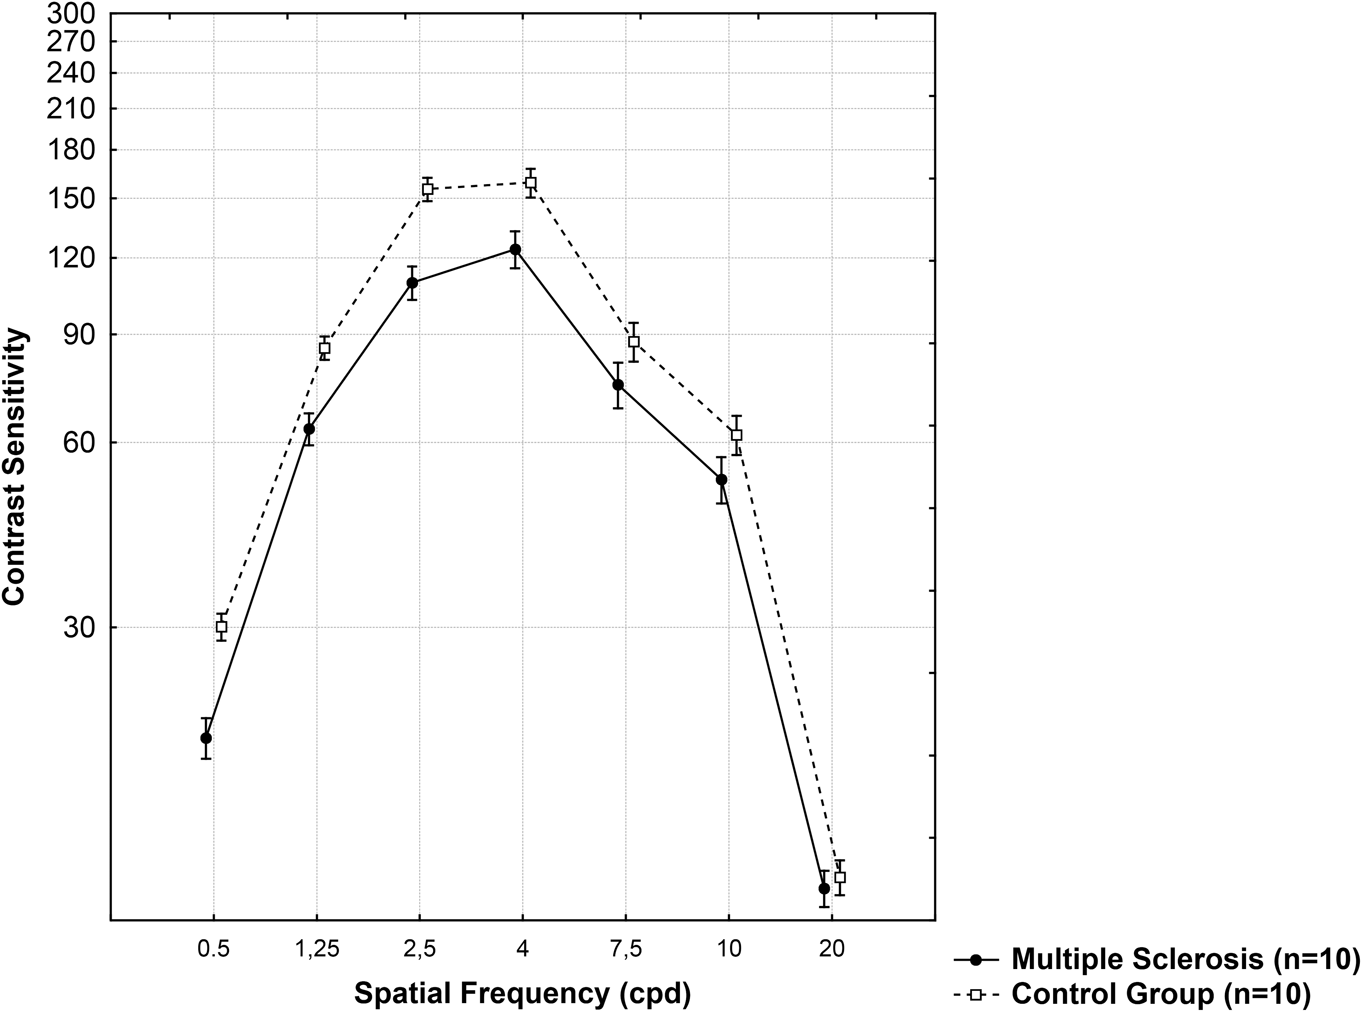
Fig. 2 shows the CSF for the detection of vertical sine-wave gratings for the MS group and the CG. The CSFs showed similar profiles: maximum sensitivity occurred at 4 cpd for both groups. On average, the CS of the MS group reached only 66%, 74%, 70%, 78%, 85%, 85%, and 96% for spatial frequencies of 0.5, 1.25, 2.5, 4, 7.5, 10, and 20 cpd, respectively, when compared to the CS estimates of the CG. Results from t-tests comparing the independent groups for each pair of spatial frequencies showed significant differences at 0.5, 1.25, and 2.5 cpd (P < 0.002).
Curves of CS of participants with MS and of healthy participants for vertical sine-wave gratings. The error bars are standard errors of the mean for each frequency.
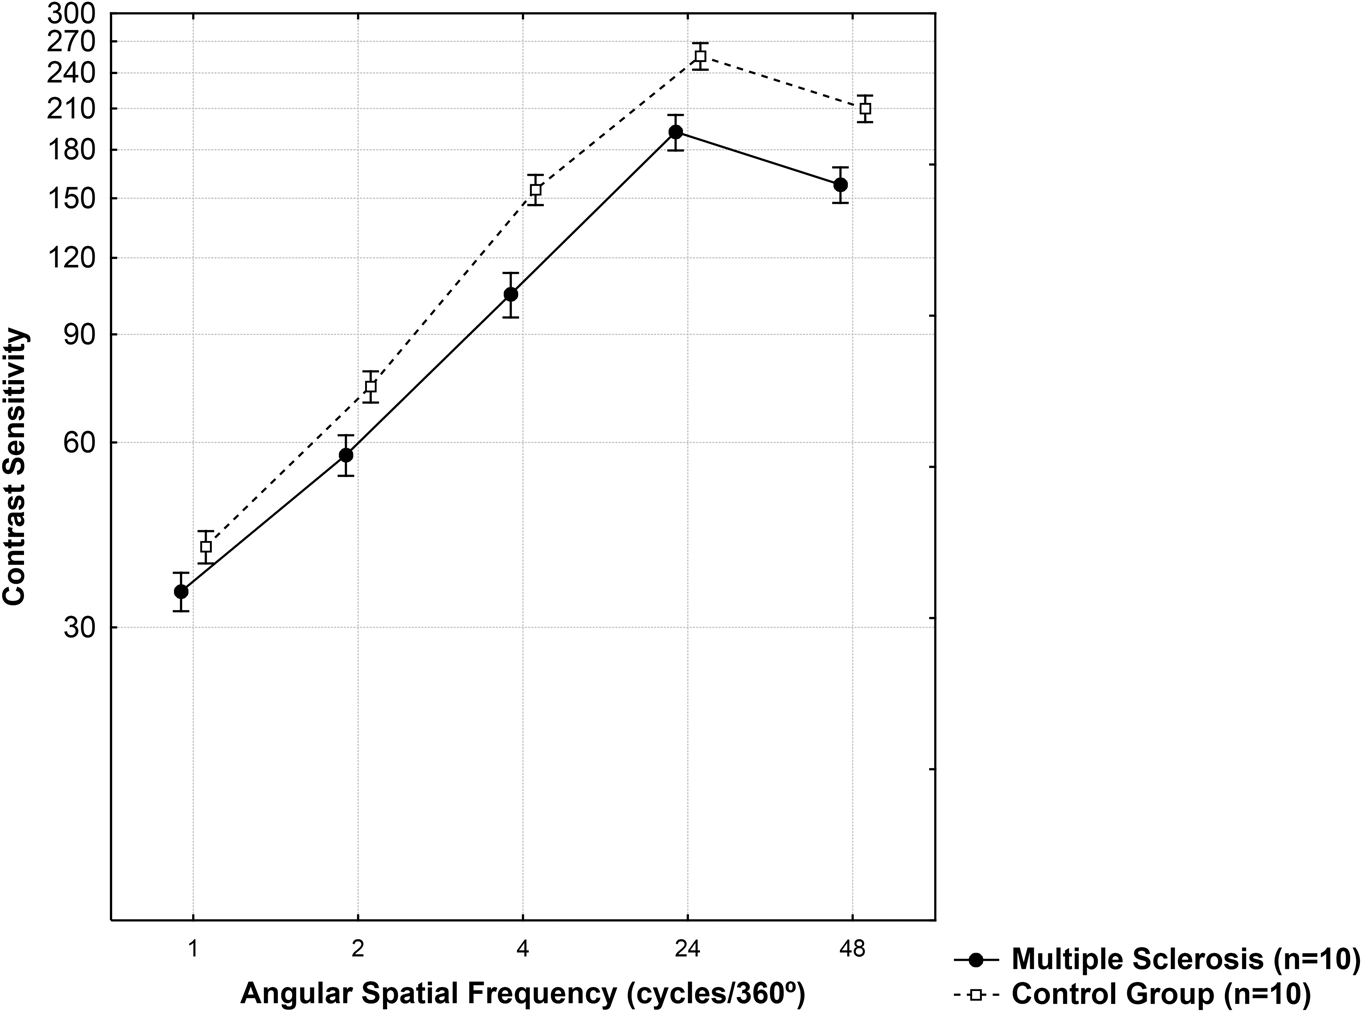
Fig. 3 shows the CSF for the angular frequency stimuli in the MS group and the CG. The curves also presented similar profiles. Participants with MS reached only 85%, 77%, 68%, 75%, and 75% of the CS for the CG to detect angular spatial frequencies of 1, 2, 4, 24, and 48 cycles/360°, respectively. Results from the t-tests for the independent groups showed significant differences at angular spatial frequencies of 4, 24, and 48 cycles/360° (P < 0.05).
Curves of CS of participants with MS and of healthy participants to angular frequency stimuli. The error bars are standard errors of the mean.
Also, for the CG, measurements of the CSF yielded a maximum CS to angular frequency stimulus at 24 cycles/360°, which was 1.61-fold higher than the maximum CS to vertical sine-wave gratings at 4.0 cpd. This ration was only 1.55 for the MS group.
Discussion
This study compared the CS in adults with relapsing–remitting MS to the CS of healthy adults by measuring the CSF for two classes of spatial frequency stimuli: vertical sine-wave gratings and angular frequency stimuli. Participants with MS showed reductions in CS for sine-wave gratings at spatial frequencies of 0.5, 1.25, and 2.5 cpd and for angular spatial frequencies of 4, 24, and 48 cycles/360°. Thus, visual impairment was found at the low and middle range for sine-wave gratings and at the high range for angular frequency stimuli. Also, the objective to verify whether these changes are already seen in the initial course of the disease was attained—the response to that question is positive.
The present results are also in agreement with those from several studies, which have shown the presence of subclinical changes in the visual systems of people with MS (Sisto et al., Reference Sisto, Trojano, Vetrugno, Trabucco, Iliceto and Sborgia2005; Balcer & Frohman, Reference Balcer and Frohman2010). And the results of the present study also reproduced the important observations made by Regan et al. (Reference Regan, Silver and Murray1977) regarding CS in MS.
Moreover, there are no studies to date that assessed the CS to angular frequency stimuli in MS. Thus, we chose to measure the CSF for vertical sine-wave gratings, to allow for comparisons with previous studies.
The findings of the present study also showed a ratio of 1.61 between the maximum sensitivities for the angular frequency stimuli and that for sine-wave gratings, as measured by the CG, and as found in previous studies (Simas et al., Reference Simas, Santos and Thiers1997). This can be better observed when comparing the performance of volunteers, as shown in Fig. 2 with those presented in Fig. 3, where a higher range of the logarithmic scale for CS to angular spatial frequencies was observed. Also, the measured CSF for sine-wave gratings by the CG replicated those found in the literature (e.g., Campbell & Robson, Reference Campbell and Robson1968; Campbell & Maffei, Reference Campbell and Maffei1974).
We conclude that it is necessary to expand upon the research pertaining to how the CSF behaves in different clinical forms of MS, and the correlation of those psychophysical results with the clinical ones, in order to determine the implications of high- and low-contrast visual impairments in activities of daily living.
Finally, a novel contribution of the present study is the fact that the use of angular frequency stimuli detected losses in volunteers with MS, without a history of ON over a higher and wider range of maximum CS, at high and low angular spatial frequencies. Further, we should also investigate whether the use of angular frequency stimuli allows for detection of loss of visual functions in MS prior to those detected with sine-wave gratings.
Acknowledgment
We thank the following funding agencies: the National Research Council (CNPq), Coordination for the Improvement of Higher Education’s Human Resources (CAPES), and the Foundation for Science and Technology of Pernambuco State (FACEPE). Thanks also to the Multiple Sclerosis Association of Paraíba (APBEM) and neurologist Etelvina Bianca Santos de Oliveira.
Competing interests
The authors declare that they have no competing interests.