


Introduction
Successful conservation of large carnivores depends on a good understanding of their population status and trends (Carter et al., Reference Carter, Levin, Barlow and Grimm2015). The tiger Panthera tigris (Linnaeus, Reference Linnaeus1758) is the largest extant felid species, and is widely recognized as a symbol of successful wildlife conservation (Luo et al., Reference Luo, Johnson, Walt, Martenson, Yuhki and Miquelle2004; Goodrich et al., Reference Goodrich, Wibisono, Miquelle, Lynam, Sanderson and Chapman2022). Tigers occur at comparatively low densities in human-dominated landscapes and rely on conservation measures to secure and restore their populations in natural habitats (Dahal et al., Reference Dahal, Lamichhane, Giri, Acharya, Acharya and Harihar2023). The species is categorized as Endangered on the IUCN Red List of Threatened Species (Goodrich et al., Reference Goodrich, Wibisono, Miquelle, Lynam, Sanderson and Chapman2022) and listed on CITES Appendix I (CITES, 2025). Tigers are threatened throughout their range by habitat loss and degradation, and by poaching and depletion of natural prey (Carroll & Miquelle, Reference Carroll and Miquelle2006; Dinerstein et al., Reference Dinerstein, Loucks, Wikramanayake, Ginsberg, Sanderson and Seidensticker2007). It is estimated that they occupy < 7% of their historic range and number 3,726–5,528 individuals worldwide (Goodrich et al., Reference Goodrich, Wibisono, Miquelle, Lynam, Sanderson and Chapman2022). With c. 70% of the tiger population concentrated at 40 sites, effective management is essential for global conservation (Walston et al., Reference Walston, Robinson, Bernnett, Breintenmoser, da Fonseca and Goodrich2010), and rigorous site-specific assessments of population dynamics and behaviour are necessary to guide local conservation actions (Karanth & Nichols, Reference Karanth and Nichols2002; Smith et al., Reference Smith, McDougal, Gurung, Shrestha, Shrestha, Allendorf and Dhakal2010; Dahal et al., Reference Dahal, Lamichhane, Giri, Acharya, Acharya and Harihar2023).
The tiger population in Nepal has more than doubled since 2010, increasing from 121 adult tigers in 2010 to 355 in 2022, and surpassing the country’s commitment made at the International Tiger Forum in St. Petersburg in 2010 (DNPWC & DFSC, 2022). This may be attributed to forest protection and restoration under the community forestry and buffer zone conservation programmes, and the creation of additional suitable habitat in the wider Terai Arc Landscape in Nepal, which has contributed to significant wildlife recovery in general (Chanchani et al., Reference Chanchani, Lamichhane, Malla, Maurya, Bista and Warrier2014). Tigers are obligatory meat eaters (Karanth et al., Reference Karanth, Nichols, Kumar, Link and Hines2004) that require sufficient prey and favourable habitat to survive. Under optimal conditions, tiger populations will increase and disperse into unoccupied areas (Chapron et al., Reference Chapron, Miquelle, Lambert, Goodrich, Legendre and Clobert2008). However, if suitable habitat is limited, young tigers are forced to search for vacant territories in landscapes dominated by people, and old, wounded or diseased tigers also move into these marginal areas, leading to human–wildlife conflict (Karanth & Gopal, Reference Karanth, Gopal, Woodroffe, Thirgood and Rabinowitz2005).
There is limited space and opportunity to provide suitable tiger habitat outside protected areas where there is competition for land (Aryal et al., Reference Aryal, Lamsal, Ji and Taubenheimer2016). This can lead to more cases of tiger attacks on people or their livestock, posing a significant threat to both (Dhungana et al., Reference Dhungana, Savini, Karki, Dhakal, Lamichhane and Bumrungsri2018). People are vulnerable to tiger attacks when they enter forests to gather resources such as firewood, grass and fish (Paudel et al., Reference Paudel, Kc, Kadariya, Karki, Shrestha and Shah2024). A greater understanding of the tiger population in protected area buffer zones is needed to provide information about potential encounters with people and to formulate management strategies to enable human–tiger coexistence.
The Nepal Government periodically carries out a national tiger population assessment in and around protected areas across the Terai Arc Landscape, which gives a broad picture of tiger numbers. The tiger population in Chitwan National Park in south-central Nepal has fluctuated around c. 100 animals over the last 15 years (91 in 2009; 120 in 2013; 93 in 2018; 128 in 2022; DNPWC & DFSC, 2022), indicating a reasonably stable population, and Dahal et al. (Reference Dahal, Lamichhane, Giri, Acharya, Acharya and Harihar2023) reported sufficient prey to support c. 138 tigers. Chitwan National Park is contiguous with Parsa National Park in Nepal and Valmiki Tiger Reserve in India, forming the Chitwan–Parsa–Valmiki Complex (Chanchani et al., Reference Chanchani, Lamichhane, Malla, Maurya, Bista and Warrier2014). There is some evidence of transient and dispersing tigers moving out of the protected areas through suitable habitat in buffer zone forests where there is a high chance of encountering people.
Here, we aimed to gain insights into the population size, structure, distribution and movements of tigers in three management zones (core area, buffer zone, adjoining forests) in and around Chitwan National Park, to inform the Park’s conservation strategy, including the management of human–wildlife conflict. We recorded the size and density of the tiger population in each management zone in 2018 and 2022 and explored the factors driving the differences. Specifically, we investigated the ranging behaviour of adult tigers and the sex ratio in each management zone. Finally, we mapped the spatial distribution of attacks on people and livestock in the buffer zone area.
Study area
The study was conducted in the Chitwan valley, bounded by the Siwalik (Chure) hills in south-central Nepal, where Chitwan National Park is located (Fig. 1). The Park is the country’s oldest protected area, a UNESCO World Heritage Site and an important tiger conservation landscape (Dinerstein et al., Reference Dinerstein, Loucks, Wikramanayake, Ginsberg, Sanderson and Seidensticker2007). Chitwan is embedded within the eastern part of the transboundary Terai Arc Landscape of southern Nepal, a critical region for sustaining global tiger population recovery (Seidensticker et al., Reference Seidensticker, Dinerstein, Goyal, Gurung, Harihar and Johnsingh2010; DNPWC & DFSC, 2022). The Park comprises a core area of 953 km2 surrounded by a 729 km2 buffer zone, which encompasses 22 Buffer Zone User Committees. These committees are formed by the Park management authorities to involve local people in biodiversity conservation, community development and implementation of the buffer zone programmes. A large forest patch connected to Chitwan National Park and its buffer zone is located in the north part of Chitwan valley (Fig. 1).
The study area in Chitwan valley showing the location of Chitwan National Park, the buffer zone and adjoining forests in Nepal. A 2 × 2 km grid was superimposed over the study area, with one pair of camera traps placed in each grid cell. The inset map shows protected areas in Nepal and the location of the study area.

Fig. 1 Long description
A map of the Chitwan valley in Nepal displaying camera-trap locations and boundaries. The map includes Chitwan National Park, the buffer zone, and adjoining forests. A 2 by 2 kilometer grid is superimposed over the study area with one pair of camera traps placed in each grid cell. The inset map shows protected areas in Nepal and the location of the study area. Key boundaries are marked with different colors: black for Chitwan National Park, pink for the buffer zone, blue for adjoining forests, and a dotted line for the international border.
Chitwan National Park supports the largest tiger population of the five tiger parks in Nepal (Chitwan, Bardia, Banke, Parsa, and Shuklaphanta National Parks). There is a wide range of ungulate prey including sambar deer Rusa unicolor, chital Axis axis, hog deer Axis porcinus, wild boar Sus scrofa, barking deer Muntiacus vaginalis, four-horned antelope Tetracerus quadricornis, mainland serow Capricornis sumatraensis and gaur Bos gaurus (Karki et al., Reference Karki, Pandav, Jnawali, Shrestha, Pradhan and Lamichhane2015).
We divided our study area into three categories based on accessibility to local communities and resource use: (1) National Park (also referred to as core area), dedicated to strict wildlife protection with legal boundaries under the jurisdiction of park wardens; (2) buffer zone, legally declared with clear boundaries around the Park to provide additional habitat for wildlife but allowing legal access for resource use by the local community, involving participatory management; and (3) adjoining forests, community- or government-managed under the jurisdiction of the Division Forest Office to provide timber, firewood and other forest resources to local communities (Fig. 1). The adjoining forests provide additional habitat for wildlife, including tigers, and were included in our tiger surveys.
Methods
Camera-trap surveys
We used camera-trap data from Nepal’s National Tiger Survey in 2018 and 2022 (DNPWC & DFSC, 2022) with permission from the Department of National Parks and Wildlife Conservation (DNPWC), following a formal review and permissions process. Camera-trap surveys were conducted systematically over 15 days across all potential tiger habitats (forests, grasslands, rivers) within the study area (Fig. 1). The surveys took place during the cool–dry season (December–April) in 2017–2018 and 2021–2022. The survey used Cuddeback and/or Panthera cameras (Cuddeback, USA; Panthera, USA), with a pair of camera traps in each 2 × 2 km grid cell within the study area. Cameras were set 6–10 m apart, 45–60 cm above the ground, and placed along forest roads, dry streambeds and animal trails to optimize the capture of large carnivores. The cameras operated continuously and were checked once per week to collect data cards, ensure cameras were operational and replace batteries, as needed. Because of the limited availability of camera traps and logistical constraints, the study area was divided into three blocks that were surveyed consecutively. We assumed that the tiger population estimated from the camera-trap images in a particular survey period would be representative of the annual population as tigers are territorial and there is no evidence of seasonal migration.
Tiger identification
We collated tiger photographs and videos from the camera traps based on location, date and time of capture. We identified tigers individually from their unique stripe patterns; sex was determined by morphological characteristics including visible testes on males (Schaller, Reference Schaller1967; Hiby et al., Reference Hiby, Lovell, Patil, Kumar, Gopalaswamy and Karanth2009; Lamichhane et al., Reference Lamichhane, Pesoon, Leirs, Musters, Subedi and de Iong2017). Three independent observers conducted the tiger identification, which was cross-verified collectively by an additional 6–7 observers. We also used ExtractCompare (Conservation Research Ltd, UK) to verify individual tigers identified visually (Hiby et al., Reference Hiby, Lovell, Patil, Kumar, Gopalaswamy and Karanth2009). We retained only images of identifiable adults for further analysis; images of cubs and unidentifiable adults were discarded from the dataset.
Population size, density and ranging behaviour
We estimated tiger population densities using Bayesian spatial capture–recapture models (Borchers & Efford, Reference Borchers and Efford2008; Royle & Gardner, Reference Royle and Gardner2011). Location of cameras was a source of capture heterogeneity (Sollmann et al., Reference Sollmann, Furtado, Gardner, Hofer, Ja’como, Torres and Silveira2011). We used the program JAGS (JAGS, 2021) accessed through R 4.0.4 (R Core Team, 2021) to apply the following model: p0(sex+camera site).σ(sex), where p0 denotes the probability of capture when the distance between the animal’s activity centre and the camera is zero, and σ is the ranging scale parameter. In data augmentation, M (number of activity centres) was set to 300, a value known to be larger than the largest possible population size. The centroids of capture locations for individual tigers were used as the starting values for our analysis of activity centres, which occurred in suitable habitat as defined in the habitat mask. We implemented three Markov chains with 200,000 iterations, a burn-in of 2,000 and a thinning rate of 10. The combined values ensured an adequate number of iterations to characterize the posterior distributions. We used the Gelman–Rubin statistic and Ȓ, which compares between- and within-chain variation, to examine chain convergence (Gelman et al., Reference Gelman, Carlin, Stern and Rubin2004), whereby a value of Ȓ < 1.1 indicated convergence (Gelman & Hill, Reference Gelman and Hill2006). The model generated posterior distributions of population density, and male and female ranging parameters. Simultaneously, maps of posterior locations of individual tiger activity centres were produced, and animal density maps (individuals/km2) for 2018 and 2022 were generated by simulating the movement of animals around activity centres. Tiger activity centres in the surveyed area (as defined by the camera grid minimum convex polygon, MCP), core area, buffer zone and adjoining forest were extracted to obtain area-specific population estimates. We used posterior probabilities and the Wald test to assess significant differences between the 2018 and 2022 population estimates for the core area, buffer zone and adjoining forests.
Sex ratio
We tabulated the identities of adult male and female tigers captured by camera traps in a spreadsheet and calculated the observed female-to-male sex ratio for the core area, buffer zone area and adjoining forests in 2018 and 2022.
Human–tiger conflict
People have legal access to the buffer zones and community forests, where their resource use overlaps with tiger habitats. We investigated the effects of anthropogenic disturbance on tiger habitat use by overlaying cases of human–tiger conflict with tiger density in nearby buffer zones. We collected data on tiger attacks on people and livestock predation by tigers in the buffer zone area during 2018–2022 from records kept by the Chitwan National Park Office. In Nepal, it is mandatory to maintain a database of human–wildlife conflict for the purpose of releasing wildlife damage relief to the families of victims. These data are obtained systematically by the Park Office through recommendations by Buffer Zone User Committees according to the Wildlife Damage Relief Guidelines 2013 (Baral et al., Reference Baral, Ghimire and Basnet2022). As tiger-related cases are sensitive and there is a high awareness of the relief payments amongst communities, almost all incidents eligible for the relief are recorded in the Park’s database, providing comprehensive data on human–tiger conflict.
The data included details of people killed or injured by tigers and/or the type of livestock killed (cattle, buffaloes, goats, pigs), with dates and GPS locations within each of the 22 Buffer Zone User Committee areas. We used ArcGIS 10.4 (Esri, USA) to generate maps showing the spatial distribution of human–tiger conflict cases (number of tiger attacks on people and numbers of livestock attacked) and tiger density. We only used the number of livestock killed in our analysis and did not evaluate the financial damage caused by livestock predation.
Results
Sampling effort and number of tigers captured
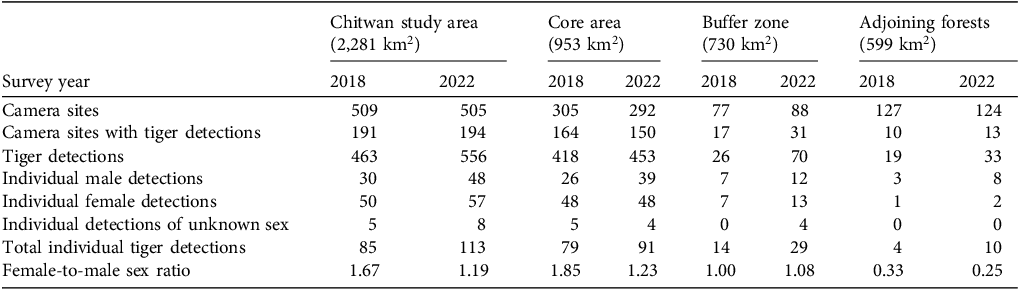
Camera traps were active for 8,433 trap-days in 2018 and 8,529 trap-days in 2022. Eighty-five individual tigers (30 males, 50 females, five of unknown sex) were recorded in 2018 and 113 (48 males, 57 females, eight of unknown sex) in 2022 (Table 1). In the core area, the number of female tigers remained the same (n = 48) but the number of male tigers increased from 26 to 39 between 2018 and 2022. In the buffer zone, the number of males increased from 7 to 12 and the number of females from 7 to 13. In the adjoining forest, the number of males increased from 3 to 8 and the number of females from 1 to 2. The female-to-male ratio decreased in the core area (from 1.85 to 1.23 females per male) and adjoining forests (from 0.33 to 0.25 females per male) but increased in the buffer zone (from 1.00 to 1.08 females per male) over the study period (Table 1).
Summary of camera-trap survey effort, tiger Panthera tigris detections and female-to-male sex ratio in the core area, buffer zone and adjoining forests of Chitwan National Park, Nepal, in 2018 and 2022. Cameras were deployed in pairs at each site. Some tigers were detected in more than one management zone. Individual tigers were identified from their unique stripe patterns.

Table 1 Long description
A table comparing camera-trap survey effort and tiger detections in Chitwan National Park, Nepal, across different zones and years. The table has 11 rows and 10 columns. Column headers are Survey year, Camera sites, Camera sites with tiger detections, Tiger detections, Individual male detections, Individual female detections, Individual detections of unknown sex, Total individual tiger detections, and Female-to-male sex ratio. Row labels are Chitwan study area (2,281 km^2), Core area (953 km^2), Buffer zone (730 km^2), and Adjoining forests (599 km^2). Each row label has data for the years 2018 and 2022. Row 1: Chitwan study area (2,281 km^2): Survey year: 2018, 2022; Camera sites: 509, 505; Camera sites with tiger detections: 191, 194; Tiger detections: 463, 556; Individual male detections: 30, 48; Individual female detections: 50, 57; Individual detections of unknown sex: 5, 8; Total individual tiger detections: 85, 113; Female-to-male sex ratio: 1.67, 1.19. Row 2: Core area (953 km^2): Survey year: 2018, 2022; Camera sites: 305, 292; Camera sites with tiger detections: 164, 150; Tiger detections: 418, 453; Individual male detections: 26, 39; Individual female detections: 48, 48; Individual detections of unknown sex: 5, 4; Total individual tiger detections: 79, 91; Female-to-male sex ratio: 1.85, 1.23. Row 3: Buffer zone (730 km^2): Survey year: 2018, 2022; Camera sites: 77, 88; Camera sites with tiger detections: 17, 31; Tiger detections: 26, 70; Individual male detections: 7, 12; Individual female detections: 7, 13; Individual detections of unknown sex: 0, 4; Total individual tiger detections: 14, 29; Female-to-male sex ratio: 1.00, 1.08. Row 4: Adjoining forests (599 km^2): Survey year: 2018, 2022; Camera sites: 127, 124; Camera sites with tiger detections: 10, 13; Tiger detections: 19, 33; Individual male detections: 3, 8; Individual female detections: 1, 2; Individual detections of unknown sex: 0, 0; Total individual tiger detections: 4, 10; Female-to-male sex ratio: 0.33, 0.25.
Population size and density
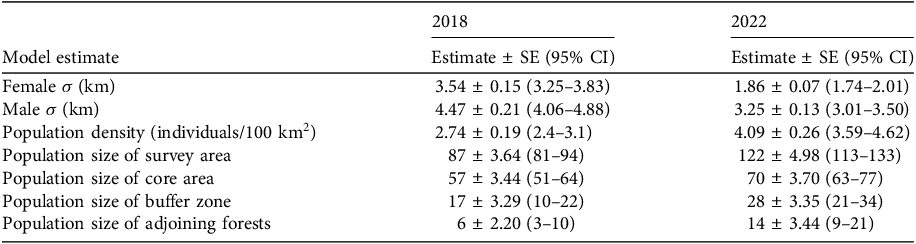
The Bayesian model fitted the data well for both study years (FT1, FT2, FT3, P = 0.3–0.6), and all Markov chains showed convergence. Population density increased from 2.74 (95% CI 2.4–3.1) in 2018 to 4.09 (95% CI 3.59–4.62) individuals/100 km2 in 2022 (posterior probability = 1; Table 2), giving population size estimates of 87 (95% CI 81–94) adult tigers in 2018 and 122 (95% CI 113–133) in 2022. The highest density of tigers occurred in the core area in both study years (Fig. 2), and population size increased significantly in the core area (P = 0.01), buffer zone (P = 0.02) and adjoining forests (P = 0.05). The female-to-male ratio declined from an estimated 2.39 (95% CI 1.78–3.00) females per male in 2018 to 1.49 (95% CI 1.14–1.92) females per male in 2022 (P = 0.016).
Model parameters for Bayesian spatial capture–recapture analysis of female, male and the overall population of tigers in Chitwan National Park, Nepal, in the core area, buffer zone and adjoining forests. The ranging scale parameter σ is interpretated as an index of home range size. We modelled a half-normal detection function (Royle et al., Reference Royle, Chandler, Sun and Fuller2013), where probability of detection at a distance (d) is defined as the function of distance between the trap and the individual’s activity centre, and the parameters p0 (probability of capturing an individual at a trap located exactly at its activity centre) and σ.

Table 2 Long description
The table presents model estimates for the population of tigers in Chitwan National Park, Nepal, for the years 2018 and 2022. It includes estimates for female and male tigers, population density, and population sizes in different zones. The table has 8 rows and 4 columns. Column headers are Model estimate, 2018, and 2022. Row labels include Female σ (km), Male σ (km), Population density (individuals/100 km²), Population size of survey area, Population size of core area, Population size of buffer zone, and Population size of adjoining forests. Each row provides estimates for the years 2018 and 2022, including standard error (SE) and 95% confidence intervals (CI). Notable trends include an increase in population density from 2.74 in 2018 to 4.09 individuals/100 km² in 2022, and an increase in population size in the core area, buffer zone, and adjoining forests.
Expected density of tigers Panthera tigris (individuals/km2) predicted from the Bayesian spatial capture–recapture model for the surveyed area in (a) 2018 and (b) 2022, including Chitwan National Park, the buffer zone and adjoining forests in Chitwan valley, Nepal. (Readers of the printed journal are referred to the online article for a colour version of this figure.)

Fig. 2 Long description
Panel A: A heat map showing the expected density of tigers in 2018. The map includes Chitwan National Park, the buffer zone, and adjoining forests in Chitwan valley, Nepal. The density is represented by a color scale ranging from light yellow (0.00-0.10 tigers/km²) to dark brown (0.51-0.60 tigers/km²). The map shows varying densities across the region, with higher densities concentrated in the central areas. Panel B: A heat map showing the expected density of tigers in 2022. Similar to Panel A, the map includes Chitwan National Park, the buffer zone, and adjoining forests in Chitwan valley, Nepal. The color scale is the same as in Panel A. The map indicates an increase in tiger density in some areas compared to 2018, with higher densities still concentrated in the central regions.
Ranging behaviour
We used the ranging scale parameter σ to assess adult tiger movements. Males ranged significantly further than females in both 2018 and 2022 (posterior probability = 1, Table 2), with greater uncertainty in their activity centres (Fig. 3). Movement range declined significantly during 2018–2022 for both sexes (posterior probability = 1). Based on the half-normal detection model (Royle et al., 2013), the estimated mean home range radius in 2018 was 10.95 (95% CI 9.95–11.96) km for males and 8.67 (95% CI 7.96–9.38) km for females. The home range radius was lower in 2022 for both males (mean 7.96, 95% CI 7.37–8.57 km) and females (mean 4.56, 95% CI 4.26–4.92 km).
Activity centre posterior distributions and capture locations for all camera-trapped adult female and male tigers in the 2018 and 2022 population surveys in the core area, buffer zone and adjoining forests in and around Chitwan National Park, Nepal. Female tigers had more detections and activity centres in the buffer zone during 2018–2022, whereas males had more detection events and activity centres outside the protected area. Activity centres represent the central point of an individual’s space use during a sampling period, similar to the centre of a home range, or the average location across repeated movements.

Human–tiger conflict
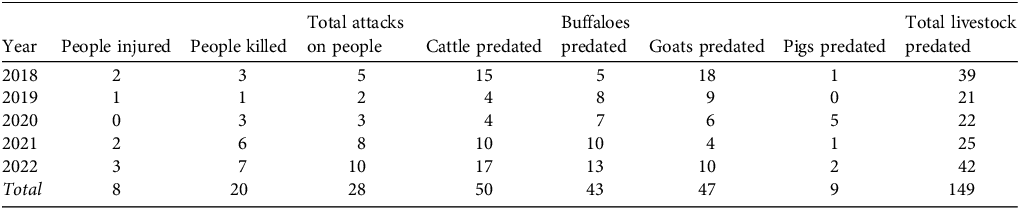
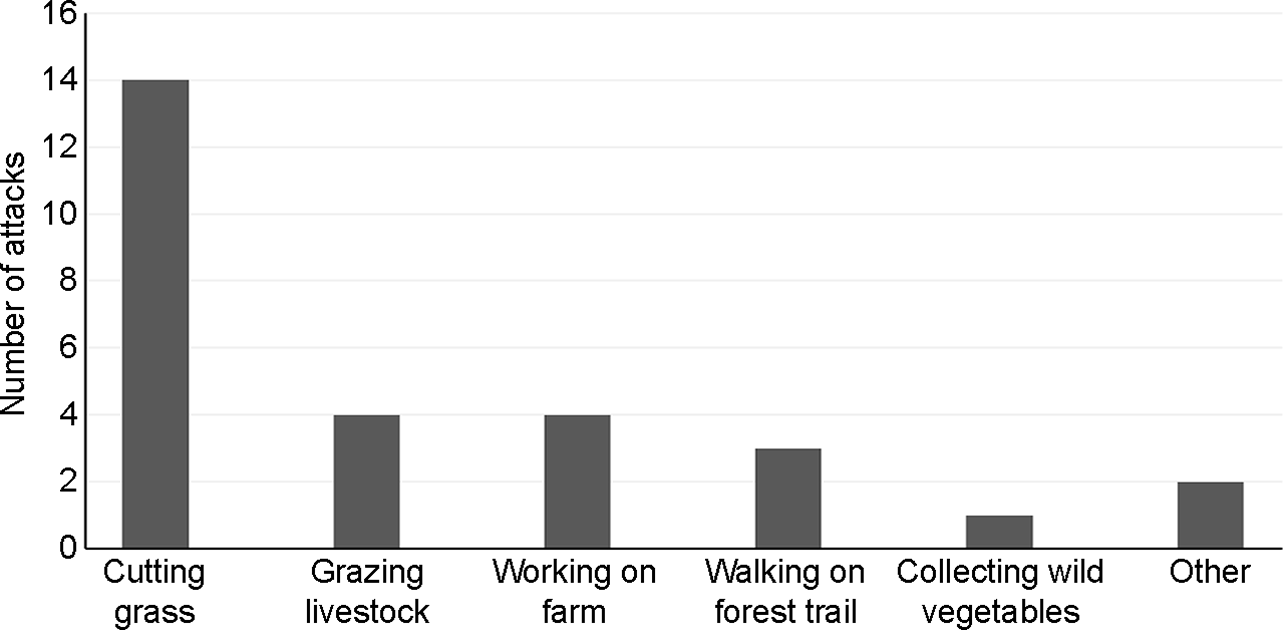
During 2018–2022 we documented 28 tiger attacks on people and 149 cases of livestock predation (Table 3). The frequency of attacks increased over the study period. Most tiger attacks on people occurred inside forests (24, 86%), affected men (21, 75%) and were fatal (20, 71%). The majority (64%) of the attacks occurred when local people were cutting grass or grazing livestock in the buffer zone community forests or riverine grasslands (Fig. 4). Livestock predation was highest in Lothar, Panchpandav, Rewa, Ayodhyapuri and Nirmal Thori Buffer Zone User Committee areas (Fig. 5). When the locations of attacks were overlaid on the 2022 tiger density map, attacks on people were found to occur near areas of high tiger density, but this was not the case for the locations of livestock depredation incidents.
Annual number of tiger attacks on people and number of livestock predations in the buffer zone of Chitwan National Park, Nepal, during 2018–2022 (source: Chitwan National Park Office, 2022).

Table 3 Long description
The table presents data on tiger attacks on people and livestock predation in the buffer zone of Chitwan National Park, Nepal, from 2018 to 2022. It has 6 rows and 8 columns. The columns are labeled Year, People injured, People killed, Total attacks on people, Cattle predated, Buffaloes predated, Goats predated, Pigs predated, and Total livestock predated. Row 1: 2018, 2, 3, 5, 15, 5, 18, 1, 39. Row 2: 2019, 1, 1, 2, 4, 8, 9, 0, 21. Row 3: 2020, 0, 3, 3, 4, 7, 6, 5, 22. Row 4: 2021, 2, 6, 8, 10, 10, 4, 1, 25. Row 5: 2022, 3, 7, 10, 17, 13, 10, 2, 42. Row 6: Total, 8, 20, 28, 50, 43, 47, 9, 149.
Number of tiger attacks on people carrying out different activities in the buffer zone of Chitwan National Park, Nepal, during 2018–2022.

Distribution of tiger attacks on people in 22 buffer zone user committee areas, and the number of livestock predations in the buffer zone of Chitwan National Park, Nepal, overlaid on the 2022 tiger density map estimated from camera-trap data.

Discussion
We found an increase in tiger population size and density across all three management zones in and around Chitwan National Park between 2018 and 2022. This may have been the result of increased prey availability as a result of habitat management in the core area, combined with effective law enforcement when illegal activities were identified by patrols, and a reduction in threats such as retaliatory killing following cases of human–wildlife conflict. For example, during 2018–2022 the Park managed > 1,100 ha of grasslands and maintained or created 200 waterholes to create a diverse habitat mosaic (CNP, 2025). The enhanced habitat quality contributed to an increase in prey density in the study area from 71 to 100 animals/km2 (DNPWC & DFSC, 2022). Additionally, poaching was reduced by daily patrols and frequent sweep operations during 2018–2022 (> 200 in total, increasing from 46 in 2018 to 65 in 2022; CNP, 2025), enhanced intelligence and community surveillance. The tiger population growth was predominantly an increase in the number of male tigers, resulting in a smaller female-to-male sex ratio. The female tiger population remained constant in the core area, although it increased in the buffer zone during 2018–2022. This suggests population saturation in the core area, whereas the improved habitat quality in the buffer zone supported more breeding females than previously. Human–tiger conflict increased over the study period, with attacks on people more frequent near areas with high tiger densities areas and cases of livestock predation distributed more widely in the buffer zone.
Spatial distribution and movement of tigers
The tiger population increased in the buffer zone forest, with the highest density occurring in the Rapti River floodplain grasslands and Barandabhar corridor forest eastwards. This may be a consequence of reduced levels of human activity together with improved habitat management and waterhole creation (CNP, 2025) providing additional habitat for the growing tiger population in the Chitwan valley.
Most of the forests in the buffer zone and adjoining areas are managed as community resources by local people. Along with forest products, these areas offer suitable habitat for tigers, and their numbers have more than doubled there over the study period. We believe that dispersal into the buffer zone and adjoining forests is a result of lower levels of intraspecific competition, favourable habitat created by the community forest programme (Chanchani et al., Reference Chanchani, Lamichhane, Malla, Maurya, Bista and Warrier2014), and an increase in prey populations, including ungulates (Solanki et al., Reference Solanki, Chalise and Sharma2018). Our results suggest that females dispersed to nearby forests in the buffer zone, where we detected nearly twice as many females in 2022 (n = 13) as in 2018 (n = 7). In contrast, males moved greater distances to adjoining forests outside the buffer zone, where detections increased between 2018 (n = 3) and 2022 (n = 8). Earlier research on tiger dispersal in Chitwan National Park (Smith, Reference Smith1993) found males dispersing further from their natal territories, whereas females establish territories close to their mother’s. A similar finding was reported in Panna National Park, Madhya Pradesh State in India, where reintroduced juvenile tigers dispersed into the buffer zone once territories inside the Park were occupied by adults (Kolipaka, Reference Kolipaka2018). The same study found that young adults of the second generation spent c. 40% of their time in buffer zones and frequented areas near villages, whereas mature adults from the first generation spent only c. 10% of their time in these areas.
The habitat quality of community-managed forests in the buffer zone and adjacent areas has improved as human disturbance has declined (Chanchani et al., Reference Chanchani, Lamichhane, Malla, Maurya, Bista and Warrier2014), with an increasing focus on ecotourism, such as the operation of jeep safaris, canoeing trips, forest walks and similar tourist activities, and the building of associated infrastructure such as new forest roads (Kandel et al., Reference Kandel, Harada, Adhikari, Kumar Dahal and Dhakal2020). To increase the probability of wildlife sightings, communities have actively managed grasslands and created waterholes within the community forests, supporting the recovery of both predator and prey populations. The threats from poaching and retaliatory killings in the buffer zone and adjacent areas have declined in recent years (DNPWC, 2016; Lamichhane et al., Reference Lamichhane, Pesoon, Leirs, Musters, Subedi and de Iong2017), with Chitwan National Park celebrating zero poaching during 2013–2015 (Acharya, Reference Acharya2016). The buffer zone and adjoining forests have an important role to play in sustaining future tiger populations.
In our study, male tigers moved longer distances than females, which is consistent with other studies on tiger ranging behaviour. In an earlier study in Chitwan, the mean dispersal distances of female and male tigers were 9.7 km (range 0.2–33.0 km) and 33 km (range 9.5–65.7 km), respectively (Smith, Reference Smith1993). An et al. (Reference An, Bohnett, Battle, Dai, Lewison and Jankowski2021) reported similar results, with female tigers restricting their distribution to a much smaller range than males and preferring areas with higher prey abundance. We found that tiger ranging distances and home range radius contracted for both males and females as population density increased, most probably because of increased prey availability (DNPWC & DFSC, 2022).
Sex ratio
Overall, the female-to-male sex ratio decreased as the tiger population size increased in Chitwan National Park and the surrounding landscape. There were, however, differences between the zones in our study, with the ratio decreasing in the core area and adjoining forests but increasing in the buffer zone. As population size increases, competition between males would be expected to increase, which may limit territory size and lead to an overall increase in adult males per unit area and a reduction in the female-to-male ratio (Miquelle et al., Reference Miquelle, Smirnov, Zaumyslova, Soutyrina and Johnson2015). The number of female tigers remained constant in the core area but increased in the buffer zone as the population size increased. However, both the female and male territory size (home range radius) decreased in the study area as the population grew, with further contraction of female territory size during the study period. Female territory size may have been constrained by the demands of raising cubs and the availability of prey species. More females moved into the buffer zone to establish territories where changes in habitat management supported greater numbers of prey. This indicates that although the core area may have reached carrying capacity for the tiger population, the surrounding forests could sustain more tigers if properly managed to improve the prey base. The buffer zone community forests have extended the available habitat for tigers as forest users have changed their behaviour by regulating resource collection and grazing to reduce human disturbance to wildlife and promote ecotourism activities (Kandel et al., Reference Kandel, Harada, Adhikari, Kumar Dahal and Dhakal2020).
Human–tiger conflict
As the number of tigers in the buffer zone increased, the chances of encounters with local people in the community forests also increased. More attacks on people occurred in areas with high tiger densities, although livestock predation was higher in areas with low tiger densities. Human casualties were higher amongst communities in the northern part of Chitwan National Park, where people are more dependent on forest resources, whereas communities in the southern buffer zone have greater livestock holdings (NSO, 2022). These local differences are likely to be important factors in the frequency of human–tiger conflict.
Intra-specific competition increases with tiger density, possibly resulting in territorial disputes that may cause injury and less dominant tigers being driven out of the prime habitat (Lamichhane et al., Reference Lamichhane, Pesoon, Leirs, Musters, Subedi and de Iong2017). In cases of injury, tigers may turn to easier prey such as livestock or people (Lamichhane et al., Reference Lamichhane, Pesoon, Leirs, Musters, Subedi and de Iong2017). This is supported by an earlier study in Chitwan National Park (Lamichhane et al., Reference Lamichhane, Pesoon, Leirs, Poudel, Subedi, Pokheral and de Iong2018), which showed that an increase in wildlife populations in the Park and numbers of people in the buffer zone led to an increase in human fatalities and injuries from wildlife.
The rising human population and increasing demands on forest resources are pushing wildlife, including tigers, closer to human settlements (Inskip & Zimmermann, Reference Inskip and Zimmermann2009). In Nepal, old and injured tigers are increasingly found in buffer zone forests near communities that legally access these areas to gather resources such as firewood, grass and fish (Lamichhane et al., Reference Lamichhane, Pesoon, Leirs, Musters, Subedi and de Iong2017). Increased overlap between people and tigers in buffer zones raises the risk of human casualties. We found most human–tiger conflict occurred in these buffer zones and habitat corridors, where human–tiger proximity is highest. In contrast, core areas have more tigers but restricted human access, and adjoining forests have more people but fewer tigers, both resulting in fewer cases of conflict.
Tiger density was estimated to be higher in the floodplain of Rapti River in the northern boundary area of the Park, but cases of livestock predation were proportionately higher alongside the southern boundary in the Panchpandav, Ayodhyapuri, Nirmal Thori and Rewa Buffer Zone User Committees areas, where agriculture and livestock farming were the mainstay of local people’s subsistence livelihoods (NSO, 2022). However, livestock predation was limited in the Mrigkunj and Budhirapti Buffer Zone User Committee areas located near the Sauraha tourism area, where people were involved in ecotourism activities that provide alternative sources of income (Kandel et al., Reference Kandel, Harada, Adhikari, Kumar Dahal and Dhakal2020).
Tiger population growth and implications for conservation planning
The camera-trap survey data documented an increase in the tiger population in and around Chitwan National Park during 2018–2022. This resulted in tiger dispersal from the core area to the buffer zone and into adjoining forests outside the protected area. We recommend that conservation management focuses on the Park’s buffer zone to improve its suitability for tigers. Female tigers occupied new territories in the buffer zone forests during 2018–2022 as the tiger population grew and expanded into new areas, and these females play a critical role in population recruitment. Overall, conservation efforts should focus on a landscape-level approach towards a healthier, intact ecosystem that sustains tigers, local communities and biodiversity in general (Smith et al., Reference Smith, McDougal, Gurung, Shrestha, Shrestha, Allendorf and Dhakal2010).
Tiger conservation is not limited to management activities within protected areas but operates across a complex of adjoining habitat types with different protection levels, including buffer zones and forest corridors (Bhatt et al., Reference Bhatt, Castley, Sims-Castley, Baral and Chauvenet2023). Long-term conservation of tigers and other large wildlife will depend on careful land-use planning and zoning of extensive conservation landscapes to include core habitat for wildlife, wildlife corridors, buffer zones and areas for local community use (Dinerstein et al., Reference Dinerstein, Rijal, Bookbinder, Kattel, Rajuria, Seidensticker and Christie1999). Habitat improvements through adaptive grassland management and waterhole maintenance can increase prey density, enabling more tigers to occupy these areas. As socio-economic conditions are associated with human–tiger conflict, efforts to uplift local economies through supporting and promoting new livelihood opportunities and reducing dependency on natural resources could mitigate conflict in future. Specifically, income from ecotourism could provide alternative livelihood options at a local level, making people less dependent on gathering resources from community forests and reducing the likelihood of human–tiger conflict, with positive outcomes for tiger conservation.
Author contributions
Study concept: HA, HdI, BRL; data analysis: HA, RA; writing and revision: all authors; supervision: HdI, HL.
Acknowledgements
We thank team members and stakeholders, including National Trust for Nature Conservation, WWF Nepal and Zoological Society of London, Nepal, who conducted tiger camera-trap surveys in our study area in 2018 and 2022; the Department of National Parks and Wildlife Conservation, Nepal, for permission to use the findings; Mahesh Neupane, Sitaram Phuyal and other staff of Chitwan National Park for their support in compiling human–tiger conflict data; and Dinesh Neupane of the Zoological Society of London, Nepal, for help in the early stages of drafting the manuscript. HA acknowledges support from the Leo Foundation in the Netherlands and the University of Antwerp, Belgium.
Conflicts of interest
None.
Ethical standards
This research abided by the Oryx guidelines on ethical standards. Research permission (No. 2126-079/080, Eco, 2079/10/29) and approval of data use (No. 561-080/081, Eco, 2080/05/22) were granted by the Department of National Parks and Wildlife Conservation, Kathmandu, Nepal, for camera-trap data from the national tiger survey. The research team met with relevant stakeholders including community representatives to describe the purpose and duration of the camera-trap research before initiating the formal survey. Any photographs of people inadvertently captured by camera traps were excluded from our analysis, and images were deleted to ensure personal privacy.
Data availability
Data are available from the corresponding author upon reasonable request.





 Open access

