The subgrade layer of road pavement often consists of natural/native soil. However, some naturally swelling or reactive clays have unfavourable properties (i.e. high swelling–shrinkage potential, high compressibility) that reduce the performance of the pavement system. High-plasticity clays, particularly smectite-rich clayey soils, undergo swelling as the moisture content increases and shrinking when subjected to drying, resulting in damage to construction works (Dafalla & Shamrani, Reference Dafalla, Shamrani, Moyo, Ooi, Zhai and Myers2011; Negawo et al., Reference Negawo, Di Emidio, Bezuijen, Verastegui Flores and François2019). Most stevensite-rich magnesian clay deposits of economic interest are located in Morocco, Turkey, Spain, China and the USA (Pozo & Calvo, Reference Pozo and Calvo2018). Deposits of montmorillonite-rich aluminous clays are more widespread. The world’s main sodium montmorillonite production area is located in the states of Wyoming, Montana and South Dakota, USA (Murray, Reference Murray2006).
In north-eastern Morocco, expansive soils, mainly montmorillonite-rich clay soils known as ‘bentonite’, are widespread and often cause considerable problems in construction works (Ajbary et al., Reference Ajbary, Santos, Morales-Flórez and Esquivias2013; Aalaoul et al., Reference Aalaoul, Azdimousa and El Hammouti2015; Ouakkass et al., Reference Ouakkass, Ouadif, Bahi and Akhssas2019; Oumnih et al., Reference Oumnih, Bekkouch, Gharibi, Fagel, Elhamouti and El Ouahabi2019). Stevensite-rich clay containing small amounts of quartz, dolomite and gypsum also occurs (Benhammou et al., Reference Benhammou, Tanouti, Nibou, Yaacoubi and Bonnet2009). Stevensite-rich clays occur in large amounts in north-east Morocco in the Moulouya Valley region (Benhammou et al., Reference Benhammou, Tanouti, Nibou, Yaacoubi and Bonnet2009), in Japan (Imai et al., Reference Imai, Otsuka, Nakamura and Tsunashima1970) and in many other countries, such as Australia, Greece, England and the USA (Christidis & Mitsis, Reference Christidis and Mitsis2006; Burne et al., Reference Burne, Moore, Christy, Troitzsch, King, Carnerup and Hamilton2014; El Idrissi, Reference El Idrissi2016). The clay has been used in natural cosmetic products (soap, shampoo, skin conditioner) and as a detergent (Santaren, Reference Santaren, Pozo and Galan2015), and it develops good rheological properties at high temperatures (Christidis et al., Reference Christidis, Athanasakis and Marinakis2024).
Bentonite is formed by diagenetic or hydrothermal alteration of pyroclastic and/or volcanoclastic acid rocks (Christidis & Huff, Reference Christidis and Huff2009). Stevensite-bentonite is of diagenetic origin, formed by the transformation of lacustrine dolomite in silica-rich, low-CO2 conditions in freshwater to brackish, dolomitic lake environments (Trauth, Reference Trauth1977; Duringer et al., 1983). These two types of smectite-rich clays have been formed in saline solutions of pH ∼7.5 for montmorillonite (bentonite; Hay & Guldman Reference Hay and Guldman1987; Christidis & Dunham, Reference Christidis and Dunham1997; Modabberi et al., Reference Modabberi, Namayandeh, Setti and López-Galindo2019) and of pH ∼9.4 for stevensite (Tokarský, Reference Tokarský2018).
The specific surface area (AS), also commonly referred to as the SSA, of bentonite varies between 50 and 130 m2 g–1, and its cation-exchange capacity (CEC) ranges from 84.7 to 88.9 cmol(+) kg–1 (Kaufhold et al., Reference Kaufhold, Dohrmann, Klinkenberg, Siegesmund and Ufer2010; Daou et al., 2011). For stevensite-bentonite, the SSA values vary from 104 to 137 m2 g–1 (Bejjaoui et al., Reference Bejjaoui, Benhammou, Nibou, Tanouti, Bonnet, Yaacoubi and Ammar2010; Tokarský, Reference Tokarský2018) and CEC varies from 75 to 85.4 cmol(+) kg–1 (Benhammou et al., Reference Benhammou, Tanouti, Nibou, Yaacoubi and Bonnet2009; Ajbary et al., Reference Ajbary, Santos, Morales-Flórez and Esquivias2013; Tokarský, Reference Tokarský2018). The slightly higher CEC values of bentonite suggest that it has greater catalytic activity than stevensite-bentonite.
Lime treatment proceeds through both chemical and physical mechanisms. Chemically, lime reacts with clay minerals to form calcium silicate hydrates (C-S-H), calcium aluminate hydrates (C-A-H) and other cementitious compounds that bind clay particles together, reducing the soil’s plasticity and increasing its shear strength (Al-Mukhtar et al., Reference Al-Mukhtar, Khattab and Alcover2012). Furthermore, lime treatment can modify the mineralogy of clay, leading to the transformation of swelling clay minerals into more stable forms (Fondjo et al., Reference Fondjo, Theron and Ray2021). While much research has been conducted on the stabilization of montmorillonite-rich clays, the behaviour of stevensite-rich clays under lime treatment remains less studied. Stevensite-bentonite contains a high proportion of stevensite, a magnesium-rich smectite mineral that exhibits different reactivity from montmorillonite.
The aim of this study is to compare the reactivity of two smectite-rich bentonites in an alkaline medium rich in Ca2+ ions. This research investigates the chemical, mineralogical and microstructural transformations induced by lime treatment, with a particular focus on the formation of new cementitious phases. This study is focused on the distinct reactivity of montmorillonite and stevensite/saponite under lime stabilization, which has not been extensively investigated in the literature previously. Moreover, this work provides a comprehensive assessment of the impact of lime treatment on the mechanical properties of these clays, including their compressive strength. By contrasting the performance of these two smectite types, the study offers further insights into their potential applications in construction and soil stabilization, advancing our understanding of stabilization mechanisms for clays with various smectite compositions.
Materials and methods
Materials
The raw materials used in this study originate from Morocco. They include stevensite-bentonite and bentonite, both smectite-rich clays, and aerial lime serves as the stabilizing agent. The stevensite-bentonite was sampled from the Missour deposit (north Morocco), and the bentonite was sampled from the Trebia deposit in the Nador region (north-east Morocco). The aerial lime, obtained by traditional calcination of local dolomitic limestone, was purchased at a local market in Oujda (north-east Morocco).
The preparation of the clay-lime mixtures involved the following steps:
• To achieve a uniform particle size, the clay and lime samples were ground and sieved to <250 µm.
• Lime was added to the clay at predetermined proportions (e.g. 2 wt.%, 8 wt.%, 10 wt.%, etc.), and the components were manually mixed in a dry state to ensure a uniform distribution. Distilled water was gradually added to the mixture while continuously stirring to obtain a homogeneous paste. The solid/liquid ratios were 60 and 46 vol.% for the stevensite-bentonite and bentonite mixtures, respectively. The addition of lime to clay soils activates the development of pozzolanic reactions, forming C-A-S-H hydrates that ensure the cementation of clay grains, thus improving the mechanical properties and stabilization of clay soils, particularly those rich in swelling clays such as smectites.
• The prepared mixtures were then moulded into cylindrical specimens for mechanical testing. The specimens were 3.1 cm in diameter and 6.2 cm in thickness.
• The specimens were stored in airtight containers until further chemical and mineralogical analyses.
• After 28 days of curing, uniaxial compressive strength tests were performed in accordance with the ASTM D1621 standard (ASTM, 2023). The 28 day hydration period – a standard timeframe in studies on cementitious materials – was used, which is commonly adopted in construction and soil stabilization practices.
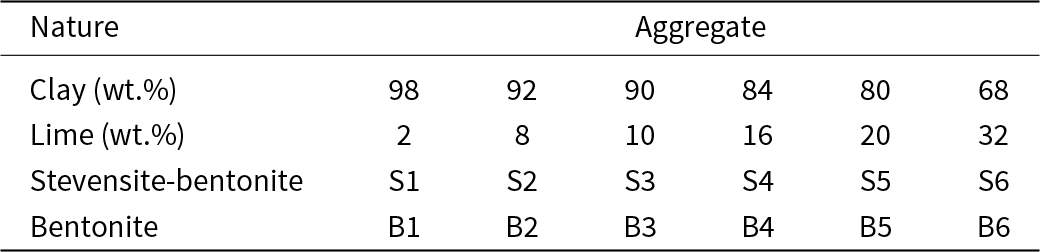
Details regarding the formulation quantities are reported in Table 1. The selection of clay-lime mixture ratios was based on previous studies (Kumar et al., Reference Kumar, Dutta and Mohanty2014; Vitale et al., Reference Vitale, Deneele, Paris and Russo2017).
Nature and amounts of aggregates.

Analytical methods
The bulk mineralogical composition of the raw clays, lime and their mixtures was determined by X-ray diffraction (XRD) using random powder samples, which were prepared by front-loading into aluminium holders to minimize the preferred orientation. Prior to XRD analysis, all samples were oven-dried for 12 h and ground to <250 µm. A Shimadzu XRD-6100 diffractometer (Shimadzu Corp., Japan) was employed, using Cu-Kα radiation (λ = 1.54 nm), fixed slits (divergence slit (DS) = 0.05 mm, receiving slit (RS) = 0.3 mm and anti-scatter slit (SS) = 0.5 mm) and Soller collimators (2.5° on both incident and diffracted beams). A graphite flat-crystal monochromator was installed on the diffracted beam, and a scintillation counter detector (operating in θ-θ scan mode) was used. The scanning range was 2–70°2θ, with a step size of 0.004° and a scan speed of 0.004° s–1. The mineral phases present were identified using HighScore Plus software (version 4.9) with the Crystallography Open Database (COD).
The chemical composition of the raw clays was obtained on fused beads by X-ray fluorescence (XRF) using Rh-Kα radiation with a ARL Perform X’4200 XRF spectrometer (ThermoFisher Corporation, USA) capable of analysing elements from F to U. The clay samples were oven-dried at 105°C for 24 h, then ground, sieved to <250 µm and heated to 1000°C for 3 h to determine the loss on ignition (LOI). The LOI was calculated by subtracting the mass of the sample after ignition from the initial mass of the clay sample. For elemental composition analysis, 0.7 g of fired clay was mixed with 0.1 g of lithium nitrate and 6.0 g of a 50/50 flux (comprising lithium tetraborate, lithium metaborate and lithium bromide). The mixture was fused at 1000°C for 5 min using a Claisse TheOx Advanced instrument, cooled and cast into glass beads, which were analysed using the XRF spectrometer.
Fourier-transform infrared (FTIR) spectroscopy was used to determine the chemical bonds of the raw clays, lime and the mixtures using an FTIR spectrometer (FTIR-4700, (JASCO, Lisses, France) in the attenuated total reflectance (ATR) mode, equipped with a DLaTGS detector and Peltier temperature controller. Rapid 10 Hz scans with a resolution of 0.4 cm−1 were acquired over a wavelength range of 400–4000 cm−1 (Faculty of Sciences, Mohammed First University, Morocco).
Thermogravimetric (TG) analysis and differential thermal analysis (DTA) were performed on the raw clays, lime and the mixtures using a Shimadzu DTG-60 apparatus (Japan). Samples of 30 mg were heated at a rate of 10 K min–1 from 25°C to 1000°C using Pt80Rh20 thermocouples and Pt80Rh20 crucibles with lids. An empty crucible with a lid was used as a reference. The oven atmosphere was maintained with an inert gas (N2; Emmerich, Reference Emmerich2011).
The microstructures of the cured specimens were examined using a scanning electron microscope (SEM; TESCAN Vega3, Czech Republic) coupled with an energy-dispersive X-ray spectrometer (EDS; BRUKER XFlash 6/30 detector). The SEM operated at an acceleration voltage of 20 kV, a working distance of 10 mm and a beam current of 0.13 nA. The resolution was 3.5 nm, with magnifications up to ×100 000. Both secondary electron (SE) and backscattered electron (BSE) detectors were used under high vacuum (1 mbar). The EDS parameters included a resolution of 129 eV, an acquisition time of 60 s per point and a live time of 30 s, with data processing performed using QUANTAX ESPRIT software. Samples were mounted on aluminium stubs using conductive carbon tape and coated with a ∼15 nm-thick carbon layer using an Agar Turbo Carbon Coater.
The compressive strength of the cured specimens was measured using a TESTWELL device with a speed of 0.5 mm min–1 and a capacity of 10 kN. The test consists of applying an increasing vertical force to the flat surface of the cylindrical specimens until failure occurs.
The particle-size distribution was analysed by dry sieving, using a stack of sieves ranging from 63 µm to 2 mm for 60 min.
Results
Physicochemical characterization of the raw materials
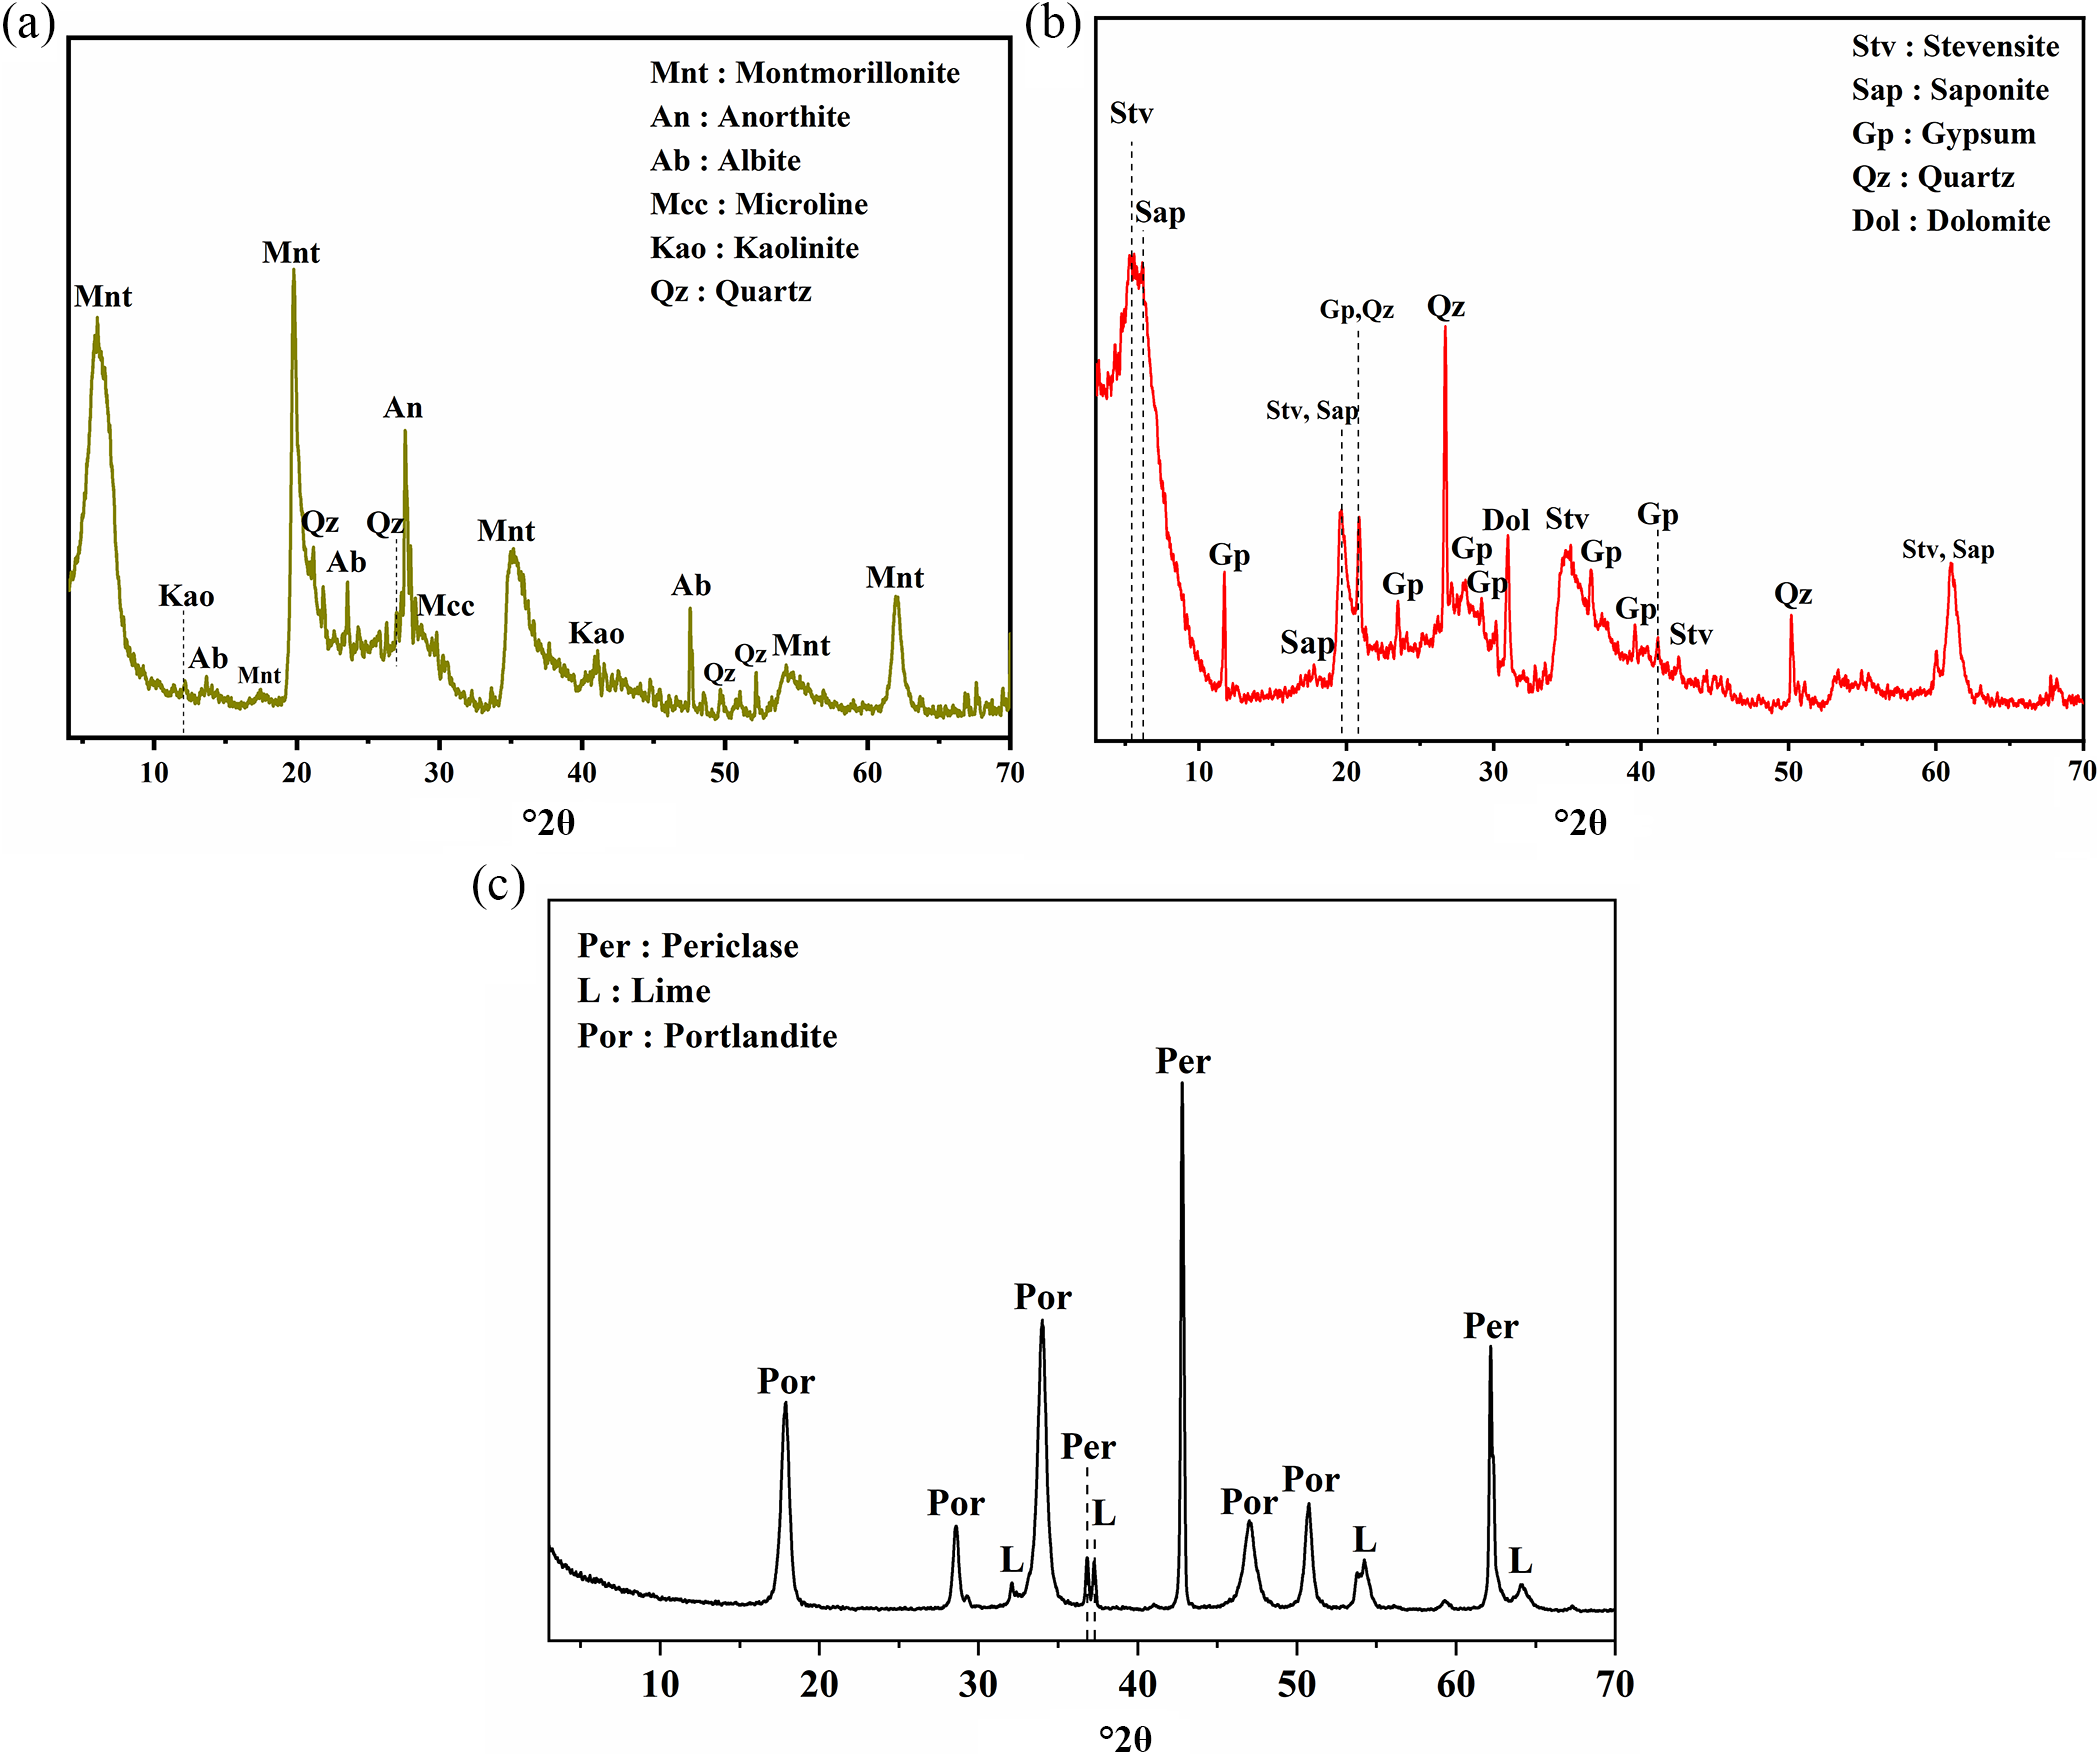
The XRD trace of bentonite shows the presence of montmorillonite (Ca-Mnt, PDF#00-013-0135; Na-Mnt, PDF#00-013-0259), kaolinite (Kao, PDF#00-014-0164), albite (Ab, PDF#00-019-1184), microcline (Mce, PDF#01-076-0826), quartz (Qz, PDF#00-033-1161) and anorthite (An, PDF#00-018-1202) (Fig. 1a). The XRD trace of stevensite-bentonite displays a broad peak at d = ∼15.54 Å, attributed to stevensite (Stv, PDF#00-025-1498) and saponite (Sap, PDF#00-013-0086), along with accessory phases such as gypsum (Gp, PDF#00-033-0311), dolomite (Dol, PDF#00-036-0426) and quartz (Qz, PDF#00-033-1161) (Fig. 1b). The XRD trace of the lime sample indicates the presence of lime (L, PDF#00-037-1497), periclase (Per, PDF#00-045-0946) and portlandite (Por, PDF#00-044-1481) (Fig. 1c). This lime sample corresponds to aerial lime, characterized by a high quicklime (CaO) content and the absence of silicates. Upon hydration, it will form portlandite (Ca(OH)2), which hardens very slowly through carbonation, reacting with atmospheric carbon dioxide (CO2) to produce calcite (CaCO3).
XRD traces of (a) bentonite, (b) stevensite-bentonite and (c) lime.

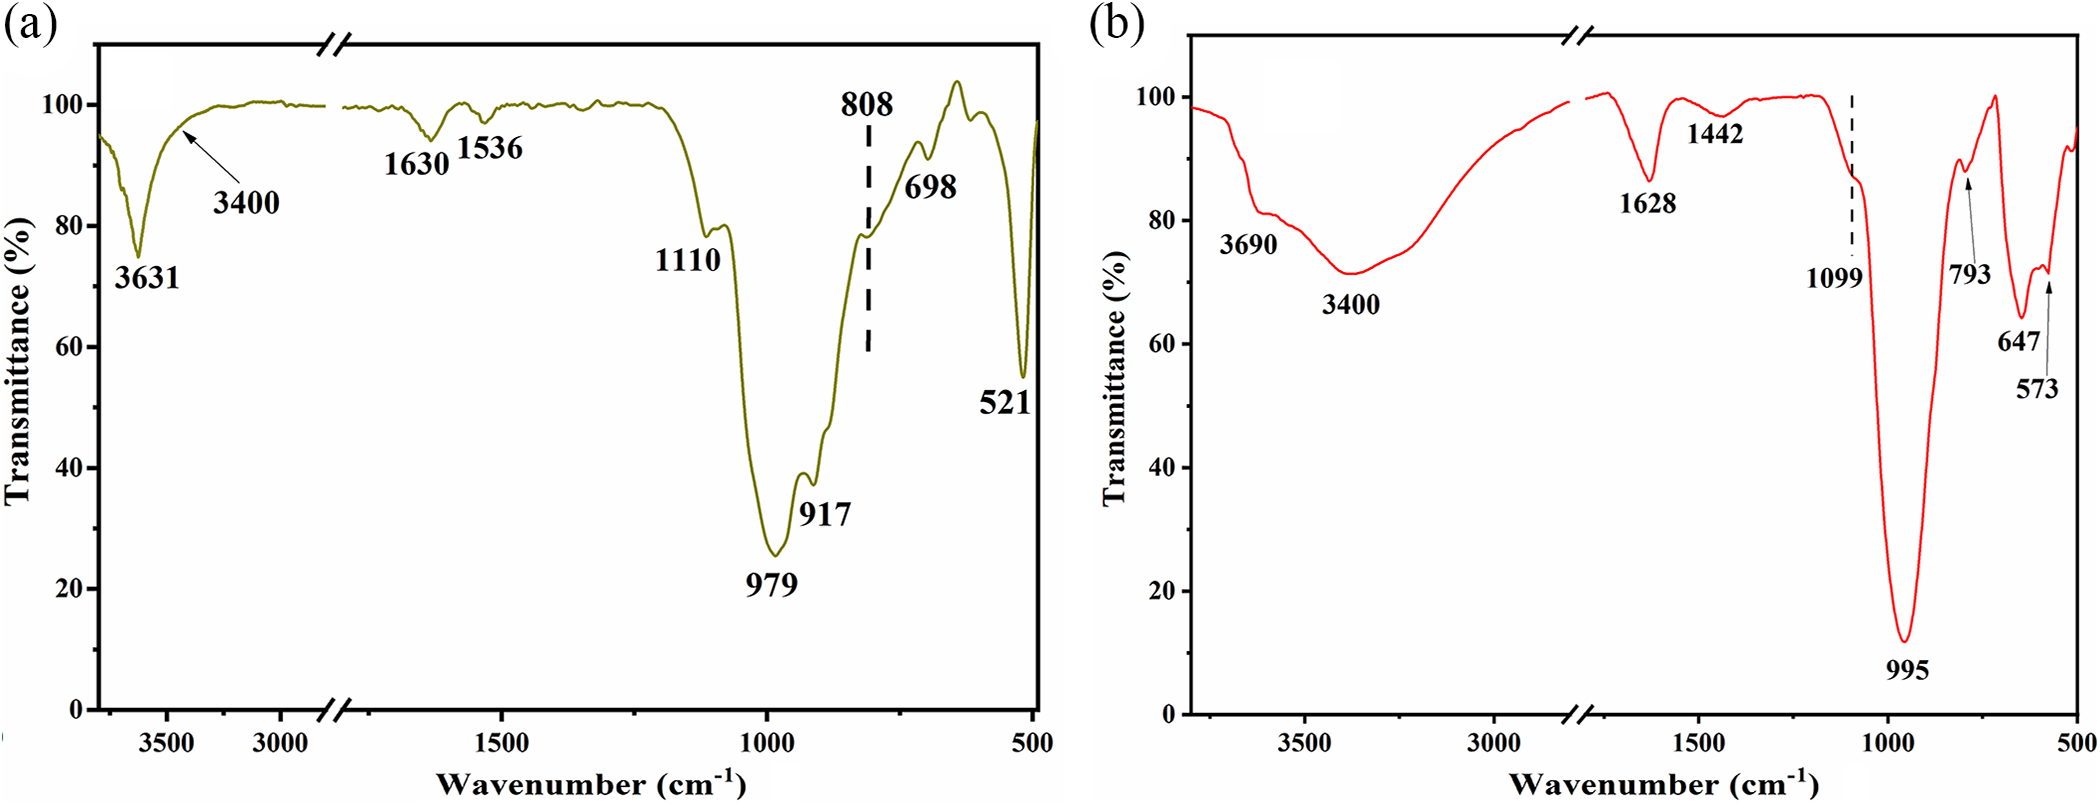
The FTIR spectrum of bentonite (Fig. 2a) shows an absorption band at 3631 cm–1 due to the stretching vibrations of the Al(Mg)–OH group (Sumner, Reference Sumner1999). This band apparently encompasses another band, which should appear at ∼3400 cm–1, corresponding to the stretching vibrations of the adsorbed water molecules. The two bands at 1630 and 1536 cm–1 are related to the OH bending vibrations of water adsorbed in the interlayer space of montmorillonite (Zviagina et al., Reference Zviagina, McCarty, Środoń and Drits2004; Krupskaya et al., Reference Krupskaya, Novikova, Tyupina, Belousov, Dorzhieva and Zakusin2019). The bands at 1110 and 979 cm–1 are attributed to the stretching vibrations of Si–O and Si–O–Si bonds, respectively (Zviagina et al., Reference Zviagina, McCarty, Środoń and Drits2004; Krupskaya et al., Reference Krupskaya, Novikova, Tyupina, Belousov, Dorzhieva and Zakusin2019). The Al–Al–OH and Fe–Al–OH bending vibration bands are observed at 918 and 808 cm–1. The Al–O–Si and Si–O–Si deformation vibrations are observed at ∼520 and 467 cm–1, respectively (Tokarský, Reference Tokarský2018; Krupskaya et al., Reference Krupskaya, Novikova, Tyupina, Belousov, Dorzhieva and Zakusin2019).
FTIR spectra of (a) bentonite and (b) stevensite-bentonite.

The FTIR spectrum of stevensite-bentonite (Fig. 2b) shows a band at 3690 cm–1 attributed to the stretching vibrations of the M–OH (M = Fe, Al or Mg) of the smectite octahedra (Gastaldi et al., Reference Gastaldi, Canonico and Boccaleri2009; Ait Hmeid et al., Reference Ait Hmeid, Akodad, Baghour, Moumen, Skalli and Azizi2021). The broad band at 3396 cm–1 is due to the stretching vibrations of adsorbed water molecules in the interlayer space. The band at 1628 cm–1 can be attributed to the deformation of the hydroxyl group of the physisorbed water molecule on smectite (Moraes et al., Reference Moraes, Bertolino, Cuffini, Ducart, Bretzke and Leonardi2017). The stretching vibrations of the Si–O–Si bond are observed at 1099 and 995 cm–1. The band at 793 cm–1 is attributed to the stretching vibration of the Si–O bond in quartz. The band at 647 cm–1 corresponds to the stretching vibrations of the Mg–O–Si bond (Brindley & Kikkawa, Reference Brindley and Kikkawa1979). The 573 cm–1 band can be attributed to the strain band of the Al–O–Si bond (Qiao et al., Reference Qiao, Liu, Zhang and Wu2019).
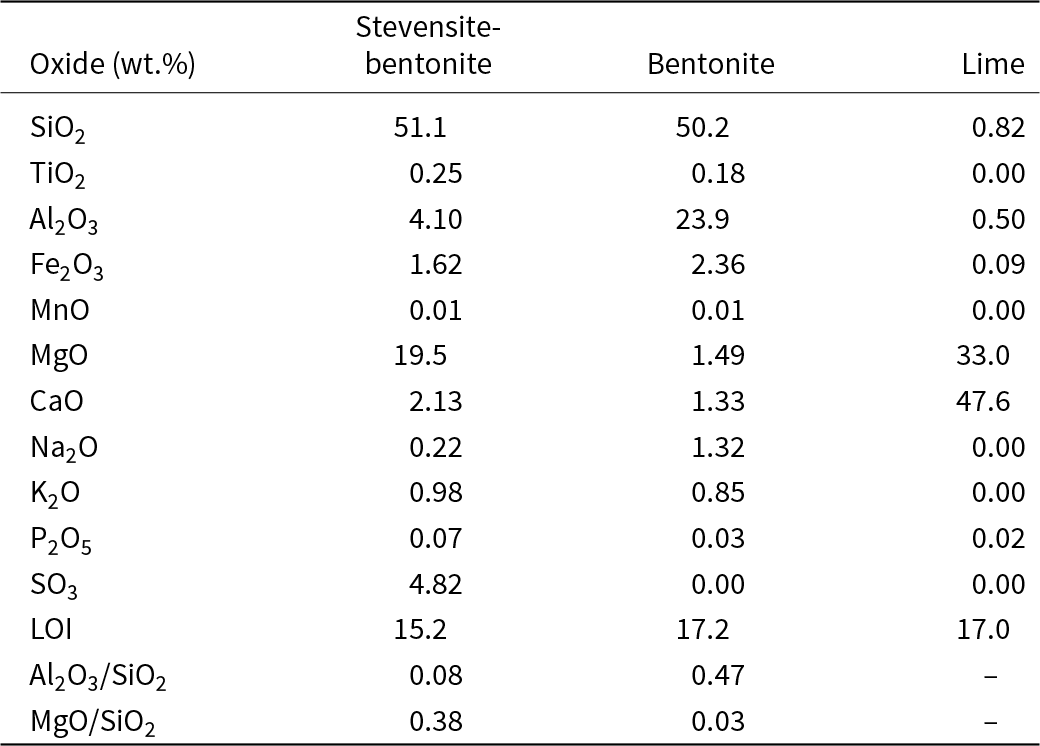
The Al2O3/SiO2 ratio is higher in bentonite, which consists of Na-Ca-montmorillonite, compared to stevensite-bentonite (Table 2). In contrast, the MgO/SiO2 ratio is highest in stevensite-bentonite, which is mainly composed of stevensite/saponite. The lime used has a high magnesium oxide content (33 wt.% MgO).
Chemical composition of raw materials.

LOI = loss on ignition at 1000°C for 2 h.
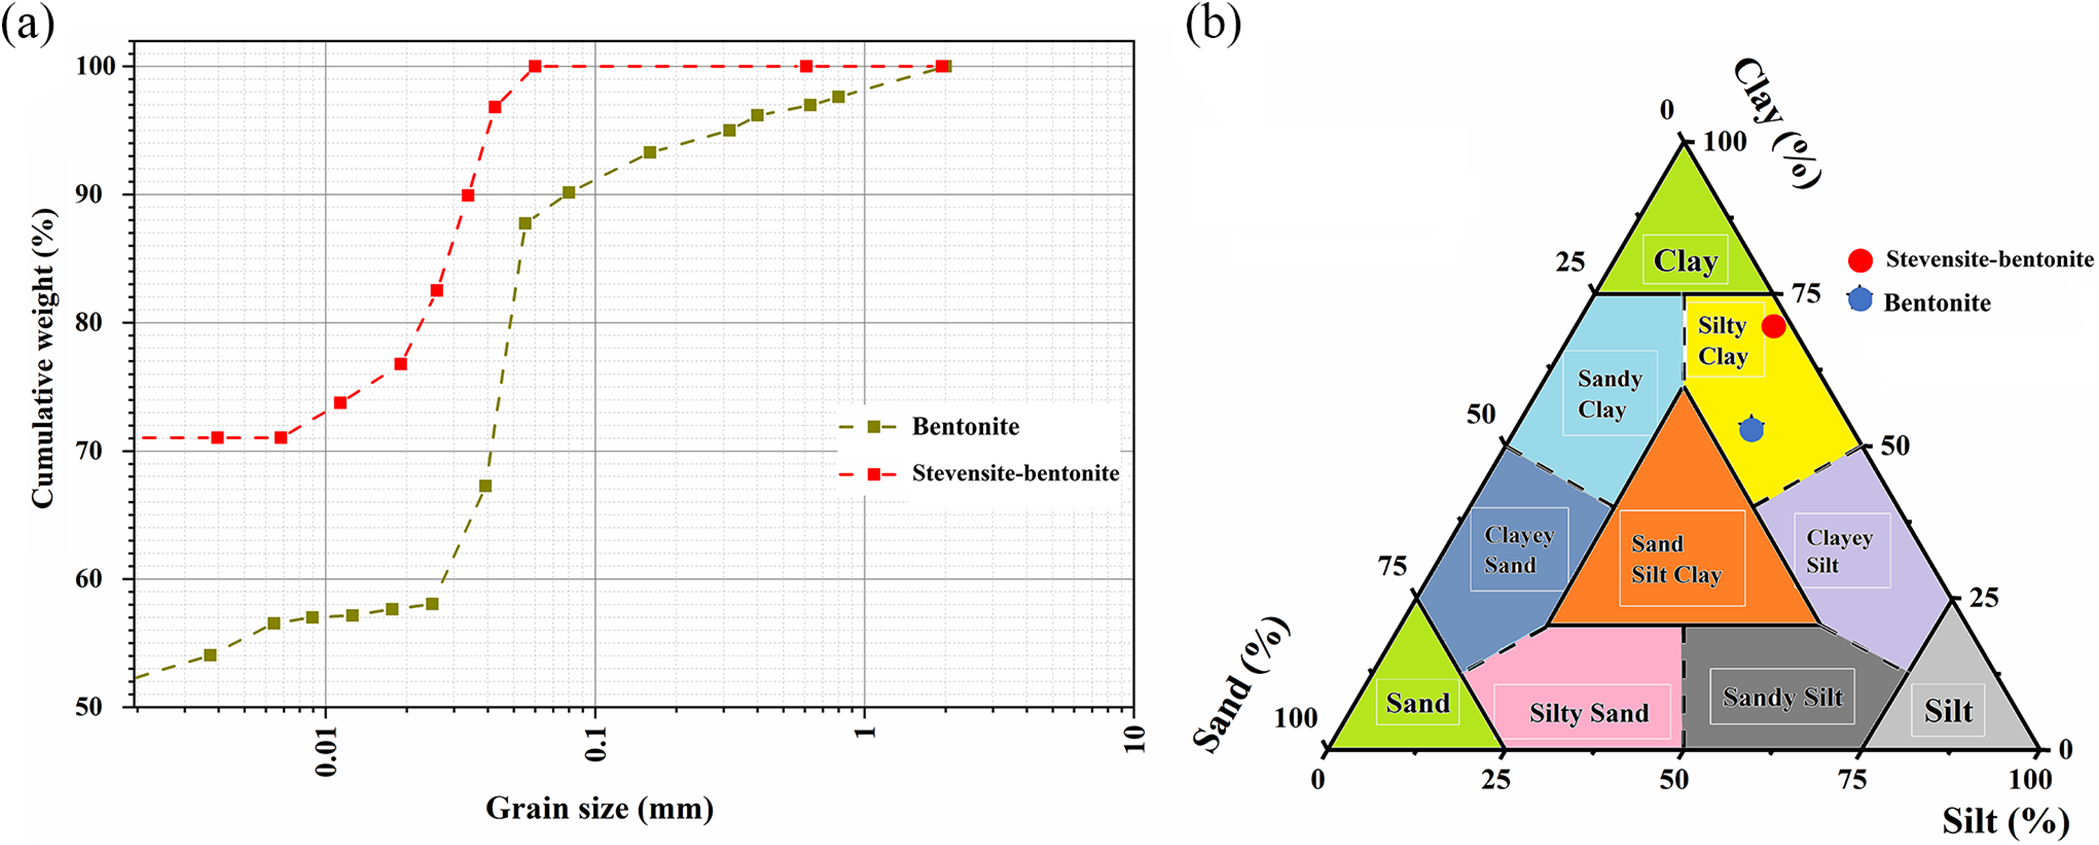
Figure 3 presents the grain-size distributions of bentonite and stevensite-bentonite. Bentonite consists of 54 wt.% clay, 35 wt.% silt and 11 wt.% sand, whereas stevensite-bentonite contains 70 wt.% clay, 28 wt.% silt and 2 wt.% sand. According to Shepard’s (Reference Shepard1954) classification, both materials can be characterized as silty clays (Fig. 3b).
(a) Grain-size distribution for bentonite and stevensite-bentonite and (b) classification of clay raw materials studied based on the sand–silt–clay content (Shepard, Reference Shepard1954).

Microstructures of the raw clays
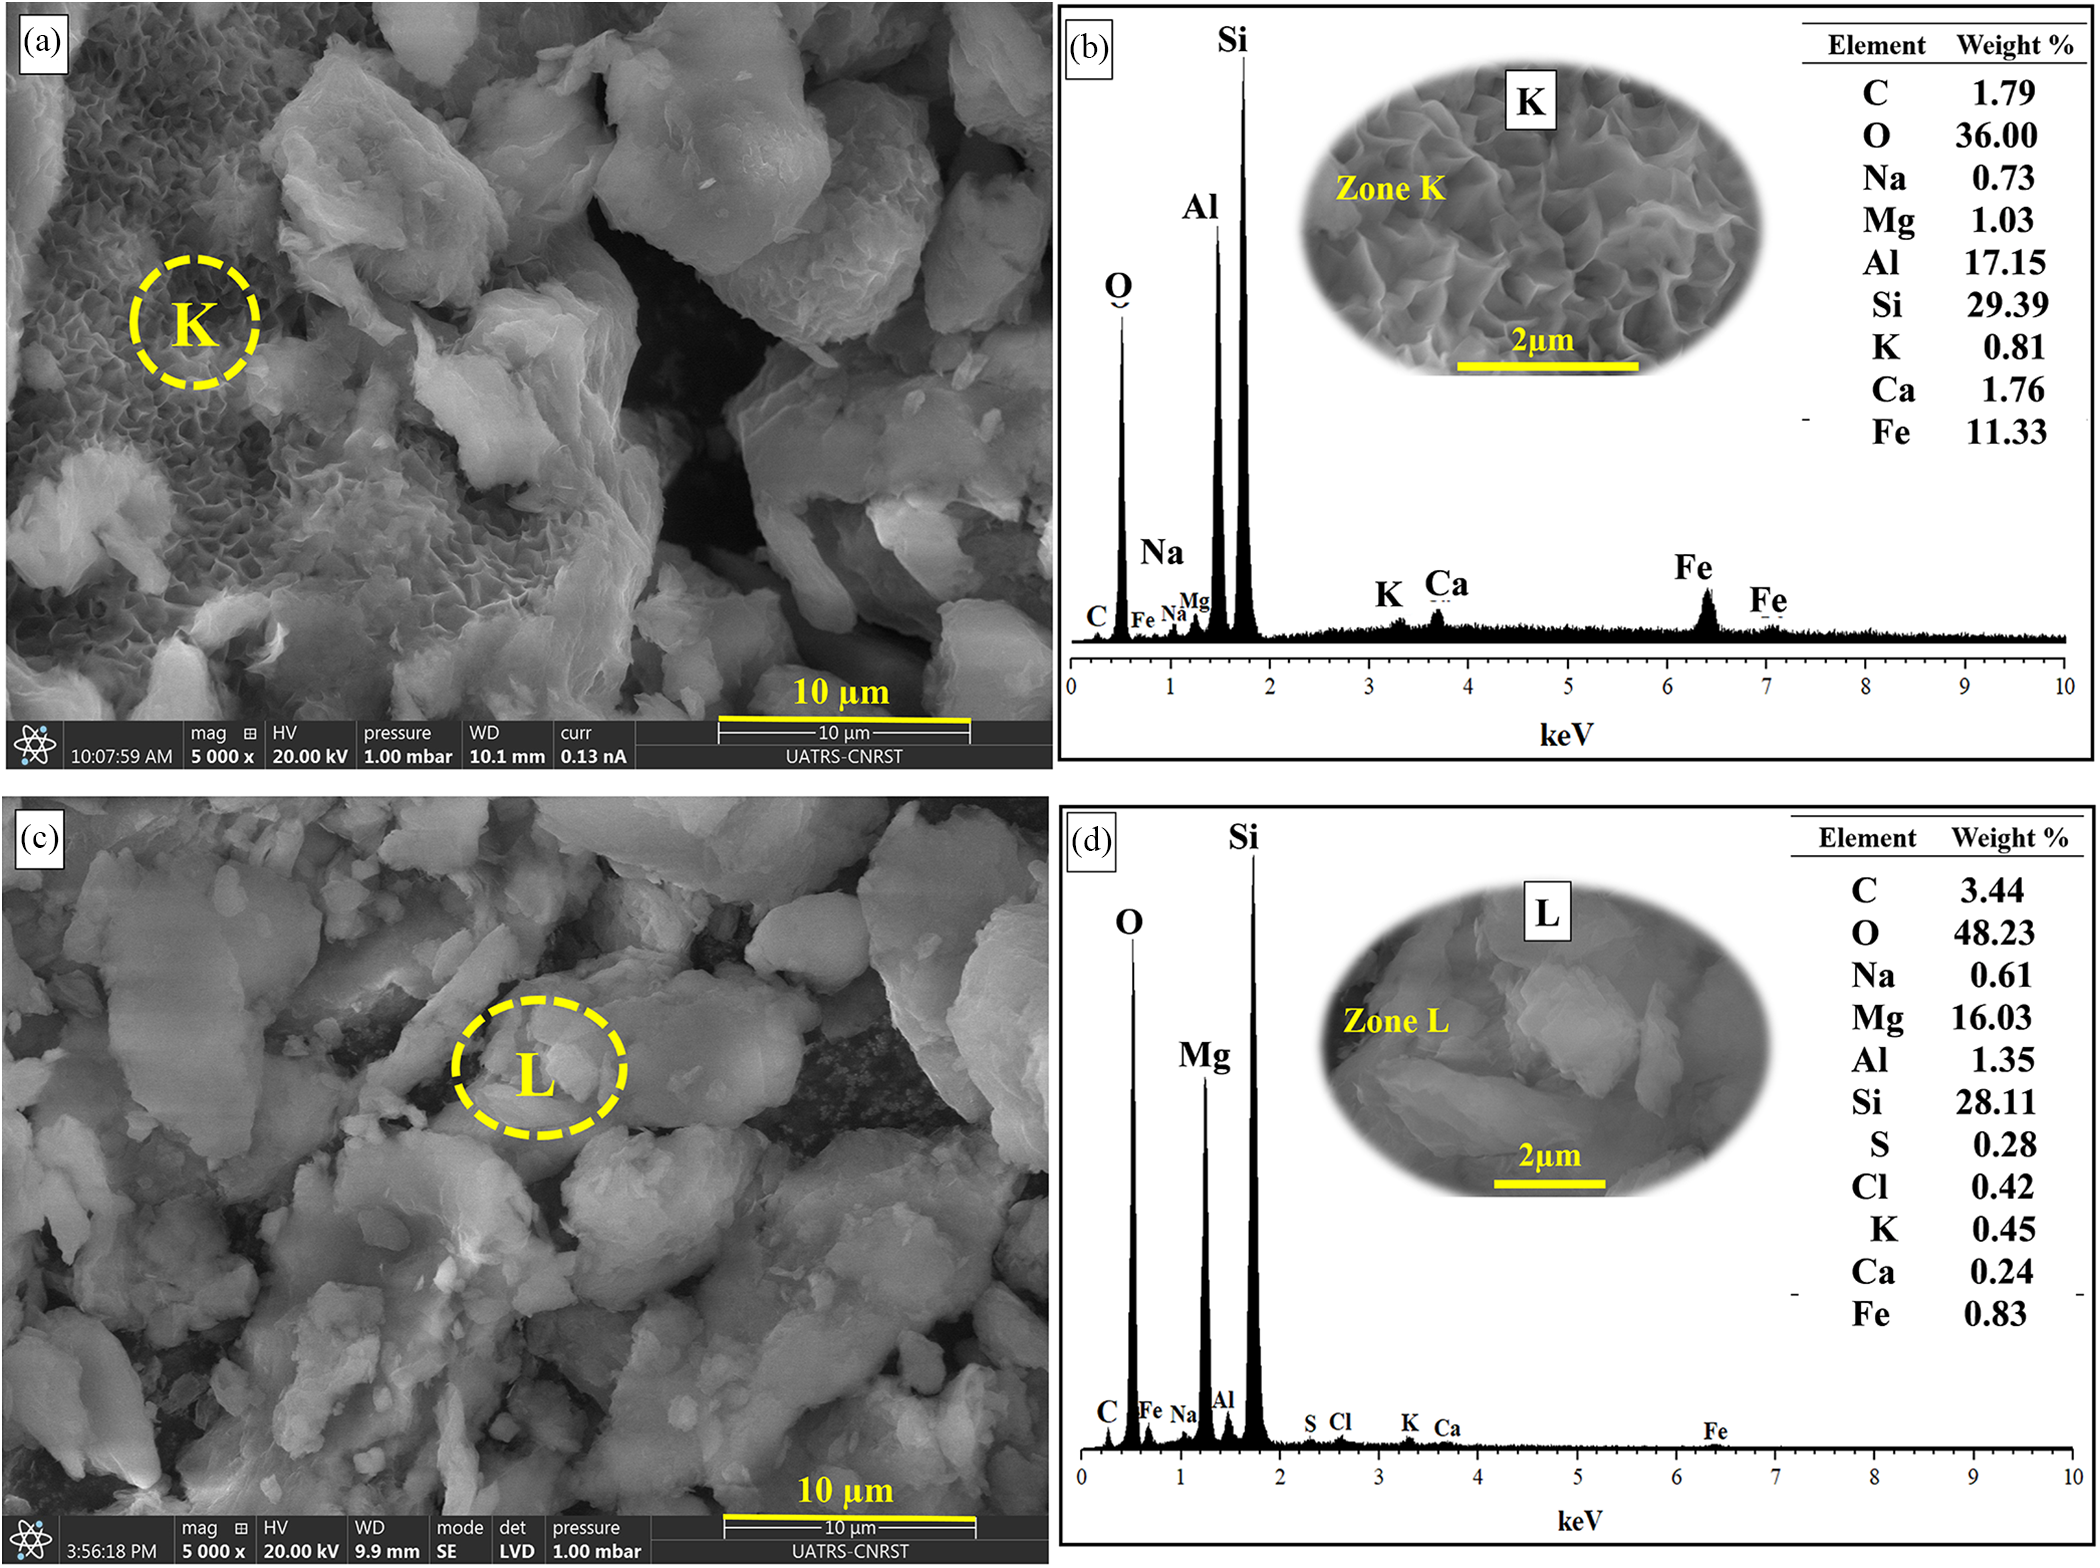
The SEM images of bentonite (Fig. 4a) display an irregular morphology characterized by flaky platelets stacked together in agglomerates, ranging in diameter from 85.7 to 14.3 µm, which is typical of smectites (Ahmad et al., Reference Ahmad, Kamal and Al-Harthi2018). A spongy texture, also characteristic of smectite grains, is observed. The EDS results (Fig. 4b, zone K) show the occurrence of Na, Mg, Al, Si, K, Ca and Fe. The presence of iron and magnesium may result from the substitution of aluminium from montmorillonite.
(a & c) SEM images and (b & d) EDS results of bentonite and stevensite-bentonite.

The stevensite-bentonite image (Fig. 4c) shows stevensite grains with an average size of between 5 and 2 µm. The structural formula of stevensite was calculated based on the chemical composition reported by Stevens (Reference Stevens1945), assuming the presence of four water molecules (4H2O). EDS analysis (Fig. 4d, zone L) gives a gross formula of (Ca0.02Na0.1K0.046)(Al0.2Fe0.06Mg2.66)Si4O10(OH)2.4H2O, which is close to Ca0.2Mg2.9Si4O10(OH)2.4H2O as reported previously for stevensite (Shimoda, Reference Shimoda1971). The differences in the calculated formulae are attributed to an underestimation of alkali and alkaline earth elements by EDS analysis. The occurrence of sulphur corresponds to gypsum, as indicated by the XRD results.
Physicochemical, morphological and thermal characterization of the cured mixtures
Mineralogical and thermal characteristics
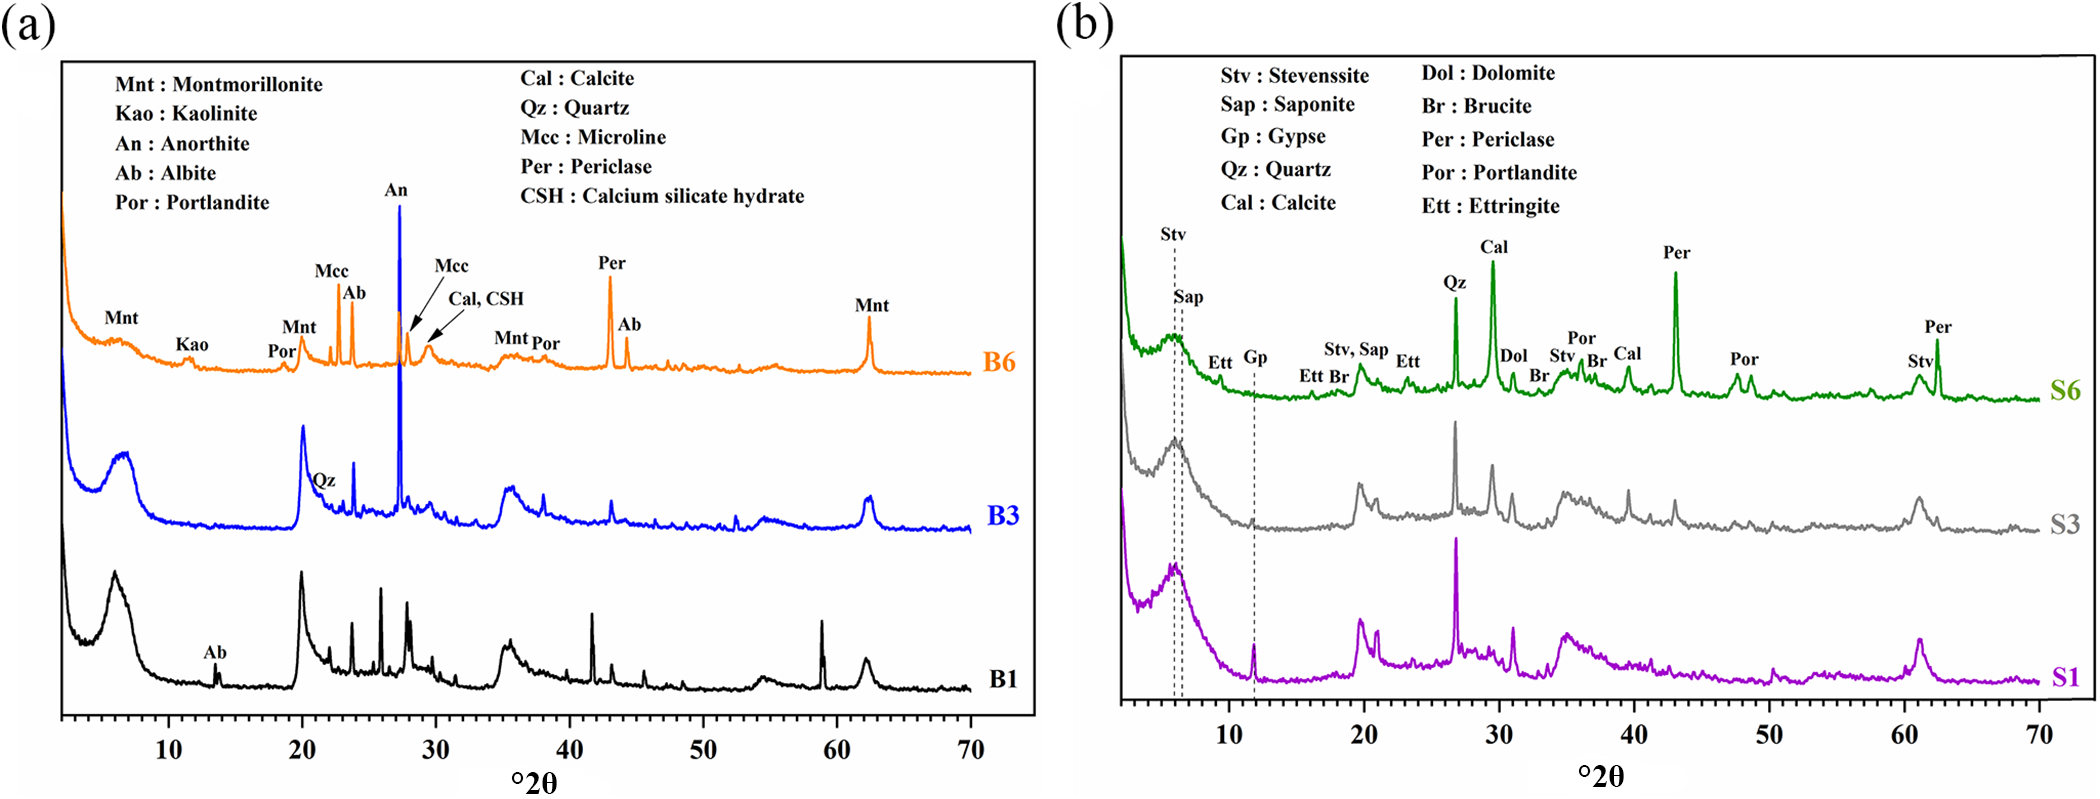
The XRD traces of the bentonite-lime B1, B3 and B6 mixtures after 28 days of hydration (Fig. 5a) show a decrease in the intensity of the characteristic montmorillonite peaks and the formation of C-S-H gel. C-A-H was probably formed through the following three reactions (Equations 1–3; Sondi et al., Reference Sondi, Bišćan and Pravdić1996):
 \begin{equation}\text{Ca}{\left({\text{OH}} \right)_\text{2}}\ {\text{\to}}\ \text{C}{\text{a}^{\text{2 + }}} + \text{2}\left(\text{{OH}} \right)^-\end{equation}
 \begin{equation}\text{C}{\text{a}^{\text{2 + }}} + {\text{ }}\text{2}{\left(\text{{OH}} \right)^ - } + {\text{ }}\text{Si}{\text{O}_\text{2}}\left(\text{{soluble{\text{ }}clay{\text{ }}silica}} \right)\ {\text{\to}}\ \text{C-S-H}\end{equation}
 \begin{equation}\text{C}{\text{a}^\text{{2 + }}} + {\text{ }}\text{O}{\text{H}^-} + {\text{ }}\text{A}{\text{l}_2}{\text{O}_3}\left(\text{{soluble{\text{ }}clay{\text{ }}alumina}} \right)\ {\text{\to}}\ \text{C-A-H}\end{equation}
(a) XRD traces of samples B1, B3 and B6 and (b) XRD traces of samples S1, S3 and S6.

The C-S-H formation is achieved by: (1) OH– ions being released from lime that attack the tetrahedral silicate sheets of montmorillonite to form siloxane species (SiO5/2–; Q3); (2) dissolution of Q3 tetrahedra, which are characteristic of phyllosilicates, as Q0 tetrahedra; and (3) dissolved silica diffusing into the pore solution and forming Q1 tetrahedra, which are characteristic of sorosilicates, as C-S-H with OH– ions and lime (Monnin, Reference Monnin2005). The formation of cemented C-S-H gels changes the state from a Q3 environment to Q1 and Q2 environments, being characteristic of the sorosilicates and inosilicates (Trauth, Reference Trauth1977). Q0, Q1, Q2 and Q3 tetrahedral configurations reflect the polymerization of silicon-oxygen tetrahedra: Q0 indicates isolated tetrahedra, Q1 denotes single connections, Q2 denotes chains and Q3 denotes sheets. When the amount of lime added is low (samples B1 and B3), it is completely consumed and portlandite does not form. Portlandite results from the hydration of lime in the presence of a significant amount of lime (32 wt.%, sample B6) and the neoformation of calcite through the reaction of hydrated lime with carbon dioxide from the air, according to Equation 4 (Ponce-Antón et al., Reference Ponce-Antón, Ortega, Zuluaga, Alonso-Olazabal and Solaun2018):
 \begin{equation}\text{Ca}(\text{OH})_\text{2} + \text{CO}_\text{2}\ {\text{\to}}\ \text{CaCO}_\text{3} + \text{H}_\text{2}\text{O}\end{equation}
The XRD traces of stevensite-bentonite mixed with lime (samples S1, S3 and S6) after 28 days of hydration show the reflections of stevensite at 5.697, 19.581 and 35.308°2θ, which remain unchanged (Fig. 5b). Calcite is formed in the specimens containing low lime contents (10 wt.%, sample S3), probably via a reaction between the aerial lime with carbon dioxide from the air according to Equation 4.
Furthermore, the intensity of the reflection of gypsum at 20.72°2θ (11.58°) gradually decreases with increasing amounts of lime added (samples S1 and S3). With 32 wt.% lime (sample S6), gypsum disappears and an ettringite (Ca6Al2(SO4)3(OH)12.26H2O) peak appears at 15.78°2θ (9.09°; Solanki et al., Reference Solanki, Zaman and Kazmiruk2012). The stevensite-bentonite contains aluminium (Table 2), and the XRD traces show the presence of gypsum, both of which are necessary to form ettringite. When lime is added in sufficient amounts, ettringite forms according to Equation 5 (Palou et al., Reference Palou, Kuzielová, Žemlička, Novotný and Másilko2018):
 \begin{align}& \text{6C}{\text{a}^{\text{2 + }}} + {\text{ }}\text{2Al}{\left(\text{{OH}} \right)_\text{4}^-} + {\text{ }}\text{4O}{\text{H}^-} + {\text{ }}\text{3S}{\text{O}_4}^{2-}\nonumber\\
&\quad + {\text{ }}\text{26}{\text{H}_\text{2}}\text{O}\ {\text{\to}}\ \text{C}{\text{a}_\text{6}}{\left( {\text{Al}{{\left( \text{OH} \right)}_\text{6}}} \right)_\text{2}}.{\left( {\text{S}{\text{O}_\text{4}}} \right)_\text{3}}.\text{26}{\text{H}_\text{2}}\text{O}\end{align}
The peak of periclase (MgO) at 43.02°2θ becomes more intense as the amount of added lime increases. The periclase detected by XRD, which has a very slow hydroxylation rate in water (Le Rouzic, Reference Le Rouzic2014), may result from the added MgO-rich lime (Table 1). The amount of calcite increases with the addition of lime. The increase in secondary calcite may also result from de-dolomitization of the dolomite (reflection peak at 30.94°2θ; Lanas et al., Reference Lanas, Bernal, Bello and Alvarez2006). During the de-dolomitization reaction, dolomite crystals react with hydroxide ions from the portlandite dissolved in the binder, causing decomposition of crystals and the formation of intergrown calcite and brucite according to Equation 6 (Štukovnik et al., Reference Štukovnik, Bosiljkov and Marinšek2020):
 \begin{equation}\text{CaMg}{\left( {\text{C}{\text{O}_3}} \right)_2} + {\text{ }}\text{C}{\text{a}^{2 + }} + {\text{ }}\text{2O}{\text{H}^-}\ {\text{\to}}\ \text{2CaC}{\text{O}_3} + {\text{ }}\text{Mg}{\left( \text{OH} \right)_2}\end{equation}
Chemical characteristics
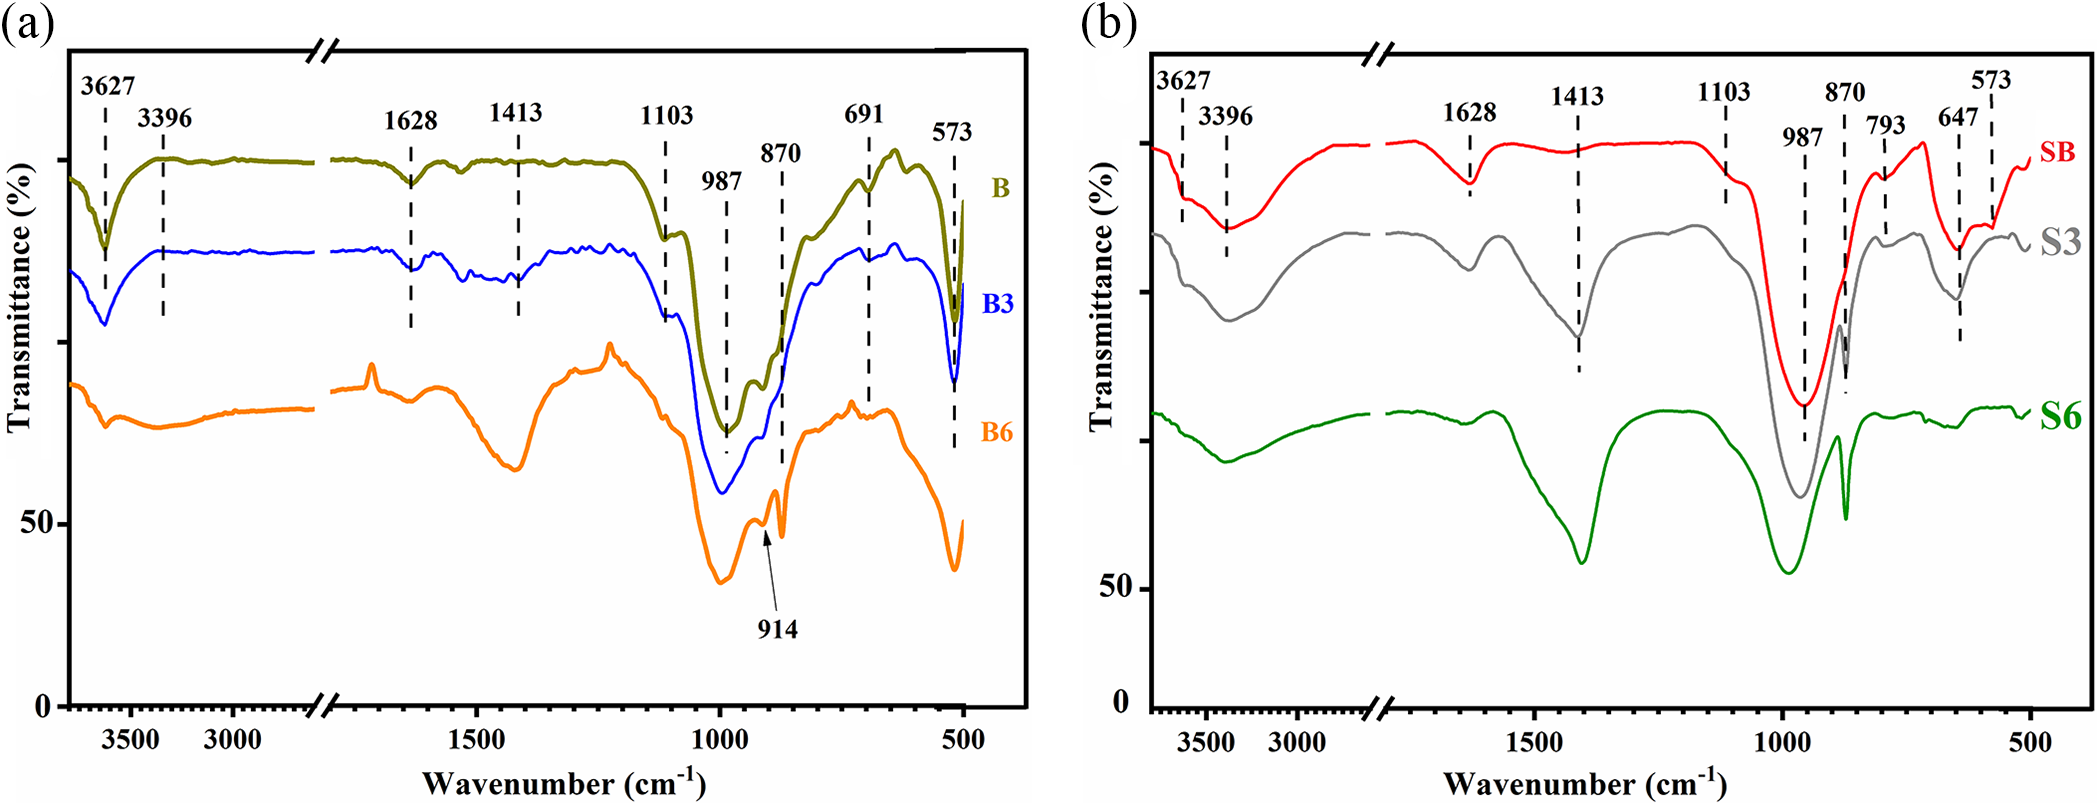
The FTIR spectrum of bentonite shows a broad adsorption band at 3700–3600 cm–1 due to the stretching vibrations of structural OH (Fig. 6a; Qiao et al., Reference Qiao, Liu, Zhang and Wu2019). The addition of 10 wt.% lime to bentonite (sample B3) does not affect these bands. However, the B6 mixture shows the appearance of 1413 and 870 cm–1 bands due to the symmetrical and asymmetrical vibrations of the carbonate group CO32– (Yu et al., Reference Yu, Lei, Cheng and Zhao2004), which confirms the formation of calcite as shown by XRD (Fig. 5a). The appearance of the band at ∼3396 cm–1 is due to Ca–OH stretching vibrations, which may correspond to excess slaked lime (Gastaldi et al., Reference Gastaldi, Canonico and Boccaleri2009; Acevedo et al., Reference Acevedo, Rocha and Bertolino2017). The absence of this band in sample B3 is due to the total consumption of the added lime by pozzolanic reactions, which is in accordance with the XRD results (Fig. 5a).
FTIR spectra of (a) bentonite (B) samples B3 and B6 and (b) stevensite-bentonite (SB) samples S3 and S6.

Addition of 10 wt.% lime to stevensite-bentonite (sample S3; Fig. 6b) results in the appearance of characteristic bands at 870 and 1430 cm–1, corresponding to the symmetric and asymmetric vibrations of the C–O bond, thereby confirming the presence of calcite in the sample (Yu et al., Reference Yu, Lei, Cheng and Zhao2004). These bands become more intense with increasing lime content (from samples S3 to S6).
Thermal analysis
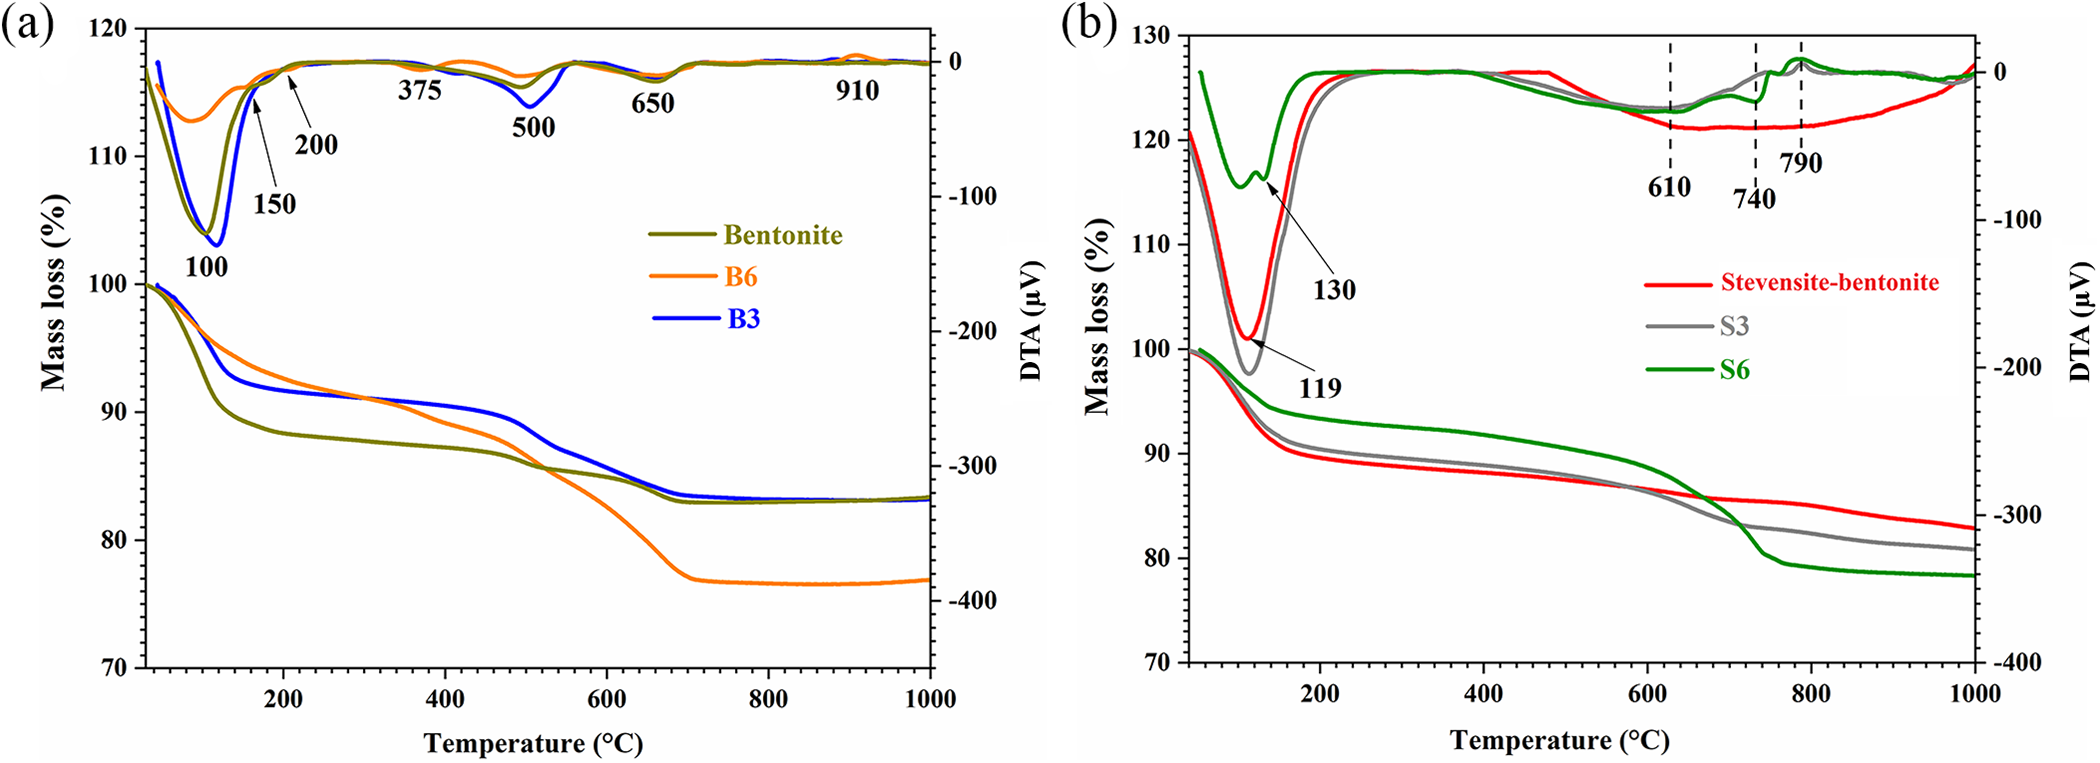
The DTA/TG analysis of the bentonite and the mixtures B3 and B6, prepared from bentonite mixed with 10 and 32 wt.% lime, respectively (Fig. 7a), shows a double peak at ∼110°C and 130°C, which can be attributed to the dehydration of smectite (Dietel et al., Reference Dietel, Gröger-Trampe, Bertmer, Kaufhold, Ufer and Dohrmann2019). For mixtures B3 and B6, the double peak can also be assigned to water adsorbed by the hydrates C-S-H and ettringite (Fares et al., Reference Fares, Remond, Noumowé and Cousture2011). The peak, centred at 100°C, and the mass loss are more pronounced for sample B3 than for sample B6, which may be more consistent with the volatilization of zeolitic water in the case of sample B3. The mass losses between 25°C and 250°C are 11.98, 8.64 and 8.25 wt.% for bentonite and samples B3 and B6, respectively. For sample B6, a weak endothermic peak is observed at 375°C, with a mass loss of 3.52 wt.%, which can be attributed to the dehydration of C-S-H (Zarzuela Sánchez et al., Reference Zarzuela, Luna, Martínez, Yeste, Garcia-Lodeiro and Blanco-Varela2020).
(a) DTA/TG analysis curves of bentonite and samples B3 and B6 and (b) DTA/TG analysis curves of stevensite-bentonite and samples S3 and S6.

An endothermic peak at ∼500°C appears on the DTA of bentonite and samples B3 and B6, with mass losses of 1.51, 3.08 and 3.63 wt.%, respectively. This is due to the dehydroxylation of montmorillonite (Hassan & Abdel-Khalek, Reference Hassan and Abdel-Khalek1998; Sumner, Reference Sumner1999) and kaolinite (Harrou et al., Reference Harrou, Gharibi, Nasri and El Ouahabi2020) and to the dehydroxylation of portlandite in samples B3 and B6 (Sha et al., Reference Sha, O’Neill and Guo1999).
The endothermic peak at ∼650°C in samples B3 and B6, with respective mass losses equal to 3.7 and 7.7 wt.%, is due to the decomposition of the C-S-H cemented gel into a new form of belite (β-Ca2SiO4; Wang et al., Reference Wang, Yan and Han2011) and to the decomposition of the neoformed calcite. For bentonite, the mass loss between 550°C and 1000°C of ∼2.02 wt.% corresponds to the final decomposition of the silane (de Carvalho Costa et al., Reference de Carvalho Costa, Melo and Paskocimas2013).
For the stevensite-bentonite specimens S3 and S6, mixed with 10 and 32 wt.% lime, respectively (Fig. 7b), the endothermic peak observed at 119°C can be attributed to the dehydration of stevensite (Dietel et al., Reference Dietel, Gröger-Trampe, Bertmer, Kaufhold, Ufer and Dohrmann2019). This peak is split for sample S6 at 130°C, suggesting the presence of ettringite in the mixture. The two peaks could also be assigned to the dehydration of the gypsum (Engbrecht & Hirschfeld, Reference Engbrecht and Hirschfeld2016). The mass losses between 25°C and 250°C are 10.91, 10.10 and 7.14 wt.% for stevensite-bentonite and samples S3 and S6, respectively.
From 650°C onwards, a loss of mass due to the decarbonation of calcite is observed. This loss is 11.45 wt.% for sample S6 and 6.44 wt.% for sample S3 (Fig. 7b). There is no evidence of any endothermic peaks associated with the decomposition of the C-S-H gel. For stevensite-bentonite, the mass loss (4.21 wt.%) is due to the decomposition of dolomite starting at 750°C (Gunasekaran & Anbalagan, Reference Gunasekaran and Anbalagan2007).
Microstructures of the mixtures
For microstructural analysis, the mixtures contained 2, 10 and 32 wt.% lime, allowing for the monitoring of the effect of lime on the stability of the two clays.
Bentonite-lime mixtures
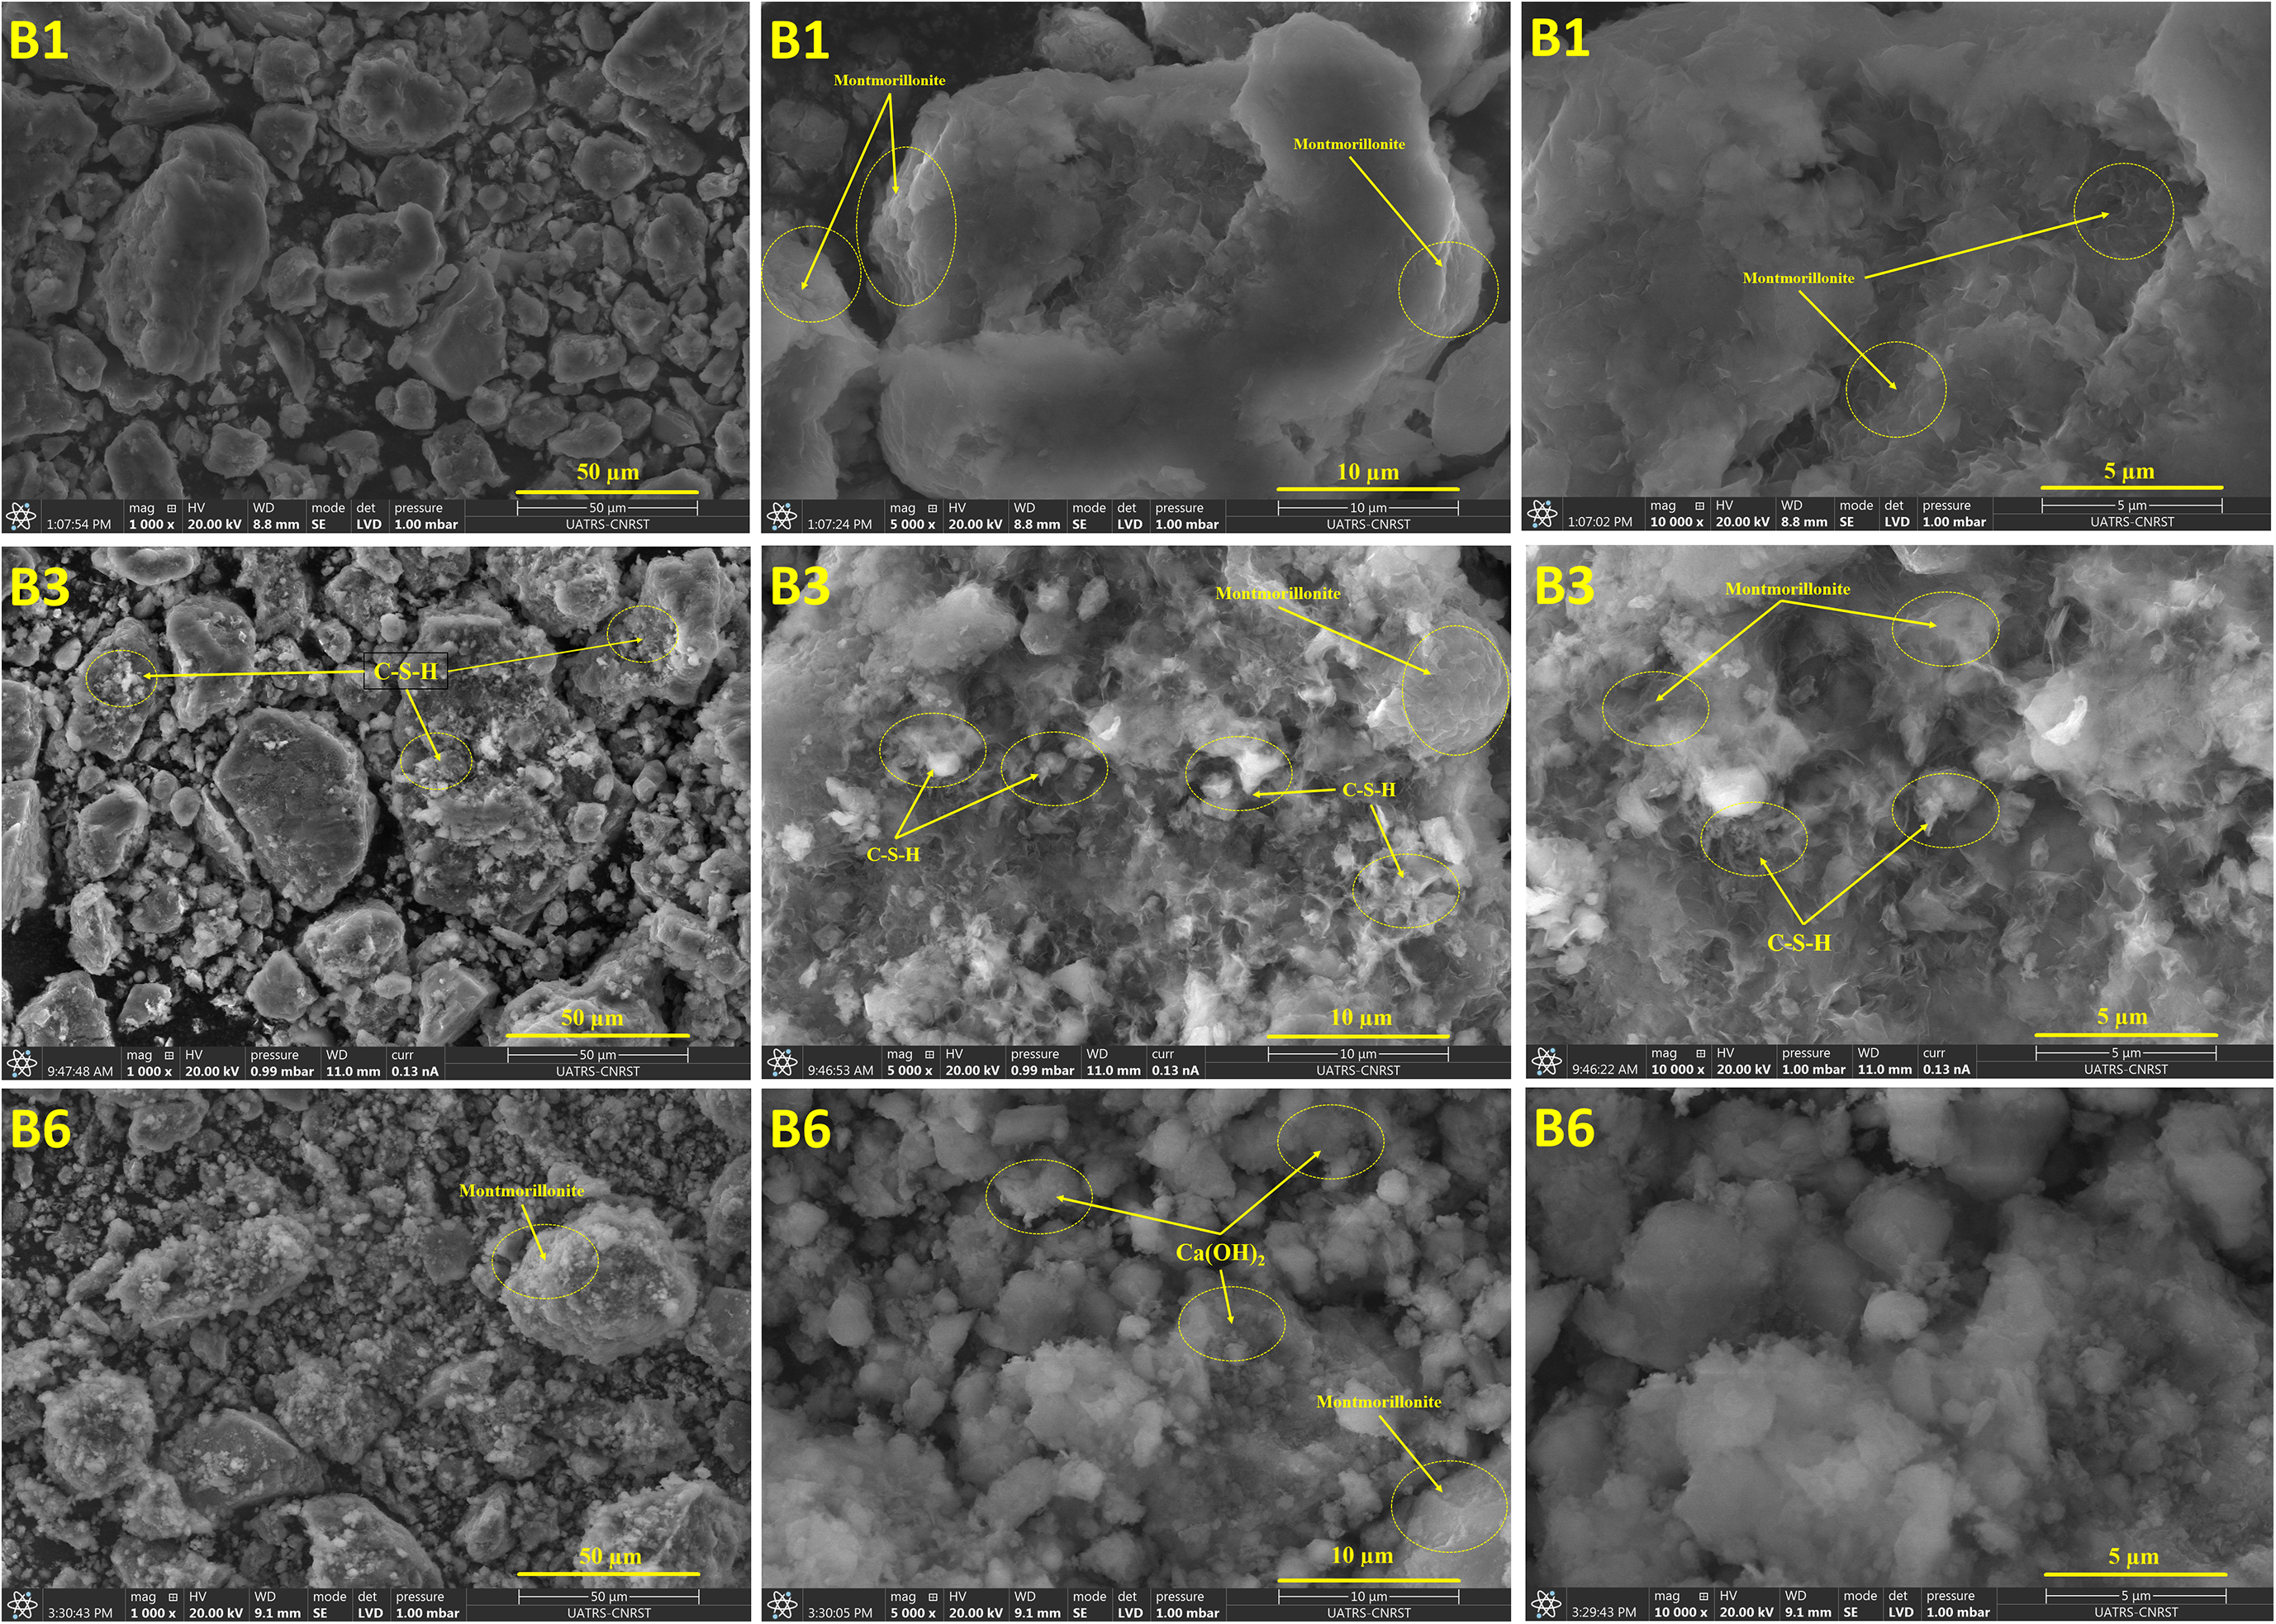
The SEM images (50, 10 and 5 µm) of the B1, B3, and B6 mixtures after 28 days of hydration are shown in Fig. 8. These images provide insights into the microstructural changes in bentonite upon lime addition. In the B1 mixture, after addition of 2 wt.% lime to the bentonite, the characteristic spongy morphology of smectite started to alter at the first interaction with lime (Fig. 8B1). This initial modification is attributed to the reaction between lime and the smectite surface, which initiates the pozzolanic reactions. In the B3 mixture, containing 10 wt.% lime (Table 1), significant changes are observed. A fibrous structure, characteristic of a C-S-H gel, formed on the surface of the montmorillonite grains. This structure indicates the progress of the pozzolanic reaction, whereby the lime reacts with the siliceous and aluminous phases of bentonite to form cementitious compounds. Finally, in the B6 mixture, with a high lime content of 32 wt.%, the montmorillonite surface underwent extensive alteration. The deposition of a C-S-H gel became dominant, completely covering the clay particle surfaces (Fig. 8). Furthermore, secondary phases such as portlandite (Ca(OH)2) and periclase (MgO) are observed on the surface.
SEM micrographs of the B1, B3 and B6 samples.

Stevensite-bentonite-lime mixtures
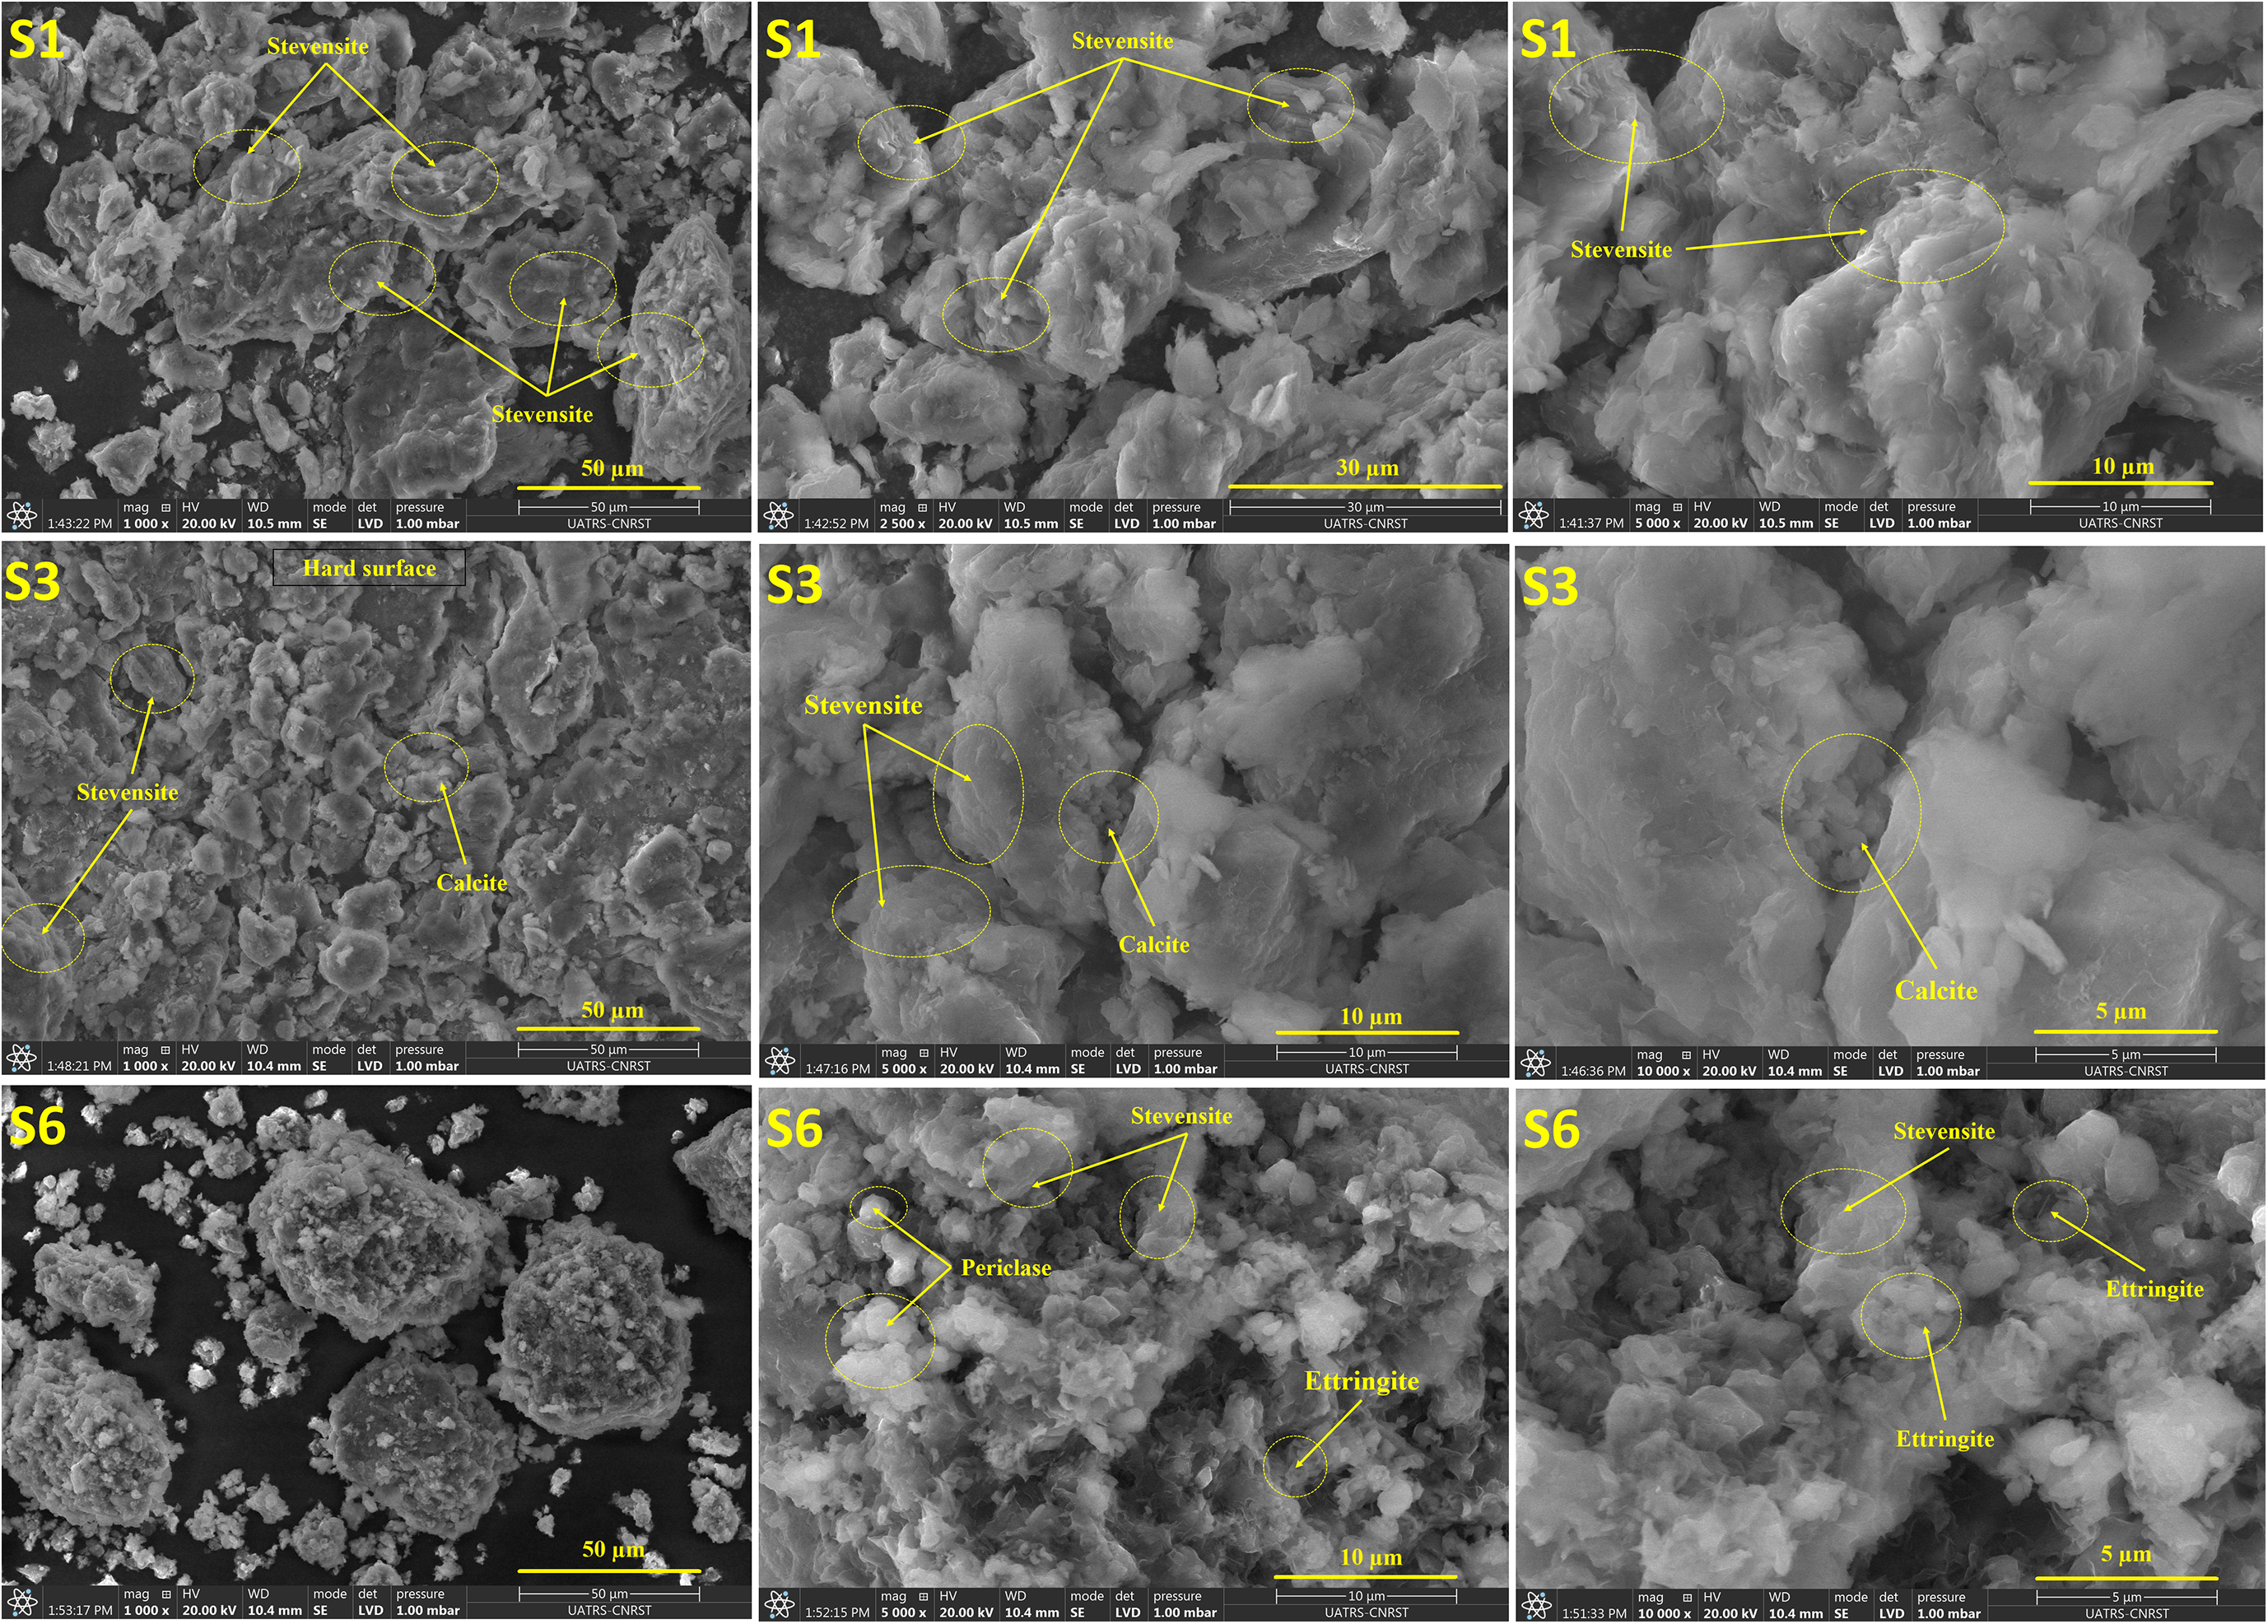
The structure of stevensite-bentonite can be observed in the SEM images (50, 10 and 5 µm) of the S1, S3 and S6 mixtures (Fig. 9). When 2 wt.% lime was added to stevensite-bentonite, the stevensite-bentonite remains unaffected. After addition of 10 wt.% lime, the SEM images of the S3 mixture show a compact and non-porous clay paste surface. This compact structure is attributed to the formation of calcite through a de-dolomitization process in the voids of the paste, which explains the high compressive strength of the S3 mixture. However, when the lime content significantly increased, ettringite and periclase crystals began to cover the surface of the stevensite grains. The hexagonal forms of periclase in particular can negatively impact the mechanical properties of the S6 mixture, resulting in a reduction in compressive strength.
SEM micrographs of the S1, S3 and S6 samples.

Evolution of the Ca/Mg, Ca/Si, Mg/Si, Al/Si, Na/Si and S/Si ratios of cured bentonite-lime and stevensite-bentonite-lime mixtures
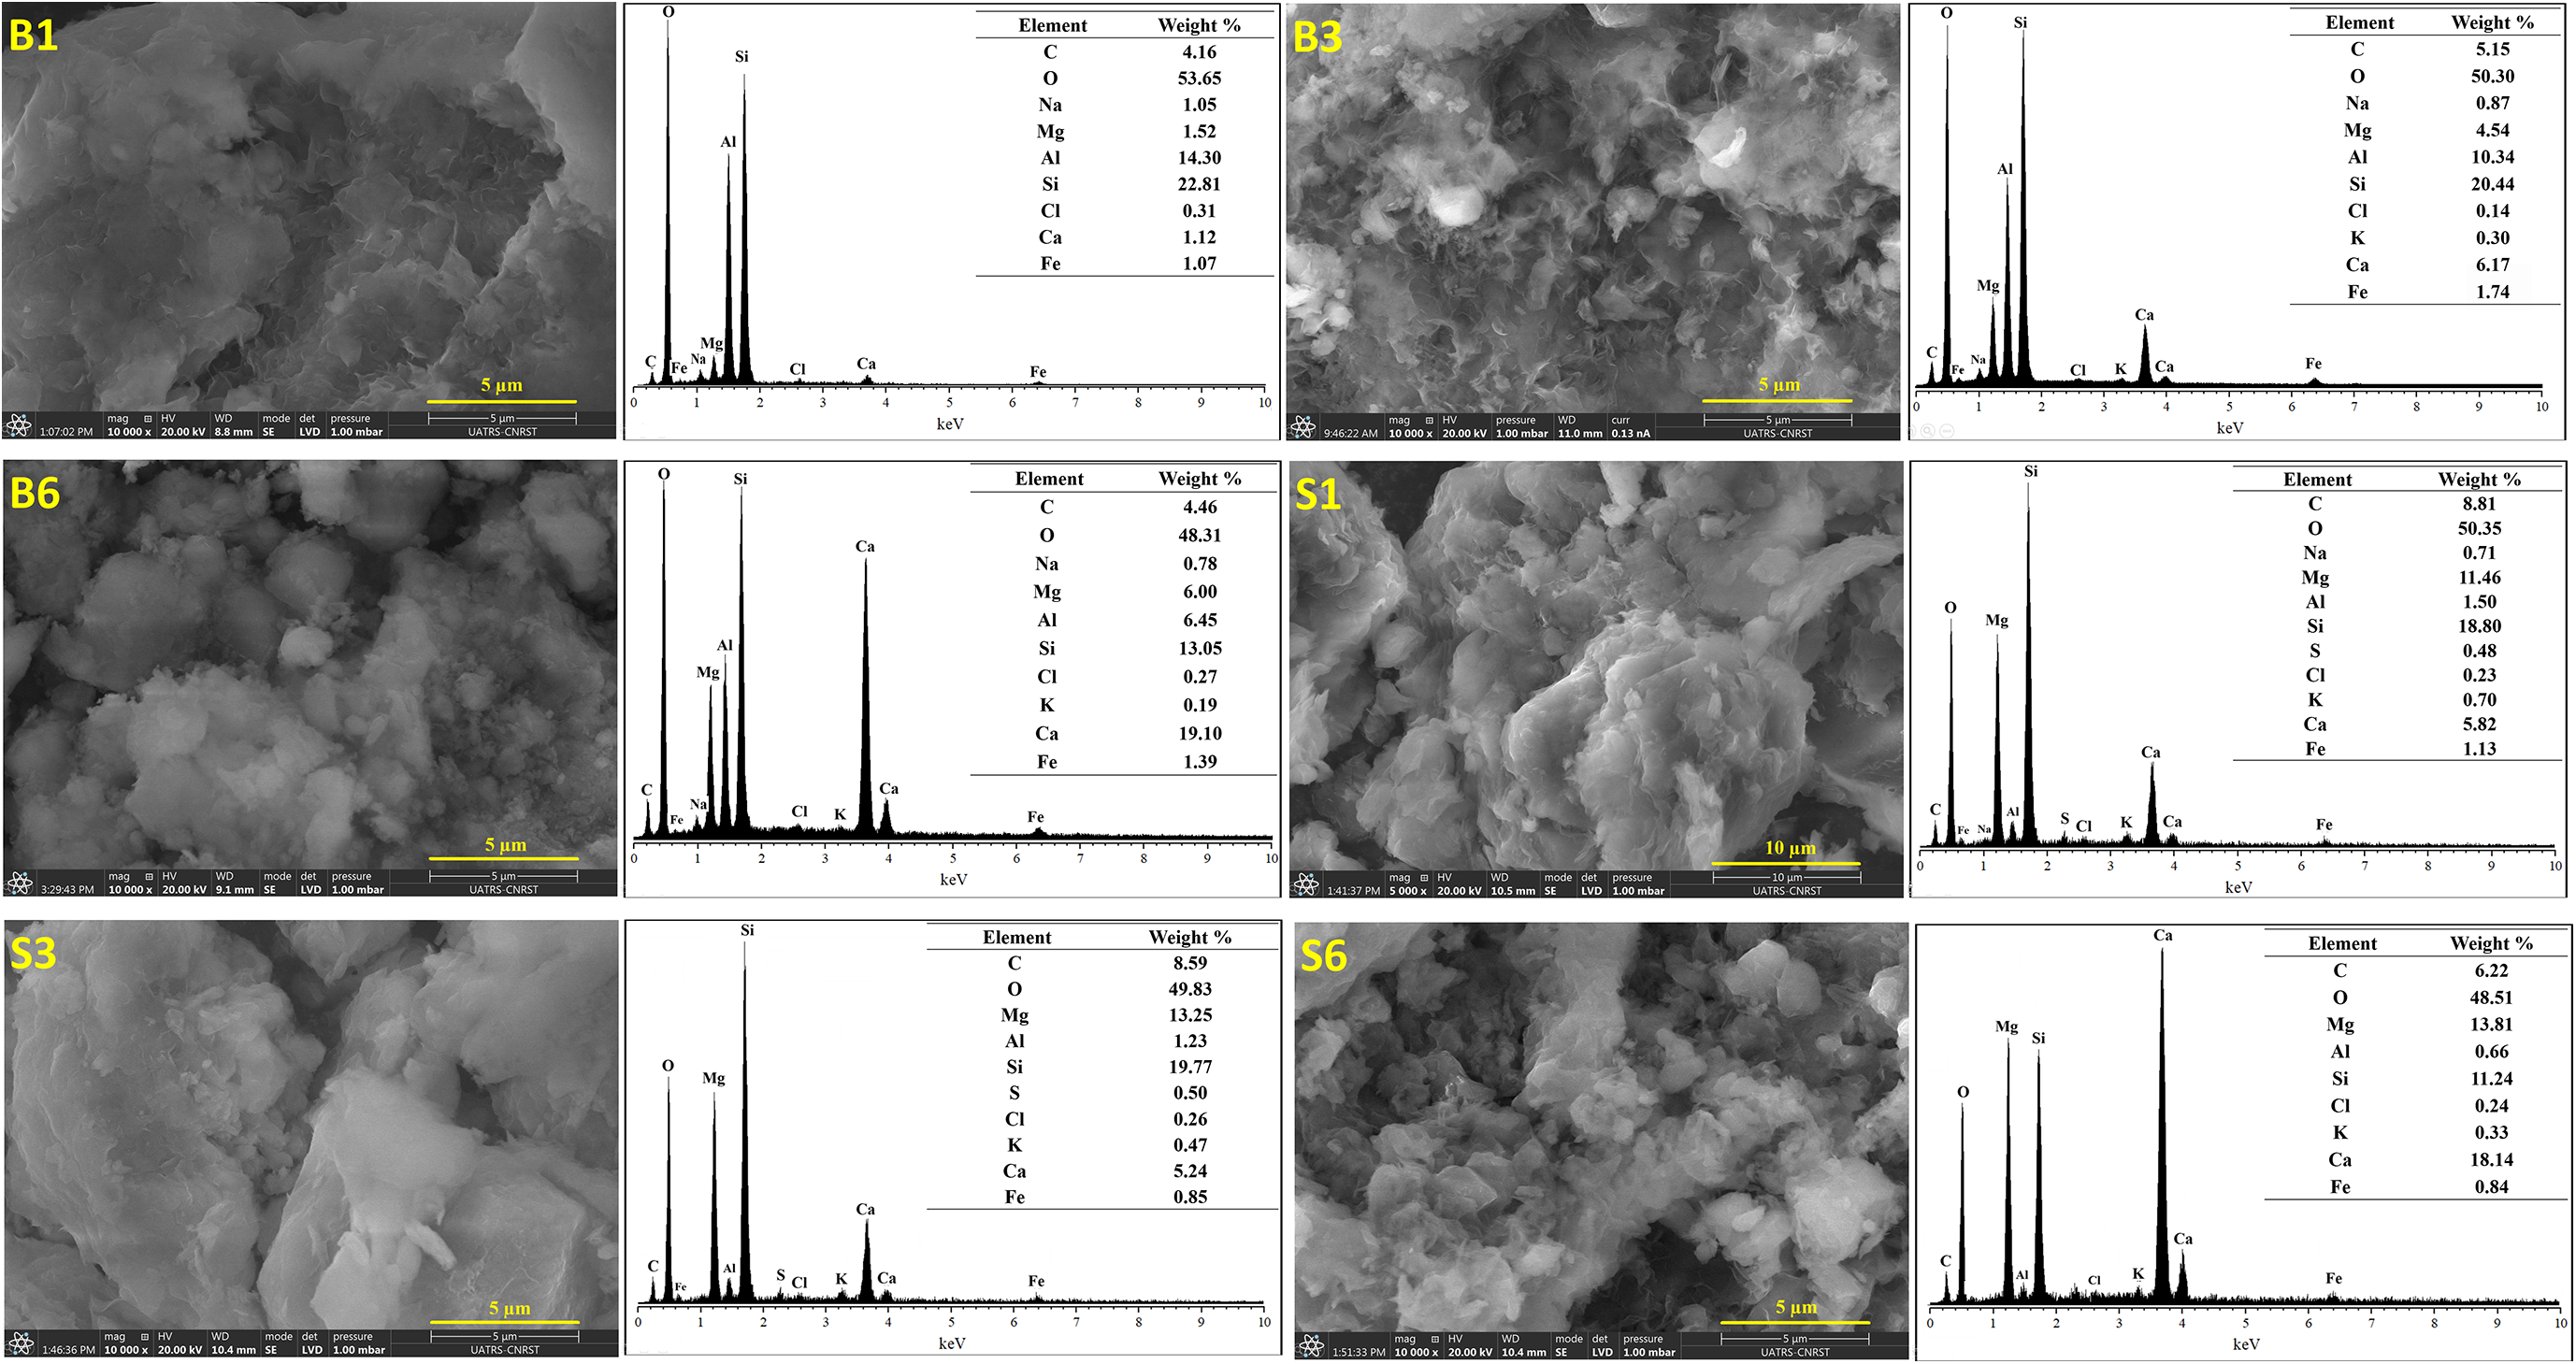
The Ca/Mg, Ca/Si, Mg/Si, Al/Si, Na/Si and S/Si ratios obtained by EDS analysis were plotted as a function of the amount of lime added (Fig. 10). The Ca/Mg ratio increases with the increasing amount of lime added. For stevensite-bentonite, the increase is almost linear, with the added lime in the form of CaO being transformed by hydration into Ca(OH)2 and by carbonation into CaCO3, which was deposited homogeneously on the surface of the stevensite crystals. For bentonite, a decrease is observed at the beginning, followed by strong linear growth. Cementation due to C-S-H gel development strongly increases the Ca content on the surface of the grains (Oumnih et al., Reference Oumnih, Bekkouch, Gharibi, Fagel, Elhamouti and El Ouahabi2019).
SEM/EDS analyses of the B1, B3, B6, S1, S3 and S6 samples.

Regarding the Ca/Al ratio, the increase observed for bentonite is low. However, an increasing Ca/Al ratio slope of 0.85 can be observed for stevensite-bentonite. In the case of bentonite, aluminols (Al-OH) combined with Ca2+ cations to form crystals of aluminous-calcic hydrates.
Figure 11 shows the average Ca/Mg, Ca/Al, Mg/Si, Al/Si, Na/Si and S/Si ratios found in several bentonite or stevensite-bentonite grains as a function of the quantity of lime added, namely 0, 2, 10 and 32 wt.%. Regarding the Mg/Si ratio, increases for both smectite-rich clays are observed, as the added lime contains a high amount of MgO. For bentonite, the increase is almost linear, whereas it only slightly increases for stevensite-bentonite. This can be interpreted according to the base exchange of stevensite, which allows the migration of magnesium ions from the octahedral sheet to the surface of the clay particle. Inasmuch as Ca is a disruptive cation for magnesian stevensite/saponite, which does not enter into the crystal structure, Ca2+ ions can replace Mg2+ at the edges of the crystals, the latter concentrating at the surface of the grains (Decarreau, Reference Decarreau1983). Regarding aluminium, a slight decrease is observed in both clays, probably due to the formation of localized crystals of C-A-H.
(a) Ca/Mg and Ca/Al ratios of bentonite (B) and stevensite-bentonite (SB) vs lime added. (b) Mg/Si and Al/Si ratios of B and SB vs lime added. (c) Na/Si and S/Si ratios of B and SB vs lime added.

The amount of sodium on the surface of the clay increases with increasing lime content for bentonite due to substitution of interlayer Na+ by Ca2+ (Oumnih et al., Reference Oumnih, Bekkouch, Gharibi, Fagel, Elhamouti and El Ouahabi2019). A similar process probably takes place for stevensite-bentonite via a base-exchange process.
For sulphur, occurring as gypsum in stevensite-bentonite (absent in bentonite), the XRD traces of the hydrated stevensite-bentonite specimens show the presence of localized ettringite crystals. The EDS analysis shows a decrease of sulphur with increasing addition of lime.
Mechanical strength
The mechanical strength values obtained for the stevensite-bentonite-lime mixtures (S1–S5) are higher than those for bentonite-lime mixtures (B1–B5; Fig. 12). This is due to de-dolomitization, which facilitates calcite formation within the pores of the stevensite-bentonite-lime mixture mortars.
(a) Uniaxial strengths of bentonite-lime mixtures (B1–B6) and (b) uniaxial strengths of stevensite-bentonite-lime mixtures (S1–S6).

The intragranular and intergranular solutions, the compositions of which depend on the water/lime ratio, contain CO32– and HCO3– released by de-dolomitization or by dissolution of CO2(g) from the air, which migrate with Ca2+ ions, released by portlandite, into the pores and react to form secondary calcite. This reaction consumes the portlandite and forms secondary calcite, which contributes to improved densification and bonding of the aggregates, thereby increasing mechanical strength.
Depending on the gradients of CO32– and HCO3– inside or outside the aggregates, a mechanism of dissolution/precipitation of CaCO3, neoformed during the de-dolomitization process inside the pores, may also develop, which might affect mechanical strength (Štukovnik et al., Reference Štukovnik, Bosiljkov and Marinšek2020). Above 10 wt.% lime addition, the water/lime ratio decreases and the dissolution/precipitation process slows down. Ca(OH)2 crystals initiate calcite precipitation on clay grain surfaces without modifying the material’s setting time. In contrast, neoformed calcite nanocrystallites within intergranular regions occlude micropores and increase cementation by accelerating the setting and hardening kinetics. The stevensite crystals, consolidated by secondary calcite, are not altered.
For bentonite, the destabilization of the montmorillonite structure leads to the formation of cemented gel (C-S-H) and portlandite on the surface of the aggregate grains. The geopolymerization of the (C-S-H) silicate chains, responsible for the increases in mechanical strength properties, is a slow phenomenon (El Idrissi, Reference El Idrissi2016). However, as portlandite and calcite crystals are inert, they reduce the compressive strength and Young’s modulus (Cho et al., Reference Cho, Lee and Kang2002). This might explain the decrease in mechanical strength after 28 days of hydration for those samples with lime contents above 10 wt.%.
Discussion
Bentonite and stevensite-bentonite are two clayey rocks composed mainly of smectites that react differently in the presence of a strong base such as lime. Although both rocks, rich in smectites, can be stabilized by lime, their reaction mechanisms are different. The structure of montmorillonite when destabilized by lime formed a C-S-H cemented gel during setting, whereas the structure of the stevensite remained intact. The increase in mechanical strength observed was due to the occurrence of dolomite in the stevensite-bentonite, which reacts with portlandite to form calcite in the pores of mortars (Štukovnik et al., Reference Štukovnik, Bosiljkov and Marinšek2020). This calcite formation reduced the porosity and consequently enhanced the mechanical strength of the mortars.
Bentonite
The addition of lime destabilized bentonite, inducing the formation of calcite and a C-S-H cemented gel. The lamellar structure of montmorillonite facilitated cation exchange, allowing Ca2+ cations to occupy the interlayer space as charge-compensating ions. Bentonite is formed at pH 7.5, and the zeta-potential of montmorillonite is almost insensitive to pH changes (Sondi et al., Reference Sondi, Bišćan and Pravdić1996). At pH > 10, the octahedral sheet [AlO6] and tetrahedral sheet [SiO4] moieties, found on the surface as Al-OH and Si-OH, are deprotonated and neutralized by Ca2+ cations to form C-S-H cemented gels and other calcic aluminous hydrates on the aggregate surface. The Ca2+ cations electrostatically bind to montmorillonite surfaces (zeta-potential = –62.8 ± 10.6 mV; Guo & Yu, Reference Guo and Yu2017).
Pozzolanic reactions between the silicates and the aluminate in bentonite in an alkaline medium allowed for the formation of C-S-H and C-A-H gels (Solanki & Zaman, Reference Solanki, Zaman and Kazmiruk2012). The OH– ions destabilized the tetrahedral sheet of montmorillonite, yielding siloxane groups (SiO5/2–, Q3). Dissolution of the Q3 tetrahedra into the form of Q0 tetrahedra followed from the new cleavage of the siloxane bonds. The dissolved silica diffused into the interstitial solution and formed, with OH– ions and lime, hydrated calcium silicates of the Q1 type (Monnin, Reference Monnin2005). During the formation of C-S-H, the silica from montmorillonite passes from a Q3 environment to a Q1 and Q2 environment (Vitale et al., Reference Vitale, Deneele, Paris and Russo2017).
The formation of the silicate chains of the C-S-H gel enabled the consolidation of the test pieces of the bentonite-lime mixture. The compressive strength was at a maximum with the addition of 10 wt.% lime (1.46 MPa for sample B3), confirming the results obtained previously by Oumnih et al. (Reference Oumnih, Bekkouch, Gharibi, Fagel, Elhamouti and El Ouahabi2019). Ettringite crystallized in the free spaces of mixture paste B9 in the presence of gypsum, and the free Ca2+ ions caused a decrease in the porosity of the specimens. This process enhanced the cohesion between the clay paste grains at an early stage, thereby increasing the mechanical strength of the mixtures.
Stevensite-bentonite
Stevensite, which forms at a pH of ∼9.4 (Tosca & Masterson, Reference Tosca and Masterson2014), has negatively charged layers in a pH range of 2.5–12.0 (Bouna et al., Reference Bouna, Rhouta, Amjoud, Jada, Maury, Daoudi and Senocq2010). These negative charges are due to the deprotonation of silanol groups on the surfaces and edges of the stevensite layers. The edge charges represent only ∼5% of the total charge of Na-stevensite (Rhouta et al., Reference Rhouta, Kaddami, Elbarqy, Amjoud, Daoudi, Maury and Gerard2008). The zeta-potential of stevensite-bentonite is consistently equal to –20 mV up to pH 7.5 (Benhammou et al., Reference Benhammou, Yaacoubi, Nibou and Tanouti2005; Bouna et al., Reference Bouna, Rhouta, Amjoud, Jada, Maury, Daoudi and Senocq2010). Between pH 7.5 and 10.5, a significant decrease of the zeta-potential from –20 to –35 mV occurs, which can be attributed to the deprotonation of silanol (Si-OH) bound to the surface edges. At pH > 10.4, the zeta-potential stabilizes at –35 mV (Bouna et al., Reference Bouna, Rhouta, Amjoud, Jada, Maury, Daoudi and Senocq2010). Within the pH range of 7.5–10.5, new negatively charged sites are generated through the deprotonation of hydroxyl groups on the broken edges of the stevensite particles, which further lowers the zeta-potential.
Unlike montmorillonite, stevensite does not present aluminol groups on the edges of its grains; only deprotonation of silanol (Si-OH) occurs (Leroy & Revil, Reference Leroy and Revil2004). The calcium cation (Ca2+; ionic radius = 100 pm) demonstrates enhanced stability as a charge compensator in octahedral coordination environments compared to magnesium (Mg2+; ionic radius = 72 pm), a disruptive cation whose increased charge density induces significant lattice distortion (Decarreau, Reference Decarreau1983). The Ca2+ ions do not enter into the [MgO6] octahedral sheet, and the [MgO6]10– octahedra remain strongly bound to the [SiO4] tetrahedral sheet. Consequently, the silanols do not detach from the surface of the stevensite crystals and instead react with Ca2+ ions to form a C-S-H cemented gel, as was observed with montmorillonite.
Addition of 32 wt.% lime (sample S6) results in an excess of periclase (MgO). Periclase hexagons increase the free space between stevensite-bentonite grains, thereby increasing the porosity of the sample S6 mortars (Gonçalves et al., Reference Gonçalves, Silva, De Brito, Fernández and Esquinas2020). This explains the reduced compressive strength of the S6 mixture. Additionally, the formation of ettringite may contribute to this reduction in compressive strength. Ettringite crystals may recrystallize into sub-micrometre-sized particles within the matrix (Taylor et al., Reference Taylor, Famy and Scrivener2001), causing expansion and cracking, which further reduces the compressive strength of the S6 mixture.
Conclusion
This study investigated the reactivity of two swelling clay-rich soils – a dioctahedral montmorillonite-rich bentonite and a trioctahedral stevensite/saponite-rich bentonite – after treatment with lime. Although montmorillonite–lime interactions are well-documented, the behaviour of stevensite/saponite under alkaline conditions remains largely unexplored. The mineralogical, thermal, mechanical and microstructural changes after 28 days of curing were analysed to determine whether new phases were formed and their impacts on the mechanical properties of the clays. In particular, the mechanism of ettringite formation in stevensite-bentonite-lime mixtures and C-S-H formation in bentonite-lime mixtures and their impacts on these mechanical properties were assessed. The results obtained lead to the following conclusions:
• The addition of lime promoted the formation of C-S-H and C-A-H gels in bentonite, with phase transitions being dependent on the lime content and silica polymerization processes. The phase transformations depend on the lime content and silica polymerization processes. In contrast, ettringite formed in the stevensite-bentonite-lime mixtures, influenced by lime content and progressive de-dolomitization of dolomite in the presence of gypsum.
• In the bentonite-lime mixtures, increasing the lime content induced significant microstructural modifications, including C-S-H gel formation, montmorillonite alteration and secondary phase precipitation. In the stevensite-bentonite-lime mixtures, stevensite/saponite remained structurally intact at low lime levels, whereas greater lime contents triggered the formation of ettringite and calcite.
• The stevensite-bentonite-lime mixtures achieved greater compressive strength than the bentonite-lime mixtures due to the densification effect of calcite formed by de-dolomitization. In contrast, the bentonite-lime mixtures exhibited only limited compressive strength increases due to the slow geopolymerization of C-S-H and the persistence of inert phases such as portlandite and calcite.
The findings of this study challenge the conventional assumption that all smectites enhance pozzolanic reactions under alkaline conditions. Unlike montmorillonite, stevensite/saponite remains inert in such environments, and the strength of the stevensite-bentonite-lime mixtures results primarily from calcite densification rather than typical pozzolanic activity. This distinction highlights the need for a more nuanced understanding of smectite behaviour in soil stabilization. By contrasting the stabilization mechanisms of magnesium-rich stevensite/saponite and aluminium-rich montmorillonite (bentonite), this study offers novel insights into the geotechnical applications of magnesium-dominant clays, expanding their potential use in construction and soil treatment.
Author contributions
Harrou Achraf: conceptualization, investigation and formal analysis, writing – original draft, writing – review and editing. Dounia Azerkane: experimental manipulation of mechanical strength and investigation (XRD). Meriam El Ouahabi: validation, visualization, co-supervision, writing – review and editing. Hicham Nasri: experimental manipulation for geotechnical studies, investigation, writing – review and editing. Nathalie Fagel: validation, visualization, writing – review and editing. ElKhadir Gharibi: conceptualization, validation, visualization, supervision, writing – review and editing, funding acquisition.
Acknowledgements
The authors thank the Faculty of Sciences, Mohammed First University (Morocco) for its valuable technical support for the results achieved. We also thank the Faculty of Sciences, Université of Liège, Belgium, for XRF analysis and the Scientific Research National Center in Morocco for SEM/EDS analysis (CNRST, Rabat, Morocco).
Competing interests
The authors declare that they have no known competing financial interests or personal relationships that could have appeared to influence the work reported in this paper.