I. INTRODUCTION
Complex oxide heterostructures are currently being developed for device applications that implement their wide range of electronic, magnetic and ionic properties. Perhaps the most intriguing and potentially impactful area of research involves the growth of superlattices that contain oxides with different magnetic/electronic properties that can be tailored to exhibit a wide variety of responses simultaneously.Reference Ohtomo and Hwang1, Reference Takamura, Yang, Kemik, Arenholz, Biegalski and Christen2 The recent literature on complex oxide heterostructures contain numerous examples where systems with a high density of atomically abrupt interfaces display multifunctional properties which deviate from those of the constituent materials. These enhanced or unexpected properties may result from a combination of parameters, including electronic reconstruction and chemical mixing at interfaces,Reference Nakagawa, Hwang and Muller3, Reference Qiao, Droubay, Varga, Bowden, Shutthanandan, Zhu, Kaspar and Chambers4 epitaxial strain,Reference Lee, Christen, Chisholm, Rouleau and Lowndes5 and the concentration of oxygen vacancies.Reference Ferguson, Kim, Kourkoutis, Vodnick, Woll, Muller and Brock6 Investigation of the origins of defect formation in these multifunctional superlattices is crucial to improve the fabrication and performance of device structures. Here, we examine superlattices containing the ferromagnetic (FM) metal La0.67Sr0.33MnO3 (LSMO) and the antiferromagnetic (AFM) insulator La0.67Sr0.33FeO3 (LSFO) and investigate the interplay between epitaxial strain and the presence of structural defects on their multifunctional properties. LSMO is a candidate material for spintronic and magnetic data storage applications due to its high-degree of spin polarization and colossal magnetoresistant properties. The coincident metal/insulator and FM/paramagnetic transitions originate from the double exchange mechanism which involves hopping of electrons along Mn3+—O2-—Mn4+ chains,Reference Ramirez7, Reference de Gennes8 whereas electron-phonon interactions through cooperative Jahn-Teller distortions also play an important role.Reference Millis, Littlewood and Shraiman9 On the other hand, LSFO is a G-type antiferromagnet in which the overlapping Fe 3d and O 2p orbitals influence the AFM superexchange interaction.Reference Goodenough10, Reference Yang, Yelon, James, Chu, Kornecki, Xie, Zhou, Anderson, Joshi and Malik11 Previously, we showed using soft x-ray magnetic spectroscopy and photoemission electron microscopy that the FM and AFM properties of the superlattice depend strongly on the sublayer thickness and that a robust spin-flop coupling occurs at the interfaces of a superlattice composed of six unit cells of LSFO and six unit cells of LSMO, repeated 10 times (referred to as [6LSFO][6LSMO]10.Reference Takamura, Yang, Kemik, Arenholz, Biegalski and Christen2, Reference Arenholz, van der Laan, Yang, Kemik, Biegalski, Christen and Takamura12, Reference Yang, Kemik, Scholl, Doran, Young, Biegalski, Christen and Takamura13 The strength of the spin-flop coupling was observed to overcome the pinning effect of structural domains that typically define the locations of AFM domains in thick films.Reference Yang, Kemik, Scholl, Doran, Young, Biegalski, Christen and Takamura13 Upon reducing the LSMO sublayer thickness down to three unit cells in the [6LSFO][3LSMO]10, the LSMO sublayer became paramagnetic and insulating for all temperatures, whereas the LSFO sublayer retained its AFM properties.Reference Takamura, Yang, Kemik, Arenholz, Biegalski and Christen2
In this paper, we use atomic resolution Z-contrast imaging and electron energy loss spectroscopy (EELS) in an aberration-corrected scanning transmission electron microscope (STEM) to examine the microstructure of three LSFO/LSMO superlattices. In these superlattices, a variety of defect structures are observed including stacking faults, “nanoflowers,” and cracks/pinholes. The formation of these defect structures is shown to be driven by the strain relaxation, indicating that strain relaxation can significantly impact the local atomic structure and it has direct consequences on the functional properties.
II. EXPERIMENTAL
The LSFO/LSMO superlattices were grown by pulsed laser deposition (PLD) on (001)-oriented SrTiO3 (STO) substrates using a KrF laser (248 nm; Coherent, Inc., Santa Clara, CA) operated at 10 Hz with an energy density of 1.5 J/cm2. Prior to growth, the STO surface was etched using buffered HF to obtain a TiO2—terminated surface. During the growth, the substrate was heated at 770 °C and chamber pressure was 200 m Torr O2. In situ reflection high energy electron diffraction (RHEED) was used to monitor the growth process and to determine the precise sublayer thicknesses. Two [6LSFO][3LSMO]10 superlattices were grown with nominally the same growth conditions, however, due to the sensitivity of the growth process to the minute and unintentional variation in parameter such as the crystalline quality of the substrates and laser conditions, the strain states differed as explained below. A third micrometer-thick superlattice with [6LSFO][6LSMO] repeat unit was grown at 625 °C, in 100 m Torr of O2, with a laser energy density of 1.4 J/cm2 and 10 Hz repetition rate. The growth rate for this sample is ∼130 pulses per layer of LSMO, and ∼200 pulses per layer of LSFO, leading to total growth time ∼24 h. All the superlattices were cooled to room temperature in ∼200 Torr of O2 after the deposition.
X-ray diffraction (XRD) data were acquired on a Bruker D8 Discover diffractometer (Bruker AXS, Inc., Madison, WI) using Cu Kα1 radiation. The high angle annular dark field (HAADF) images and EELS spectra and mapping were obtained using FEI Tecnai F20 (FEI Company, Hillsboro, OR) at 200 kV and the TEAM 0.5 microscope at the National Center for Electron Microscopy at Lawrence Berkeley National Laboratory (LBNL, Berkeley, CA),Reference Erni, Rossell, Kisielowski and Dahmen14 and an aberration-corrected JEM2100F STEM (JEOL USA, Inc., Boston MA) operating at 200 kV at UC Davis. With the improved hexapole-type illumination aberration corrector and a novel Schottky-type high-brightness field-emission electron source,Reference Erni, Rossell, Kisielowski and Dahmen14 the TEAM 0.5 microscope can produce a sub-angstrom probe with convergence half angle of 28.9 mrad. By operating the source at 80 kV, no observable sample damage occurred during EELS mapping (33 × 33 pixels and 150 ms per pixel) as determined by comparing the Z-contrast images acquired before and after the EELS map acquisition. Element-specific maps were obtained by integrating the specific characteristic edge intensity using TEM Imaging & Analysis software. Multislice image simulations were performed using QSTEM software.Reference Koch15 To simplify the simulations, we assumed that the A site was composed entirely of La3+ ions instead of 70% La3+ ions and 30% Sr2+ ions as in the sample. The parameters were set to match the experimental value according to the probe corrector software with an aberration value of 0.176 nm, C3 value of 0.8 μm, defocus value of −2 nm, HAADF collection semi angles of 93–390 mrads and average thermal diffusion scattering 30 times. The thickness of the sample is estimated to be 24 nm using low loss EELS. For the extraction of the L 2,3 peak ratio, the Mn L 3 and L 2 peaks from the 635–650 eV and 650–662 eV windows, respectively, as well as the Fe L3 and L2 peaks from the 704 to 719 eV and 719 to 734 eV windows, respectively, were fit using a Gaussian profile after subtracting the background using a standard power law fit. The peak ratio was obtained by dividing the fitted Gaussian peak heights. The error bars are the standard deviations from multiple fits obtained by slightly shifting the Gaussian fitting window. Element specific soft x-ray magnetic spectroscopy measurements were performed at beamline 4.0.2 of the Advanced Light Source at LBNL to characterize the FM and AFM properties of the superlattices.Reference Arenholz and Prestemon16 X-ray magnetic circular/linear dichroism (XMCD/XMLD) spectra were acquired at 30° grazing incidence, using circularly/linearly polarized x-rays, respectively. The XMCD measurements were performed with an applied magnetic field ± 0.53 tesla parallel to the x-ray beam. For the XMLD measurements, the x-ray polarization, E, was applied either in-plane along the [010] substrate direction, or at 60° with respect to the sample surface (referred to as the out-of-plane [001] substrate direction), such that the XMLD is defined as E//[010]—E//[001]. Bulk magnetometry was performed using a superconducting quantum interference device using a Quantum Design Magnetic Properties Measurement System (Quantum Design, Inc., San Diego, CA) with the magnetic field applied along the in-plane <100> directions.
III. RESULTS AND DISCUSSION
High-resolution XRD ω-2θ scans and reciprocal space maps (RSMs) (Fig S1) were used to determine the average structural properties of the LSFO/LSMO superlattices. Bulk LSMO can be approximated with a pseudocubic perovskite unit cell with lattice constant of 3.87 Å, (0.9% tensile strain on STO—a = 3.905 Å), whereas bulk LSFO has an orthorhombic structure with a = 5.010 Å, b = 5.544 Å, and c = 7.846 Å. (c/2 = 3.923 Å and 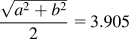 Å) The LSFO unit cell can take two possible orientations when deposited on the (001) surface of a STO substrate. If the c-axis is in-plane, then the LSFO unit cell will be under 0.5% compressive strain. On the other hand, if LSFO unit cell orients itself with the a and b-axes in-plane, then the LSFO unit cell will be nearly lattice-matched to the STO substrate. As observed experimentally, the overall LSFO/LSMO superlattice is expected to exist under a small tensile strain. The XRD measurements show that for one of the [6LSFO][3LSMO]10 superlattices, the lattice was tetragonally distorted under tensile strain from the underlying STO substrate, whereas the lattice in the majority of the second [6LSFO][3LSMO] 10 superlattice was nearly cubic with in-plane and out-of-plane lattice parameters close to that of the STO substrate (a = 3.905 Å). These superlattices are referred to as the fully strained and partially relaxed superlattices, respectively.
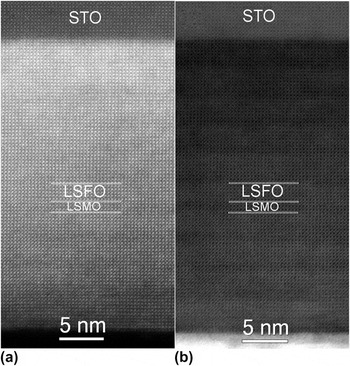
A Z-contrast image and simultaneously recorded bright-field image from the fully strained [6LSFO][3LSMO]10 superlattice are shown in Fig. 1. In the Z-contrast image [Fig. 1(a)], the STO substrate appears darker than the film due to the lower average atomic number. Due to the extra strain component in the thermal diffuse scattering, the contrast difference between the atomic columns of the LSFO and LSMO sublayers that have an average Z number difference less than 1 is not clearly distinguished. However, the bright-field image shown in Fig. 1(b) and EELS line scansReference Kemik, Gu, Yang, Chang, Song, Bibee, Mehta, Biegalski, Christen, Browning and Takamura17 confirm the [6LSFO][3LSMO] repeat order of the superlattice. The EELS line scanReference Kemik, Gu, Yang, Chang, Song, Bibee, Mehta, Biegalski, Christen, Browning and Takamura17 also reveals a fairly significant amount of chemical interdiffusion at the interfaces of this superlattice. No defect contours were detected in the bright-field image unlike the partially relaxed superlattice described below, indicating no dislocations or stacking faults were formed in this fully strained superlattice.
(a) Z-contrast image and (b) bright-field image of the fully strained [6LSFO][3LSMO]10 superlattice (image (a) was acquired with a collection semi angle of 80–210 mrads using JEOL 2100 at 200 kV).

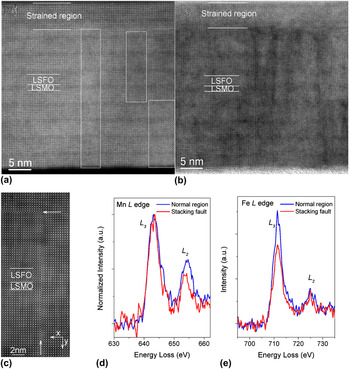
In comparison, Fig. 2(a) shows the Z-contrast image of the partially relaxed [6LSFO][3LSMO]10 superlattice. In about the first 15 unit cells closest to the substrate, the LSFO and LSMO sublayers were fully constrained to the STO substrate. In this region, the distinction between the LSFO and LSMO sublayers in the Z-contrast image is again difficult due to the extra strain component in the thermal diffuse scattering (as in the strained [6LSFO][3LSMO]10 superlattice shown in Fig. 1). However, beyond the first 15 unit cells, the simultaneously recorded bright-field image in Fig. 2(b) shows the presence of defect contours in this region, indicating that the superlattice has relaxed. In this region, the strain component was weakened and the [6LSFO][3LSMO] repeat order was more easily identified in the Z-contrast images. EELS line scansReference Kemik, Gu, Yang, Chang, Song, Bibee, Mehta, Biegalski, Christen, Browning and Takamura17 confirmed that the [6LSFO][3LSMO] repeat order was maintained throughout the entire thickness of the superlattice and that the interfaces were characterized by abrupt concentration profiles.
(a) Z-contrast image and (b) bright-field image of the partially relaxed [6LSFO][3LSMO]10 superlattice. The white rectangles highlight the defect regions. (c) Smoothed Z-contrast image showing the formation of a stacking fault with an extra (La/Sr)O plane indicated by the white arrows. The smoothing process removes the random noise from the image. (d) Mn L edge normalized to L 3 peak for comparison, and (e) Fe L edge EEL spectra from a stacking fault or normal ABO3 region. Each spectrum consists of the sum of three spectra from each region. (Image (a) and (b) were acquired using JEOL2100 at 200 kV with 60–160 mrads collection semi angle; image (c) was acquired using TEAM 0.5 at 80 kV with collection semi angles of 90–390 mrads; EELS were collected using TEAM 0.5 at 80 kV with 0.2 eV/channel dispersion and collection semi angle ∼ 90 mrads).

Further analysis of the Z-contrast images revealed that these defect contours arose due to stacking faults with two different orientations within the STEM sample. First, stacking faults consisting of an extra (La, Sr)O plane perpendicular to the image plane are shown in Fig. 2(c), where the white arrows denote the line of the stacking fault. This stacking fault is characterized by a slightly larger interatomic spacing needed to accommodate the large 12-coordinated La/Sr ions, and therefore aids in the accommodation of the small tensile strain in this system.Reference Shannon18 In addition, the lattices on either side of the stacking fault are shifted relative to one another by half a unit cell. The arrow on the right side of the image shows the origin of a stacking fault along the growth direction. In this case, the origin of the stacking fault is not accompanied by a partial dislocationReference Fischer, Wu, Sun, Wei, Huang, Senda, Iida, Iwaya, Amano and Ponce19 but rather another stacking fault lies perpendicular to it. EEL spectra were collected at the stacking fault and in the normal perovskite (ABO3) region [Figs. 2(d)–2(e)] to analyze the change in the electronic structure associated with the stacking fault. Energy shifts were not used to analyze the oxidation states due to the experimental difficulty in calibrating the energy scales. The white lines of the transition metals reflect the unoccupied density of states in the eg and t2g orbitals. The Mn L3/L2 peak height ratio extracted by Gaussian fitting increased 27% from 2.44 ± 0.03 in the normal region to 3.1 ± 0.30 at the stacking fault, whereas the Fe L3/L2 ratio decreased 25% from 7.0 ± 1.00 in the normal region to 5.2 ± 0.20 at the stacking fault. According to previous studies, the observed changes to the peak ratios correspond to a drop in both the Mn and Fe valence states at the stacking fault.Reference Schmid and Mader20, Reference Riedl, Gemming and Wetzig21 This drop in valence balances the positive charge introduced by the extra (La Sr)O plane at the stacking fault. The Fe/Mn valence recovers to normal values greater than two unit cells away from the stacking fault.
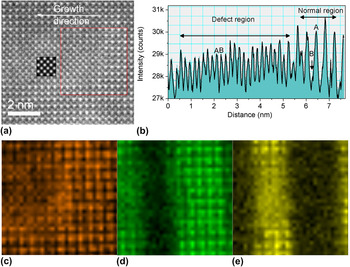
The second orientation of the stacking fault is one where it lies parallel to the image plane. In this case, the unit cell of a portion of the STEM sample is translated by the vector [0.5 0.5 0]. With this shift of the unit cell, a [001] projection image would no longer distinguish the chemical difference between A- and B-sites of the perovskite structure within the STEM sample. An example of this type of stacking fault is shown within the white rectangles in Fig. 2(a). In the normal perovskite phase, the bright spots correspond to the La/Sr atomic columns and the less bright columns at the center of four bright La/Sr columns are the Fe/O (Mn/O) atomic columns. This structure is characterized by a large intensity difference between the two types of atomic columns. In the stacking fault region highlighted by the white rectangles, the two types of atomic columns maintain the same arrangement; however they are characterized by only a small intensity difference. A higher magnification image and a line profile are shown in Figs. 3(a) and 3(b). The peak height ratio between the two types of atomic columns in the normal region is ∼5.5 compared with nearly 1 for the stacking fault region after subtracting the background continuum. The red box in the image highlights a region containing both the defect structure (left side) and the normal ABO3 phase (right side). Element-specific EELS maps for this region are shown in Figs. 3(c)–3(e) for La, Fe, and Mn, respectively whereas EEL spectra from individual atomic columns are shown in Fig. S2. As shown in the La map, the La ions correspond to the A columns in the normal ABO3 perovskite region (right side), whereas in the defect region (left side), the La ions are found in both the A and B/O columns. The same nomenclature is used for the atomic columns as in the normal ABO3 perovskite region. Similarly, the Fe and Mn maps show that the Fe and Mn ions only reside on the B/O columns in the normal ABO3 region, whereas they are found on both the A and B/O columns in the defect region. The spatial resolution of the EELS maps is limited to 1-2 Å for the 300-1,000 eV energy loss range by the delocalization of the inelastic scattering process.Reference Muller22 However, as shown by Shah et al.Reference Shah, Ramasse, Wen, Bhattacharya and Zuo23 the practical EELS spatial resolution is limited to 3.7–3.9 Å for Ti L 2,3, V L 2,3, and Sr L 3 for the TEAM 0.5 microscope at 80 kV considering the experimental aspects such as sample thickness, stability of the instrument, elastic and phonon scattering, and EELS collection angle. Our results are in good agreement with their result. In the stacking fault defect region, the atomic columns contain both La and Fe/Mn and the spacing between atomic column containing same species is around 2.76 Å. For this reason, the atoms of the elemental map in the defect region are not as well defined as the normal region where the spacing between columns containing the same species is ∼3.9 Å. Finally, multislice image simulations were performed assuming a 24 nm thick STEM sample with a buried stacking fault lying in the image plane and located at various positions within the thickness of the STEM sample. The best qualitative agreement in regards to the relative peak height ratios of the two types of atomic columns was obtained when the stacking fault was located in the middle of the STEM sample [see inset of Fig. 3(a)].
(a) Z-contrast image of the partially relaxed [6LSFO][3LSMO]10 superlattice with the inset showing the simulated image for a stacking fault lying in the middle of a 24 nm thick STEM sample; (b) intensity line profile with 4 unit cell width across the defect region; (c) La map (826.5–852.5 eV), (d) Fe map (708.7–712eV); and (e) Mn map (640–645 eV) of the region within the red box in (a). The energies in the brackets define the respective energy integration windows. Image (a) was acquired using the TEAM 0.5 microscopy operated at 80 kV with collection semi angles of 90–390 mrads; EELS maps were acquired with 0.2 eV/channel dispersion and collection semi angle ∼ 90 mrads.

Previous studies have shown that stacking faults, threading dislocations, or misfit dislocations develop consequent to strain relaxation in perovskite thin films once the film thickness reaches a critical value.Reference Fischer, Wu, Sun, Wei, Huang, Senda, Iida, Iwaya, Amano and Ponce19, Reference Siwach, Singh and Srivastava24, Reference He, Klie, Logvenov, Bozovic and Zhu25 This critical thickness in multilayer systems depends on several parameters including the lattice mismatch between the substrate and the film as well as between the two layers,Reference Matthews and Blakeslee26 the substrate surface quality,Reference Matthews and Blakeslee26 the growth temperature, and the kinetics of the growth technique.Reference Peng, Xi, Moeckly and Alpay27, Reference Tersoff and LeGoues28 In the current work, a nonequilibrium growth technique (PLD) was used with identical growth conditions (O2 background pressure, substrate temperature and laser energy), however the substrate surface condition was superior for the partially relaxed superlattice compared with the fully strained superlattice. The RHEED oscillations for the fully strained superlattice were not as strong and did not continue throughout the whole growth as in the case of the partially relaxed superlattice. As a result, the complete termination of each of the sublayers could not be guaranteed before switching to the next sublayer for fully strained superlattice. The EELS line scansReference Kemik, Gu, Yang, Chang, Song, Bibee, Mehta, Biegalski, Christen, Browning and Takamura17 for this samples shows an order of magnitude larger interfacial mixing at the LSFO/LSMO interfaces than the partially relaxed superlattice. This chemical intermixing could minimize the interfacial strain energy of the superlattices, which arises due to difference in lattice constants between bulk LSMO and LSFO, and thereby preventing the strain relaxation from occurring. Therefore, it can be concluded that the surface quality and growth mode of the film are crucial influencing factors for the strain relaxation of these perovskite oxide superlattices.
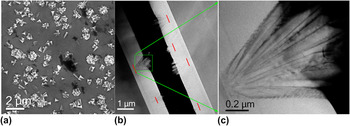
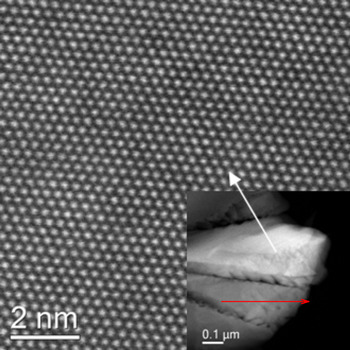
When the thickness of the superlattices was increased to the micrometer scale, a different type of defect structure was observed. Figure 4(a) shows a scanning electron microscope (SEM) image of a micrometer thick [6LSFO][6LSMO] superlattice showing the formation of a high density of “nanoflowers” and cracks/pinholes. The cracks/pinholes appear as black gaps of varying size located in the film between/with the bright nanoflowers. In the superlattice regions between the nanoflowers, the [6LSFO][6LSMO] superlattice repeats are maintained throughout the film thickness. Most noteworthy, the XRD measurements (Fig S1) show that this micrometer-thick superlattice is strain-relaxed with a nearly cubic lattice however, atomic resolution images (Fig. S3) show that no defect contours or stacking faults are present in the superlattice regions between the nanoflowers suggesting that the nanoflowers and cracks effectively relieve the strain. The HAADF Z-contrast images [Fig. 4(b)] reveal that under the prolonged growth time (∼24 h) used for this sample, these nanoflowers begin to form once the film thickness reaches ∼250 nm and they extend out of the surface of the film by several hundred nanometers. Smaller nanoflowers, which consist of only a few petals, were initiated later in the growth process. Figure 4(c) shows a magnified image of one of the nanoflowers. EELS analysis showed that these nanoflowers are essentially a nonuniform solid solution of (La, Sr)(Fe, Mn)O3 without the discrete interfaces perpendicular to the growth direction which characterize the normal superlattice regions among the nanoflowers. Figure 5 illustrates overview and atomic resolution images of one of the petals of the nanoflowers tilted to its closest zone axis such that its contrast is enhanced by the electron channeling effect.Reference Loane, Kirkland and Silcox29 This zone axis differs from the <001> zone axis of the normal superlattice region by around 5–10° (α and β tilts). The nearest atomic distance within the nanoflowers is 3.19 Å, which corresponds well to the nearest atomic distance of the <111> zone axis projection of a cubic perovskite structure with a lattice parameter ∼3.9 Å. Based on the bulk lattice parameters of LSMO and LSFO, a lattice parameter, a = 3.9 Å corresponds well to the expected value for the solid solution of (La, Sr)(Fe, Mn)O3. Each petal of the nanoflower has a different tilt angle compared with its neighboring petals. The nanoflower petals are characterized by faceted edges with {110} termination. It was previously reported that the formation of oxygen vacancies could stabilize the formation of (110) perovskite surfaces.Reference Mastrikov, Heifets, Kotomin and Maier30
(a) SEM plane-view image; (b) overview of the cross section Z-contrast image of the micrometer-thick [6LSFO][6LSMO]10 superlattice; the red lines mark the nucleation point of the nanoflowers; and (c) higher magnification image of the region within the green rectangle in (b). (Image (b) and (c) were acquired using the JEOL 2100 at 200 kV with collection semi angles of 60–160 mrads).

Atomic resolution Z-contrast image of one of the petals of the nanoflower tilted to its closest zone axis-<111> zone axis. The inset shows an overview image. (Images were acquired using JEOL 2100 at 200 kV with collection semi angles of 60–160 mrads) Red arrow indicates the growth direction of the superlattice.

The fact that the orientation of a given nanoflower petal differs from the normal film region as well as its neighboring petals indicates that the nanoflower growth initiates from one or more disoriented islands on the film surface. As the growth proceeds, the disoriented petals grow larger and more petals begin to form. The formation of the nanoflowers depends on the balance of the total system energy, including misfit strain energy, interface energy between the LSFO/LSMO sublayers, and surface energy associated with the surface area of the nanoflowers. The fact that the nanoflowers extend beyond the normal film region by several hundred nanometers suggests a fast growth rate for the petals and that nanoflower formation without discrete interfaces is more energetically favorable than the normal superlattice. Due to the difference in the lattice parameters of bulk LSMO and LSFO, a large misfit strain energy and interface energy accumulate in the superlattice due to the large number of interfaces. Both of these energies are eliminated or reduced significantly by the formation of the (La, Sr)(Fe, Mn)O3 solid solution nanoflowers. Once formed, the large surface area of 3D nanoflowers in comparison to the 2-D surface of the normal film region, leads to the fact that the flux of LSFO (or LSMO) species is insufficient to fully saturate the exposed surface before switching to the LSMO (LSFO) target. Therefore, the formation of the solid solution is further promoted.
In micrometer-thick samples where the growth rate was increased to ∼85 pulses per monolayer of LSMO and ∼130 pulses per monolayer of LSFO by increasing the laser spot size, the nanoflower and crack formation is greatly suppressed, presumably due to the reduced growth time (12–13 h). In this case, the main strain relaxation mechanism appears to be the formation of dislocations along the substrate/film interface. Because the misfit dislocations have relieved the strain energy from the substrate, the driving force for the formation of nanoflowers and cracks has been reduced. Annealing of this one micrometer-thick superlattice at the deposition temperature (700 °C) for 14 h after the deposition did not result in the formation of nanoflowers. Therefore, these results suggest that the nanoflower formation is a kinetically driven process during the PLD growth.
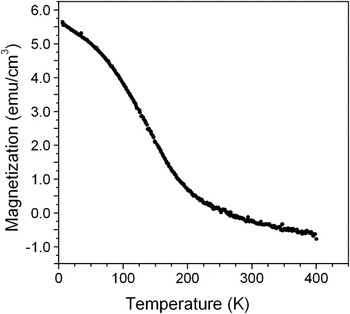
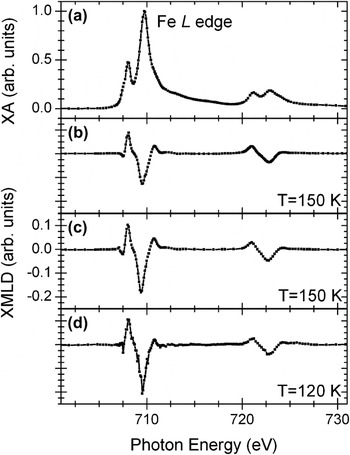
Soft x-ray magnetic spectroscopy and bulk magnetometry were performed to determine the FM and AFM properties of the superlattices (Figs. 6 and 7). XMCD and XMLD spectraReference de Groot31 enable the element-specific and near-surface (∼5–10 nm) analysis of FM and AFM properties using circularly and linearly polarized x-rays, respectively. No appreciable magnetization was observed by bulk magnetometry or Fe/Mn XMCD for either [6LSFO][3LSMO]10 superlattices between 10—300 K. For the micrometer-thick [6LSFO][6LSMO] superlattice (Fig. 6), A weak bulk ferromagnetism is observed which gradually disappears by 200 K. These results are in agreement with previous results on LSFO/LSMO superlattices.Reference Takamura, Yang, Kemik, Arenholz, Biegalski and Christen2, Reference Huijben, Martin, Chu, Holcomb, Yu, Rijnders, Blank and Ramesh32 The LSFO sublayers in all the superlattices display AFM properties at low temperature ∼150 K, however, the magnitude of the XMLD signal is reduced in the case of the fully strained [6LSFO][3LSMO]10 superlattice (Fig. 7). Therefore, these results demonstrate that the AFM properties of perovskite oxides are suppressed by epitaxial strain.
Magnetization as a function of temperature for the micrometer-thick [6LSFO][6LSMO] superlattice. (The magnetization calculation is based on the LSMO sublayer volume only).

(a) XA spectra and XMLD spectra for (b) fully strained and (c) partially relaxed [6LSFO][3LSMO]10 superlattices, and (d) micrometer-thick [6LSFO][6LSMO] superlattice.

The multifunctional properties of the perovksite oxides are highly dependent on the strain state and the presence of defects.Reference Takamura, Chopdekar, Arenholz and Suzuki33–Reference Moreno, Abellán, Hassini, Ruyter, del Pino, Sandiumenge, Casanove, Santiso, Puig and Obradors35 The biaxial strain imposed from the underlying substrate causes tetragonal distortions and rotations of the BO6 octahedral and therefore changes to the B—O bond angles and bond distances. For LSMO, increasing resistivity and decreasing saturation magnetization and Curie temperatures have been reported with increasing tetragonal distortion.Reference Takamura, Chopdekar, Arenholz and Suzuki33, Reference Konishi, Fang, Izumi, Manako, Kasai, Kuwahara, Kawasaki, Terakura and Tokura34, Reference Yang, Kemik, egalski, Christen, Arenholz and Takamura36 On the other hand, the extra (La,Sr)O plane at the stacking fault may cut off the electron hopping path along chains of B—O—B. Furthermore, the valence states of the transition metal element is one of the determining factors in the strength and sign of the exchange interactions.Reference Goodenough10 Thus, the conductivity of the superlattices is expected to decrease whereas the FM/AFM properties will tend to become partially localized due to the barrier of the stacking faults. However, the strain-relaxed lattice showed more robust AFM ordering than the fully strained superlattices, which indicates that strain relaxation has a stronger effect on the multifunctional properties than the presence of the stacking faults. Therefore, we find that both strain relaxation and defect formation must be taken into account for controlling the properties of complex oxide superlattices.
IV. CONCLUSIONS
In conclusion, we have used scanning transmission electron microscopy to observe the defect structures formed as a result of strain relaxation in perovskite oxide superlattices. The relief of the biaxial epitaxial strain for thin superlattices occurred through the formation of 2-D stacking faults, whereas in thick superlattices, either dislocations along the film/substrate interface or the combination of nanoflowers and cracks/pinholes were formed. Strain relaxation was shown to depend on the substrate surface quality and the specific details of the growth process, including the extent of the thermal processing. The resulting strain state and defect structures have a pronounced effect on the functional properties of the superlattices, and therefore are critical parameters to consider when optimizing the growth of complex oxide superlattice at atomic scale.
ACKNOWLEDGMENTS
The authors thank Dr. Bin Jiang (FEI) for technical support with the alignment of the TEAM 0.5 microscope at NCEM. The characterization work at UC Davis was supported by the National Science Foundation (Contract No. DMR-747896) and the electron microscopy by the Department of Energy, Office of Basic Energy Sciences, Division of Materials Science and Engineering under (Contract No. DE-FG0203ER46057). The work performed at NCEM and ALS is supported by the Office of Science, Office of Basic Energy Sciences of the U.S. Department of Energy under Contract No. DE-AC02-05CH11231. Part of this research was conducted at the Center for Nanophase Materials Sciences, which is sponsored at Oak Ridge National Laboratory by the Office of Basic Energy Sciences, U.S. Department of Energy.