1. Introduction
In fluid dynamics applications such as ensemble weather prediction and climate simulation, when the time scales of interest are long compared with the Lyapunov time, the goal of numerical simulations is to accurately sample an evolving probability density function of the solution. In general both the intermediate and steady-state distributions are unknown, following in a complex way from forcing and dissipation at various scales.
To obtain accurate statistical information from numerical simulations, both the physical model and its discretization should be unbiased. Much effort has been invested in designing numerical methods that reflect physical conservation laws of energy, enstrophy, momentum and others, which are known to have a strong effect on statistics, see Abramov & Majda (Reference Abramov and Majda2003) and Dubinkina & Frank (Reference Dubinkina and Frank2007, Reference Dubinkina and Frank2010). Numerical truncation errors are often treated as random variables (Evensen Reference Evensen2009) with a known (e.g. zero-mean normal) distribution. Recent improvements in the understanding of numerical methods, specifically the development of backward error analysis (Leimkuhler & Reich Reference Leimkuhler and Reich2004; Hairer, Lubich & Wanner Reference Hairer, Lubich and Wanner2006), allow interpretation of the numerical solution as the exact solution of a modified system of equations. The modified equations typically admit their own (modified) invariant measure, and numerical truncation errors therefore bias the statistics obtained in simulation according to this altered statistical distribution. Thus, numerical methods imply structural bias due to numerical truncation, even in the idealized setting where the continuum model is assumed complete.
As a precursor to accurately sampling an evolving measure, it is essential that the numerical method accurately sample a stationary invariant measure in the absence of forcing and dissipation, to facilitate a correct response from the system to perturbations from equilibrium; however, even this requirement is typically not fulfilled, as has been observed in numerical investigations of simple two-dimensional ideal fluids models. In Dubinkina & Frank (Reference Dubinkina and Frank2007) it was shown that the equilibrium statistical mechanics of finite difference discretizations of quasigeostrophic vorticity flow over topography are sensitive to the preservation of kinetic energy and (quadratic) enstrophy. Even in the idealized setting of unforced, inviscid two-dimensional flow, a correct sampling of non-Gaussian statistics requires specialized techniques (Abramov & Majda Reference Abramov and Majda2003; Dubinkina & Frank Reference Dubinkina and Frank2010), and much less is known about the accuracy of sampling the non-equilibrium steady states treated in this paper.
In the fluid dynamics setting, several equilibrium models are known. For unforced, ideal fluids in two dimensions, the Miller–Robert–Sommeria measure (Miller Reference Miller1990; Robert Reference Robert1991; Robert & Sommeria Reference Robert and Sommeria1991), which encodes the area distribution of the vorticity field, is well established (Bouchet & Venaille Reference Bouchet and Venaille2012). In fluctuating hydrodynamics, the Landau–Lifshitz–Navier–Stokes equations are provably ergodic with respect to the Boltzmann–Gibbs distribution of kinetic energy under a fluctuation–dissipation relation and stochastic forcing (E & Mattingly Reference E and Mattingly2001; E, Mattingly & Sinai Reference E, Mattingly and Sinai2001; Donev et al. Reference Donev, Vanden-Eijnden, Garcia and Bell2010; Delong et al. Reference Delong, Griffith, Vanden-Eijnden and Donev2013). For the geophysically relevant regime of fixed-wavelength stationary forcing and viscous dissipation, fluids in the atmosphere and ocean are believed to sample a non-equilibrium steady state in which the kinetic energy spectrum satisfies a power law over a range of length scales, as posited by Kolmogorov (Leith Reference Leith1968; Batchelor Reference Batchelor1969; Kraichnan Reference Kraichnan1971; Frisch Reference Frisch1995; Tulloch & Smith Reference Tulloch and Smith2006). In this case no equilibrium measure is explicitly known, but in the probabilistic setting a stationary expectation, which is suggestive of an equilibrium state, can be observed from measurements in the atmosphere namely the power-law spectrum for kinetic energy (Nastrom, Gage & Jasperson Reference Nastrom, Gage and Jasperson1984).
Power-law kinetic energy spectra can be simulated using forced Navier–Stokes discretizations at operational resolutions, but this typically requires the introduction of a viscosity coefficient that far exceeds that encountered in atmosphere/ocean science applications in nature. In practice, higher-order hyperviscosity is used because it has a more localized effect on the spectrum. Excessive numerical viscosity is believed to adversely affect the simulated growth of small-scale physical instabilities as well as inhibiting spread in ensemble simulations (Kent, Thuburn & Wood Reference Kent, Thuburn and Wood2012; Thuburn, Kent & Wood Reference Thuburn, Kent and Wood2014). Our numerical experiments bear this out, as we observe the influence of numerical viscosity on autocorrelation functions and the information content of ensembles.
Turbulent backscatter methods have been introduced in (Domaradzki & Saiki Reference Domaradzki and Saiki1997; Shutts Reference Shutts2005; Berner et al. Reference Berner, Shutts, Leutbecher and Palmer2009) to re-inject kinetic energy at viscous length scales, and by (Jansen & Held Reference Jansen and Held2014) to re-inject energy in the large-scale flow. Alternatively, ‘superparameterization’ methods (Xing, Majda & Grabowski Reference Xing, Majda and Grabowski2009; Grooms & Majda Reference Grooms and Majda2013) have been proposed as an intermediate alternative to large eddy simulations. In these, eddy dynamics are modelled by either a simplified dynamics or a stochastic closure model. In this paper we adopt an extreme statistical simplification of the fine-scale model, coupling it via thermostatic controls to directly impose a background power-law kinetic energy spectrum at the smallest resolved scales. Our approach, which is suitable for spectral truncations, allows us to maintain a given target without employing artificially increased viscosity. The energy spectrum we impose can be taken from observational data, theory or higher-resolution simulations. In the case of atmospheric turbulence the measurements by Nastrom & Gage (Reference Nastrom and Gage1985) provide such data. In two-dimensional forced-dissipated Navier–Stokes it may also be taken from theoretical predictions (Leith Reference Leith1968; Batchelor Reference Batchelor1969; Kraichnan Reference Kraichnan1971).
The remainder of this paper is organized as follows. In the following section the incompressible two-dimensional Navier–Stokes equations, with forcing and dissipation, are recalled in their vorticity form. In § 3 we develop a feedback control for small-scale kinetic energy, by adapting the Nosé–Hoover method, commonly used to ergodically sample the Gibbs distribution in molecular dynamics. The Nosé–Hoover control is then applied to two-dimensional turbulence simulations in §§ 4 and 5; the former is a simulation with large-scale random forcing and forward enstrophy cascade and the latter is a simulation augmented with additional, small-scale forcing that is unresolved due to spectral truncation. Both of these sections include statistic and dynamic results of the new approach. A short discussion of similar methods and possible practical applications in § 6 concludes the paper.
2. Two-dimensional turbulence
We focus on driven two-dimensional incompressible flow. Ignoring rotation and topographical effects, we work with the Navier–Stokes equations on a doubly periodic domain
 $\boldsymbol{x}\in \mathbb{T}^{2}$
. The two-dimensional Navier–Stokes equations with forcing
 $f(\boldsymbol{x},t)$
and generalized viscosity model are
 $$\begin{eqnarray}{\it\omega}_{t}+J({\it\psi},{\it\omega})=f+{\it\nu}_{-1}\bar{{\it\Delta}}^{-1}{\it\omega}-{\it\nu}_{p}(-\!{\it\Delta})^{p}{\it\omega},\quad {\rm\Delta}{\it\psi}={\it\omega},\end{eqnarray}$$
where
 ${\it\psi}(\boldsymbol{x},t)$
is the stream function and
 ${\it\omega}(\boldsymbol{x},t)$
is the vorticity component normal to the plane,
 ${\it\Delta}$
is the Laplace operator and
 $\bar{{\it\Delta}}^{-1}$
denotes scale-selective damping (see the following). In this paper we use either physical viscosity
 $p=1$
or fourth-order hyperviscosity
 $p=4$
. The nonlinearity
 $J({\it\psi},{\it\omega})$
is defined by
 $$\begin{eqnarray}J({\it\psi},{\it\omega})=\frac{\partial {\it\psi}}{\partial x}\frac{\partial {\it\omega}}{\partial y}-\frac{\partial {\it\psi}}{\partial y}\frac{\partial {\it\omega}}{\partial x}.\end{eqnarray}$$
Equation (2.1) is discretized using a pseudo-spectral method (Canuto et al. Reference Canuto, Hussaini, Quarteroni and Zang2006), expressing the vorticity field in terms of its Fourier components
 $$\begin{eqnarray}{\it\omega}_{\boldsymbol{k}}=\frac{1}{(2{\rm\pi})^{2}}\int _{\mathbb{T}^{2}}{\it\omega}(\boldsymbol{x})\text{e}^{-\text{i}\boldsymbol{k}\boldsymbol{\cdot }\boldsymbol{x}}\,\text{d}\boldsymbol{x},\quad |\boldsymbol{k}|_{\infty }\leqslant K,\end{eqnarray}$$
where
 $\boldsymbol{k}=(k_{1},k_{2})$
is an index vector and we use the notation
 $|\boldsymbol{k}|=(k_{1}^{2}+k_{2}^{2})^{1/2}$
and
 $|\boldsymbol{k}|_{\infty }=\max \{|k_{1}|,|k_{2}|\}$
. In terms of its Fourier components, equation (2.1) is written
 $$\begin{eqnarray}\dot{{\it\omega}}_{\boldsymbol{k}}+J_{\boldsymbol{k}}({\bf\omega})=f_{\boldsymbol{k}}+{\it\nu}_{-1}\bar{{\it\Delta}}_{\boldsymbol{k}}^{-1}{\it\omega}_{\boldsymbol{k}}-{\it\nu}_{p}{\it\Delta}_{\boldsymbol{k}}^{p}{\it\omega}_{\boldsymbol{k}},\end{eqnarray}$$
where
 ${\it\Delta}_{\boldsymbol{k}}=-|\boldsymbol{k}|^{2}$
and the scale-selective damping is defined by
 $$\begin{eqnarray}\displaystyle \bar{{\it\Delta}}_{\boldsymbol{k}}^{-1}=\left\{\begin{array}{@{}ll@{}}-|\boldsymbol{k}|^{-2}, & |\boldsymbol{k}|\leqslant 3\\ 0, & \text{otherwise}.\end{array}\right. & & \displaystyle\end{eqnarray}$$
The nonlinear term
 $J_{\boldsymbol{k}}({\bf\omega})$
represents the pseudo-spectral evaluation of (2.2) on a uniform
 $2K\times 2K$
grid, implementing a standard
 $3/2$
filter to avoid aliasing due to quadratic terms (Canuto et al.
Reference Canuto, Hussaini, Quarteroni and Zang2006).
Our computational set-up is similar to that of Gotoh (Reference Gotoh1998). Scale-selective damping is restricted to those modes with
 $|\boldsymbol{k}|\leqslant 3$
to curtail the inverse cascade of energy. The forcing is Gaussian white noise in time and applied in a band of energy shells with
 $3.5<|\boldsymbol{k}|<6.5$
. For the simulations of § 5, small-scale random forcing is additionally applied in the range
 $202.5<|\boldsymbol{k}|<206.5$
.
The viscous terms in (2.4) have typical length scales defined by the wavenumber magnitudes for which the coefficients
 ${\it\nu}_{p}{\it\Delta}_{\boldsymbol{k}}^{p}$
have magnitude unity. By using
 ${\it\Delta}_{\boldsymbol{k}}=-|\boldsymbol{k}|^{2}$
we find the diffusive length scale
 $k_{d}=\sqrt{{\it\nu}_{1}}^{-1}$
for
 $p=1$
and damping length scale
 $k_{h}=\sqrt{{\it\nu}_{-1}}$
. Assume that these two scales are sufficiently well separated,
 $k_{d}\gg k_{h}$
, and that forcing acts primarily at some intermediate length scale. In this setting it is expected that the hypothesis of Kraichnan (Reference Kraichnan1967) holds and that there is a steady flux of energy from the forcing wavenumbers to larger scales (i.e. the inverse energy cascade), as well as a steady enstrophy flux to smaller scales (i.e. the direct enstrophy cascade). These cascades terminate when the dissipative scales
 $k_{h}$
and
 $k_{d}$
are reached, but with sufficient separation between forcing and dissipation scales there persist a range of wavenumbers of statistically stationary energy and enstrophy transport. Because the dynamics in these ranges is almost unaffected by damping and forcing, they are dubbed inertial ranges. The steady fluxes of energy (respectively enstrophy) in both regimes yield power-law energy spectra.
This means the energy in wavenumbers near
 $k$
, given by
 $$\begin{eqnarray}E_{k}({\bf\omega})=-\frac{1}{2}\mathop{\sum }_{k-(1/2)<|\boldsymbol{k}|<k+(1/2)}{\it\Delta}_{\boldsymbol{k}}^{-1}{\it\omega}_{\boldsymbol{k}}{\it\omega}_{\boldsymbol{k}}^{\ast },\end{eqnarray}$$
satisfies on average an approximate power law (time average denoted by overbar)
 $$\begin{eqnarray}\bar{E}_{k}\approx C{\it\varepsilon}^{2/3}k^{-5/3}\quad \text{for }k\ll k_{f},\end{eqnarray}$$
in the inverse energy cascade, and
 $$\begin{eqnarray}\bar{E}_{k}\approx C{\it\eta}^{2/3}k^{-3}\quad \text{for }k\gg k_{f},\end{eqnarray}$$
in the direct enstrophy cascade. The parameters
 ${\it\varepsilon}$
and
 ${\it\eta}\approx k_{f}^{2}{\it\varepsilon}$
denote the energy and enstrophy injection rates (Bofetta & Musacchio Reference Bofetta and Musacchio2010). Using analysis of structure functions, Lindborg (Reference Lindborg1999) concludes that a
 $k^{-3}$
inertial spectrum is plausible under two-dimensional turbulence assumptions, but that a
 $k^{-5/3}$
range cannot be so explained. In numerical simulations, various other power laws are observed (see references below). The methodology we propose makes no assumptions on the functional form of the kinetic energy spectrum and is therefore applicable to any observed spectrum. We demonstrate this by using the method in a forced-dissipated turbulence cascade in § 4 and in a case with both large- and small-scale stochastic forcing in § 5. The versatility of the method also promises straightforward generalization to three-dimensional turbulence.
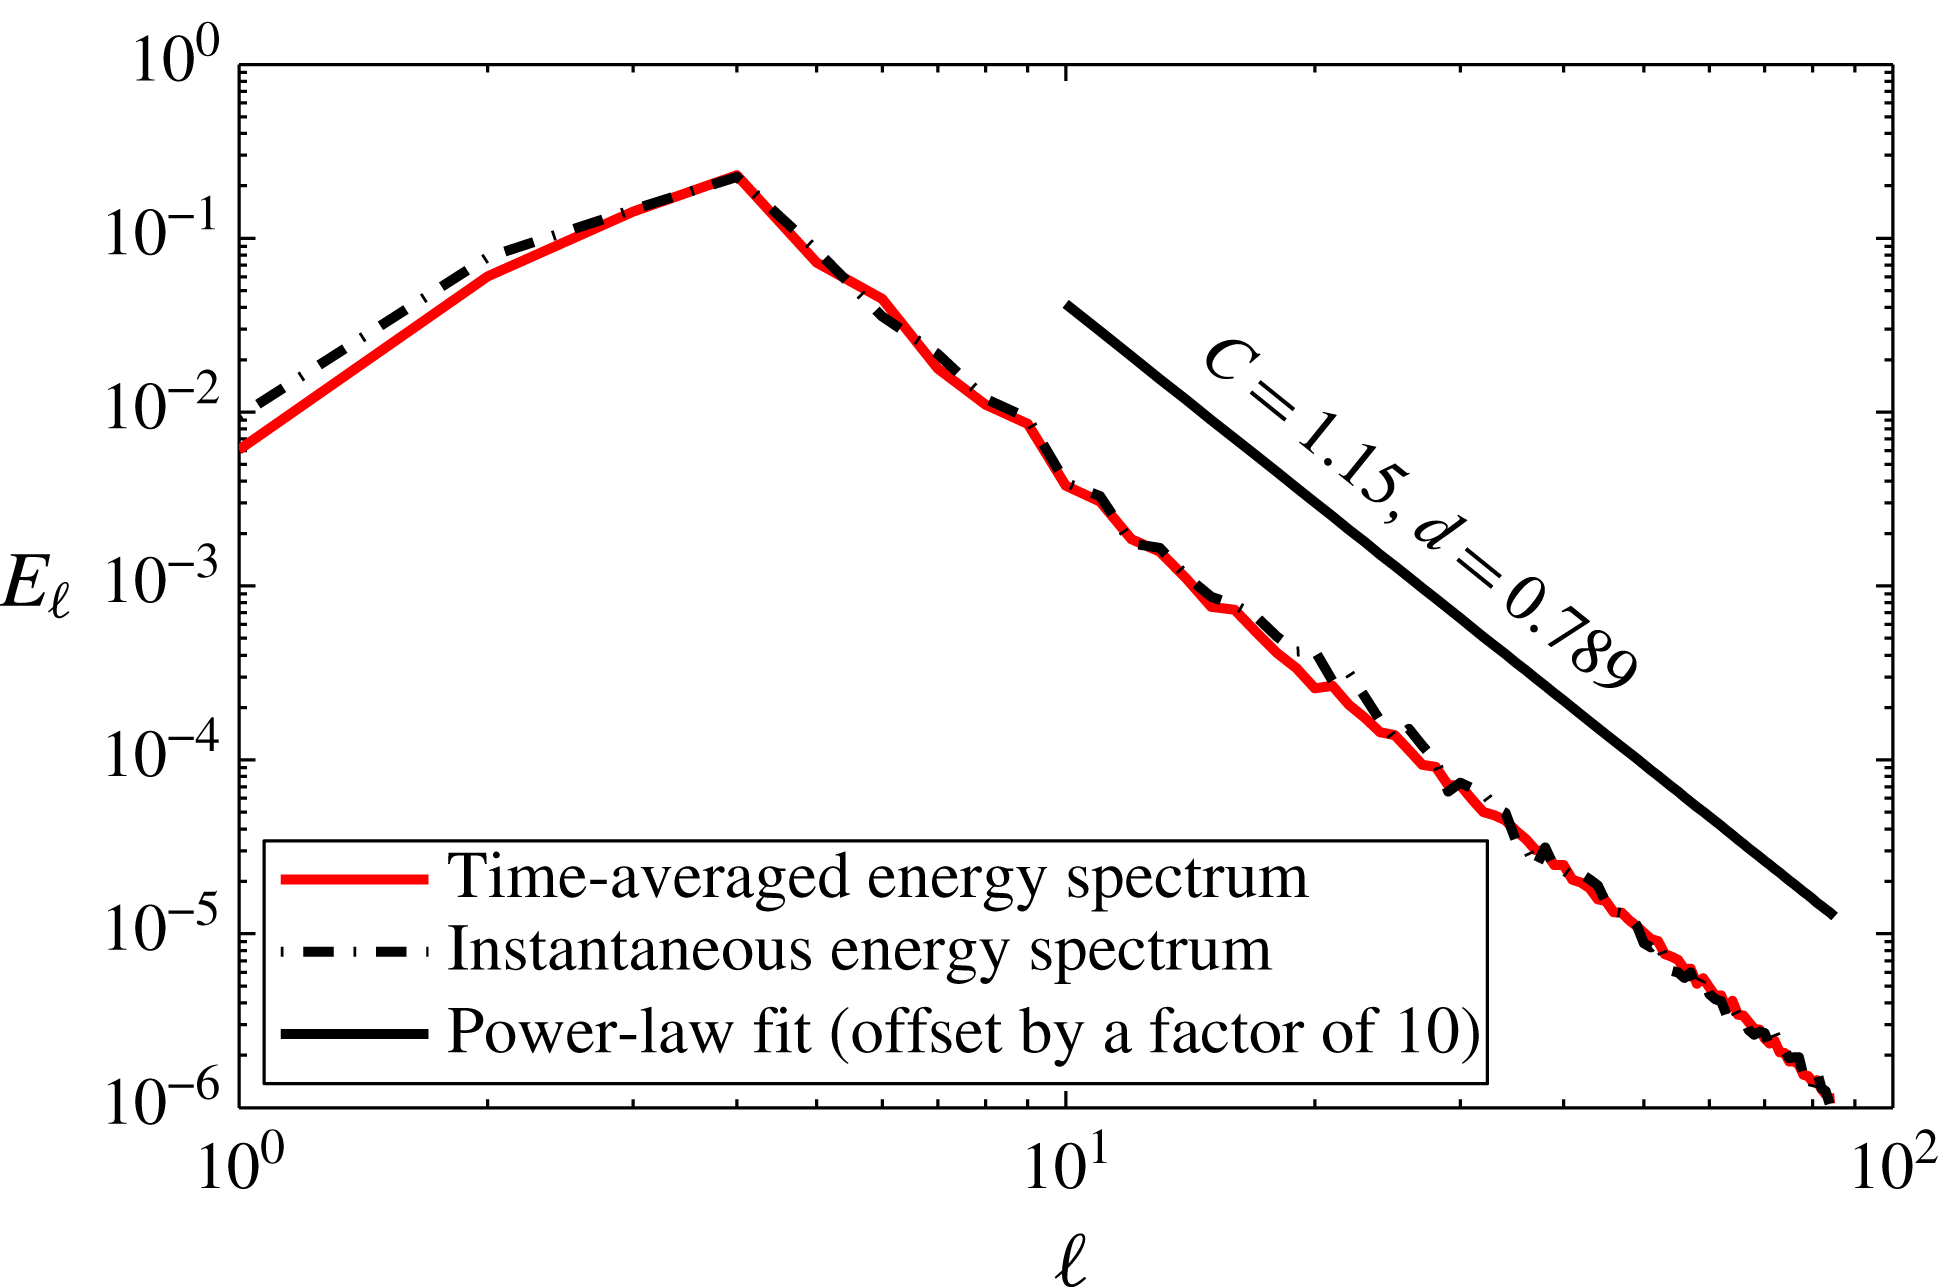
Two-dimensional turbulence kinetic energy spectrum and power-law fit. Simulation parameters are given in the ‘Reference’ column of table 1.

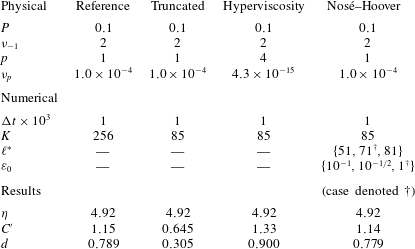
The effect of spectral truncation on the kinetic energy spectrum is most pronounced in the inertial enstrophy regime. To save computational effort, we design our simulation with small separation between the scales of forcing and large-scale damping. Such a parameter set is given in the column labeled ‘Reference’ of table 1. This simulation yields an inertial range power spectrum as depicted in figure 1. The figure shows both the instantaneous spectrum and the time-averaged spectrum after
 $50$
time units, corresponding to over 250 eddy turnovers. The computed energy spectrum is steeper than the hypothesized
 $k^{-3}$
slope. This is common in numerical simulations and is usually attributed to insufficiently large Reynolds number due to limited resolution (Gotoh Reference Gotoh1998; Bracco et al.
Reference Bracco, McWilliams, Murante, Provenzale and Weiss2000; Bofetta & Musacchio Reference Bofetta and Musacchio2010). Saffman (Reference Saffman1971) proposes a
 $k^{-4}$
spectrum due to vortex filamentation and small-amplitude front formation. Farazmand, Kevlahan & Protas (Reference Farazmand, Kevlahan and Protas2011) suggest that numerical simulations differ from the hypothesized spectra not due to insufficient resolution, but due to the choice of forcing. They investigate forcing functions that yield the hypothesized
 $k^{-5/3}$
and
 $k^{-3}$
power-law regimes. This is in line with the findings of Danilov & Gurarie (Reference Danilov and Gurarie2000), who demonstrate that power-law spectra can only be observed for a special set of external parameters. Farge et al. (Reference Farge, Kevlahan, Perrier and Goirand1996) use wavelet methods to analyse turbulent velocity fields and define a local energy spectrum. They discover that the
 $k^{-3}$
energy spectrum only holds outside of regions of strong vorticity and shear layers. Inside those regions the energy spectrum scales as
 $k^{-6}$
and
 $k^{-4}$
, respectively. Sukoriansky, Galperin & Chekhlov (Reference Sukoriansky, Galperin and Chekhlov1999) find that the forward enstrophy cascade spectral slope depends directly on the chosen large-scale drag.
Parameters and results for the simulation of two-dimensional turbulence. A supplementary movie showing the evolution and chaotic divergence of the turbulent simulations is available at http://dx.doi.org/10.1017/jfm.2015.526.

We fit a power law to the observed (steeper) spectrum in the form suggested by Gotoh (Reference Gotoh1998)
 $$\begin{eqnarray}\bar{E}_{k}\approx C^{\prime }{\it\eta}^{2/3}k^{-3-d},\end{eqnarray}$$
using a least-squares approach. The newly introduced parameter
 $d$
indicates a deviation from the theoretical slope. Even though the power law that develops for a given parameter set in (2.1) is different from the theoretical spectrum, it is still independent of the chosen initial conditions. This is evidence that the dynamics are ergodic and motivates consideration of the invariant measure of the dynamical system, analogous to such considerations in molecular dynamics. The following section outlines the tools used in molecular dynamics and their application to two-dimensional turbulence.
3. A thermostat-based feedback control for the kinetic energy spectrum
3.1. Invariant measures and expectations for two-dimensional turbulence
The tendency of forced-dissipated turbulence to develop a power-law spectrum independent of initial conditions provides evidence that the dynamics may sample a unique invariant measure. Ergodicity of finite truncations of the forced-dissipated two-dimensional Navier–Stokes equations is proven by E & Mattingly (Reference E and Mattingly2001) for the case of stochastic forcing of only two long wave modes,
 $\boldsymbol{k}_{1}=(1,1)$
and either
 $\boldsymbol{k}_{2}=(1,0)$
or
 $\boldsymbol{k}_{2}=(0,1)$
. Their analysis may be readily adapted to show ergodicity under the more general forcing of arbitrary wavenumbers
 $\boldsymbol{k}_{1}$
and
 $\boldsymbol{k}_{2}$
along with
 $\boldsymbol{k}_{1}+(1,0)$
and
 $\boldsymbol{k}_{2}+(0,1)$
. Our proposed forcing of selected bands in Fourier space meets this criterion.
Our interest lies in the practical case where computational costs prohibit resolving a sufficient number of modes to capture small-scale dissipation. This is the case in many large-scale atmosphere and ocean applications. The computational load is determined by restricting the Fourier expansion in (2.3) to those modes with
 $|\boldsymbol{k}|\leqslant K$
. Denote the truncated vector of vorticity coefficients by
 ${\bf\omega}_{K}$
, and the full Fourier transform by
 ${\bf\omega}_{\infty }$
. If the resolution
 $K$
is insufficiently large to capture the diffusion of enstrophy at the scale
 $k_{d}$
, the dynamics of the truncated system will differ greatly from those in a system that is well resolved.
Stochastic approaches to model the effect of the unresolved degrees of freedom focus on the dynamical interaction between resolved and unresolved modes (see for instance Zwanzig Reference Zwanzig1961; Mori Reference Mori1965; Hasselmann Reference Hasselmann1976; Majda, Timofeyev & Vanden Eijnden Reference Majda, Timofeyev and Vanden Eijnden2001; Fatkullin & Vanden-Eijnden Reference Fatkullin and Vanden-Eijnden2004). Here, we instead focus on correcting the statistics of the truncated system, as embodied in its invariant distribution and expectations.
Suppose that the truncated vorticity dynamics
 ${\bf\omega}_{K}(t)$
ergodically samples an invariant probability density
 ${\it\rho}_{K}$
(i.e.
 ${\bf\omega}_{K}(t)\sim {\it\rho}_{K}$
). Ideally, for correct sampling we would require
 ${\it\rho}_{K}$
to be equal to the marginal distribution of the resolved modes in the non-truncated case. Let us introduce a partition
 ${\bf\omega}_{\infty }=(\hat{{\bf\omega}},\tilde{{\bf\omega}})$
where
 $\hat{{\bf\omega}}$
consists of modes resolved by the numerical truncation with
 $|\boldsymbol{k}|<K$
and
 $\tilde{{\bf\omega}}$
for the unresolved modes. For equivalence between the invariant measures of the two systems, we would require
 ${\it\rho}_{K}$
to be equal to the marginal density
 $$\begin{eqnarray}\hat{{\it\rho}}=\int {\it\rho}_{\infty }(\hat{{\bf\omega}},\tilde{{\bf\omega}})\,\text{d}\tilde{{\bf\omega}}.\end{eqnarray}$$
However, steady solutions to the Fokker–Planck equation for general forced-dissipated turbulence are not explicitly available, due to the inherent complexity of the nonlinear wave interactions.
Alternatively one may focus attention on expectations in the unknown measures. If the phase flow is ergodic with respect to an invariant density
 ${\it\rho}$
, then for almost any initial condition, the time average of an observable function
 $a({\bf\omega})$
of the solution,
 $$\begin{eqnarray}\bar{a}=\lim _{T\rightarrow \infty }\frac{1}{T}\int _{0}^{T}a({\bf\omega}(t))\,\text{d}t,\end{eqnarray}$$
is equal to the expectation or ensemble average with respect to the density
 ${\it\rho}$
,
 $$\begin{eqnarray}\displaystyle \langle a\rangle =\int a({\bf\omega})\,{\it\rho}({\bf\omega})\,\,\text{d}{\bf\omega}. & & \displaystyle\end{eqnarray}$$
If the invariant measures
 $\hat{{\it\rho}}$
and
 ${\it\rho}_{K}$
did match, then so would the expectations of arbitrary observables
 $\left\langle a({\bf\omega})\right\rangle$
. Ergodicity of the systems would then also imply equivalent time averages. In this paper we will take the kinetic energy in a range of wavenumber shells as a set of observables. Given a truncation
 $K\gg k_{d}$
, the modes
 ${\it\omega}_{\boldsymbol{k}}$
with
 $k_{f}\ll |\boldsymbol{k}|\ll k_{d}$
should revert to a power-law spectrum due to the forward enstrophy cascade. For a system truncated well below the viscous scale
 $K\ll k_{d}$
, the downscale cascade of enstrophy is terminated abruptly, resulting in an artificial build-up of enstrophy at the smallest resolved scales known as spectral blocking. An inaccurate energy spectrum in the highest wavenumbers eventually leads to deviation from the power-law spectrum in the energy range, i.e. in the large scales (Sukoriansky et al.
Reference Sukoriansky, Galperin and Chekhlov1999).
Within the field of molecular dynamics a number of methods have been developed for perturbing the trajectories of dynamical systems to correct the invariant distribution (and thereby expectations) for unresolved degrees of freedom. Such methods include Langevin dynamics and Nosé–Hoover thermostats (Allen & Tildesley Reference Allen and Tildesley1989; Frenkel & Smit Reference Frenkel and Smit2002).
3.2. Canonical sampling and temperature control in molecular dynamics
The dynamics of a classical molecular system are governed by a Hamiltonian system
 $$\begin{eqnarray}\displaystyle & \dot{\boldsymbol{q}}=\boldsymbol{p}, & \displaystyle\end{eqnarray}$$
 $$\begin{eqnarray}\displaystyle & \dot{\boldsymbol{p}}=-\boldsymbol{{\rm\nabla}}_{\boldsymbol{q}}V(\boldsymbol{q}), & \displaystyle\end{eqnarray}$$
where
 $\boldsymbol{q}\in \mathbb{R}^{n}$
represents the vector of all particle positions,
 $\boldsymbol{p}\in \mathbb{R}^{n}$
the vector of particle momenta, and unit mass is assumed. The Hamiltonian
 $H(\boldsymbol{q},\boldsymbol{p})=(\Vert \boldsymbol{p}\Vert ^{2}+V(q))/2$
represents the total energy as a sum of kinetic energy
 ${\it\kappa}(\boldsymbol{p})=(\Vert \boldsymbol{p}\Vert ^{2})/2$
and potential energy
 $V(\boldsymbol{q})$
. Given an initial condition with total energy
 $H_{0}$
, a solution is confined to the constant energy surface
 $H(\boldsymbol{q}(t),\boldsymbol{p}(t))=H_{0}$
. If the flow is ergodic, then the associated invariant measure is singular, corresponding to a Dirac measure on the constant energy surface.
If instead one considers a molecular system that resides in a state of thermal equilibrium with a heat reservoir at (statistical) temperature
 ${\it\beta}^{-1}$
, the total energy is no longer conserved. Instead the time-averaged kinetic energy satisfies
 $$\begin{eqnarray}\displaystyle \bar{{\it\kappa}}=\frac{n}{2}{\it\beta}^{-1}, & & \displaystyle\end{eqnarray}$$
and trajectories of the system ergodically sample the Gibbs density
 $$\begin{eqnarray}{\it\rho}_{c}(\boldsymbol{q},\boldsymbol{p})\propto \text{e}^{-{\it\beta}H(\boldsymbol{q},\boldsymbol{p})}.\end{eqnarray}$$
When the flow is ergodic in this measure the temperature is related to the canonical mean
 $\bar{{\it\kappa}}=\langle {\it\kappa}\rangle =(n/2){\it\beta}^{-1}$
.
To carry out numerical simulations of molecular dynamics at constant energy, there exist numerical methods that (exactly or approximately) preserve the Hamiltonian. Preservation of a quantity such as
 $\bar{{\it\kappa}}$
is more subtle, since it is only conserved ‘on average’. Methods for constant temperature molecular dynamics introduce perturbations to the dynamical equations (3.4)–(3.5) called thermostats. The Nosé–Hoover thermostat (Nosé Reference Nosé1984a
,Reference Nosé
b
; Hoover Reference Hoover1985) augments the dynamics with an extra variable
 ${\it\xi}$
that controls the kinetic energy in the system as follows
 $$\begin{eqnarray}\displaystyle \dot{\boldsymbol{q}} & = & \displaystyle \boldsymbol{p}\end{eqnarray}$$
 $$\begin{eqnarray}\displaystyle \dot{\boldsymbol{p}} & = & \displaystyle -\boldsymbol{{\rm\nabla}}_{\boldsymbol{q}}V(\boldsymbol{q})-{\it\xi}{\it\varepsilon}\boldsymbol{p}\end{eqnarray}$$
 $$\begin{eqnarray}\displaystyle \dot{{\it\xi}} & = & \displaystyle {\it\varepsilon}\left(2{\it\beta}{\it\kappa}(\boldsymbol{p})-n\right)\!,\end{eqnarray}$$
where
 ${\it\varepsilon}$
is a parameter that controls the strength of the perturbation. The Nosé–Hoover method can be interpreted in two ways. First, it is straightforward to verify that the Liouville equation associated to the augmented system (3.8)–(3.10) admits the steady state
 $$\begin{eqnarray}{\it\rho}(\boldsymbol{q},\boldsymbol{p},{\it\xi})\propto {\it\rho}_{c}(\boldsymbol{q},\boldsymbol{p})\text{e}^{-(1/2){\it\xi}^{2}},\end{eqnarray}$$
for which the marginal density with respect to
 $\boldsymbol{q}$
and
 $\boldsymbol{p}$
is clearly the Gibbs density (3.7). Hence, the Nosé–Hoover method enforces the canonical invariant measure. On the other hand, it is also apparent that the variable
 ${\it\xi}$
acts as a damping coefficient for kinetic energy when
 ${\it\xi}>0$
and excites kinetic energy for
 ${\it\xi}<0$
. Furthermore, (3.10) shows that
 ${\it\xi}$
will increase (decrease) when
 $2{\it\kappa}(\boldsymbol{p})/n$
exceeds (falls short of) the target temperature
 ${\it\beta}^{-1}=k_{B}{\it\tau}$
. Hence, the Nosé–Hoover method can also be interpreted as a negative feedback control to enforce a particular expectation with respect to the invariant measure, namely the temperature. In this paper we adapt the Nosé–Hoover thermostat to enforce a chosen power-law scaling of small-scale wavenumbers; hence, this second interpretation is crucial to our application of the thermostat to fluids.
We would like to emphasize the different objectives for thermostats in molecular dynamics and in fluid turbulence as proposed here. In the molecular dynamics setting, the goal of thermostating is to enforce ergodic sampling of a known target probability density. Hence, ergodicity of the perturbed system is a necessary condition. In contrast, in our application to fluids, we do not require ergodicity and the invariant density is unknown. Instead we enforce adherence to a known target expectation. A secondary objective, which holds in both applications, is that the thermostat contribute only a mild perturbation to trajectories. In molecular dynamics, a more rapid sampling of the Gibbs density can be achieved by directly modifying the momentum equation (3.5) with a stochastic noise term and damping, i.e. Langevin dynamics. However, such a crude perturbation significantly affects time-dependent statistics such as autocorrelation functions (DelSole Reference DelSole2000). By introducing the auxiliary variable
 ${\it\xi}$
, the perturbation becomes a higher-order ‘memory effect’ with the Nosé–Hoover method, and autocorrelation functions are more accurate (Leimkuhler, Noorizadeh & Penrose Reference Leimkuhler, Noorizadeh and Penrose2011).
Another significant difference is that in the setting of constant temperature molecular dynamics, the system truly resides in statistical equilibrium, whereas in many turbulent fluid applications, the power-law spectrum is a background state from which the system may be perturbed by variations in the forcing. Rather than constraining the kinetic energy spectrum, the Nosé–Hoover thermostat effects a mild, second-order relaxation towards the target spectrum, which may be tuned to allow large excursions from this state. In general, a trade-off must be sought between the rate of ergodic sampling and the mildness of the perturbation.
In constant temperature molecular dynamics simulations, at equilibrium, the thermostat variable
 ${\it\xi}$
is normally distributed with mean zero by construction, independent of the unperturbed dynamics. This allows augmentation of the thermostat variable dynamics (3.10) by an Ornstein–Uhlenbeck process without disrupting the invariant measure (Samoletov, Dettmann & Chaplain Reference Samoletov, Dettmann and Chaplain2007). The addition of stochastic forcing in the auxiliary variable makes the thermostat ergodic (Leimkuhler, Noorizadeh & Theil Reference Leimkuhler, Noorizadeh and Theil2009). In the current setting of forced turbulence, we expect the thermostat to remove energy from the system on average to account for energy input through forcing, yet add energy on occasion to account for backscatter. For this reason, we do not know a priori the distribution of the thermostat variable
 ${\it\xi}(t)$
, but we expect it to have non-zero mean. Hence, it is crucial to exclude the stochastic process in the thermostated wavenumbers. Similar arguments were used in a forced molecular model in Jones & Leimkuhler (Reference Jones and Leimkuhler2011).
3.3. Nosé–Hoover thermostat for kinetic energy shells
In this paper, we propose employing the Nosé–Hoover thermostat (3.8)–(3.10) to enforce a power-law spectrum on the kinetic energy in the absence of a mean flow. The kinetic energy spectrum consists of the kinetic energy distributed over energy shells in wavenumber space, see (2.6). A Nosé–Hoover thermostat could be applied to each shell to drive its energy to the observed average. However, it is undesirable to artificially perturb the largest-scale modes in the system, which are well-resolved and the least uncertain. For this reason, only energy shells with wavenumber
 $\ell >\ell ^{\ast }$
above a threshold are equipped with a Nosé–Hoover thermostat. To this end, denote by
 $\ell (\boldsymbol{k})$
the energy shell containing wavenumber
 $\boldsymbol{k}$
.
We choose normalized perturbation parameters
 ${\it\varepsilon}_{\ell }$
to satisfy
 $$\begin{eqnarray}\displaystyle {\it\varepsilon}_{\ell }=\left\{\begin{array}{@{}ll@{}}\bar{E}_{\ell }^{1/2}{\it\varepsilon}_{0}, & \ell \geqslant \ell ^{\ast }\\ 0, & \ell <\ell ^{\ast }.\end{array}\right. & & \displaystyle\end{eqnarray}$$
Here,
 ${\it\varepsilon}_{0}$
is a normalization constant that controls the overall magnitude of the thermostat perturbation. This choice of scaling ensures the means of all thermostat variables
 ${\it\xi}_{\ell }$
have nearly the same magnitude. The discrete equations of motion for two-dimensional Euler flow, extended with the thermostats, reads
 $$\begin{eqnarray}\displaystyle & \dot{{\it\omega}}_{\boldsymbol{k}}+J_{\boldsymbol{k}}({\bf\omega})=f_{\boldsymbol{k}}+{\it\nu}_{-1}\bar{{\it\Delta}}_{\boldsymbol{k}}^{-1}{\it\omega}_{\boldsymbol{k}}+{\it\nu}_{1}{\it\Delta}_{\boldsymbol{k}}{\it\omega}_{\boldsymbol{k}}-{\it\xi}_{\ell }{\it\varepsilon}_{\ell }\partial _{\boldsymbol{k}}E_{\ell }({\bf\omega}),\quad \forall \boldsymbol{k},\ell =\ell (\boldsymbol{k}), & \displaystyle\end{eqnarray}$$
 $$\begin{eqnarray}\displaystyle & \dot{{\it\xi}}_{\ell }={\it\varepsilon}_{\ell }\left(E_{\ell }({\bf\omega})-\bar{E}_{\ell }\right)\!,\quad \ell =\ell ^{\ast },\ldots ,\ell _{max}, & \displaystyle\end{eqnarray}$$
where
 $\partial _{\boldsymbol{k}}$
is used as a shorthand for
 $\partial /\partial {\it\omega}_{\boldsymbol{k}}$
. The viscosity term
 ${\it\nu}_{1}{\it\Delta}_{\boldsymbol{k}}{\it\omega}_{\boldsymbol{k}}$
in (3.13) ensures that the resolved scale modes not directly driven by the thermostats possess a dynamics that is consistent with that of the reference solution.
For each thermostated mode, the energy is driven towards a target value. We emphasize that this value may be taken from physical observations, theoretical predictions or, as here for the purpose of method evaluation, from a high-fidelity solution that resolves the physical viscosity. As such the method may be seen as a data assimilation approach that uses statistical data to correct mean statistics of a dynamical simulation.
It should be noted that while the control will certainly drive the system towards correct averages for the energy levels in the thermostated energy shells, the invariant measure sampled by the trajectories remains unknown. An important consequence of this is that the marginal distributions of the thermostat variables
 ${\it\xi}_{\ell }$
are not known a priori. This complicates choosing initial values for the thermostat variables, as initializing them far from their equilibrium will result in a slow relaxation. We perform a pilot simulation in which the thermostated system is allowed to fully equilibrate in order to select appropriate initial data for the
 ${\it\xi}_{\ell }$
.
4. Feedback control of the forward enstrophy cascade
In this and the following sections, we present two numerical verifications of kinetic energy spectrum correction using the Nosé–Hoover method outlined above. The two numerical experiments differ in the scale of forcing applied. In this section, the forcing is confined to the large-scale range
 $3.5<|\boldsymbol{k}|<6.5$
to simulate a primarily downscale enstrophy cascade. In § 5 we add a second forcing in the range
 $202.5<|\boldsymbol{k}|<206.5$
, which is completely unresolved by the lower order truncations, and hence simulates subgrid-scale forcing.
The forcing is Gaussian white noise in time. The magnitude of the forcing is scaled such that the expected power input matches a given value
 $P$
as follows. With the energy given by
 $E(t)=-(\sum _{\boldsymbol{k}}{\it\Delta}_{\boldsymbol{k}}^{-1}{\it\omega}_{\boldsymbol{k}}{\it\omega}_{\boldsymbol{k}}^{\ast })/2$
, the expected power input due to forcing is equal to the expected change in energy (using Itô’s formula)
 $$\begin{eqnarray}\mathbb{E}\left[\text{d}E\right]=\mathbb{E}\left[\frac{\partial E}{\partial t}\,\text{d}t+\mathop{\sum }_{\boldsymbol{k}}\frac{\partial E}{\partial {\it\omega}_{\boldsymbol{k}}}\,\text{d}{\it\omega}_{\boldsymbol{k}}+\frac{1}{2}\,\text{d}{\it\omega}_{\boldsymbol{k}}\frac{\partial ^{2}E}{\partial {\it\omega}_{\boldsymbol{k}}^{2}}\,\text{d}{\it\omega}_{\boldsymbol{k}}\right]\!.\end{eqnarray}$$
For forcing with uniform magnitude across a band
 $\boldsymbol{k}\in K_{f}$
of wavenumbers, we substitute
 $\,\text{d}{\it\omega}_{\boldsymbol{k}}=\hat{f}\,\text{d}Z_{\boldsymbol{k}}$
, where
 $\,\text{d}Z_{k}=\,\text{d}A_{k}+\text{i}\,\text{d}B_{k}$
is a complex Wiener increment, into (4.1) to find
 $$\begin{eqnarray}\displaystyle \mathbb{E}\left[\text{d}E\right]=-\hat{f}^{2}\mathop{\sum }_{\boldsymbol{k}\in K_{f}}{\it\Delta}_{\boldsymbol{k}}^{-1}\,\text{d}t=P\,\text{d}t, & & \displaystyle\end{eqnarray}$$
whence we compute that the magnitude of the forcing in the forced modes should equal
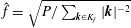 $\hat{f}=\sqrt{P/\sum _{\boldsymbol{k}\in K_{f}}|\boldsymbol{k}|^{-2}}$
. Consequently a time-
 ${\rm\Delta}t$
forcing increment is computed via the formula
 $$\begin{eqnarray}{\it\omega}_{\boldsymbol{k}}(t+{\rm\Delta}t)={\it\omega}_{\boldsymbol{k}}(t)+\sqrt{\frac{P{\rm\Delta}t}{\displaystyle \mathop{\sum }_{\boldsymbol{k}\in K_{f}}|\boldsymbol{k}|^{-2}}}(R_{\boldsymbol{k}}+\text{i}S_{\boldsymbol{k}}),\end{eqnarray}$$
where
 $R_{\boldsymbol{k}},S_{\boldsymbol{k}}$
are unit normal pseudorandom numbers.
The thermostated system (3.13)–(3.14) is integrated in time using a symmetric splitting method (McLachlan & Quispel Reference McLachlan and Quispel2002). We split into four flows as follows: the map
 ${\it\Psi}_{{\rm\Delta}t}^{I}({\bf\omega},{\bf\xi})$
applies the forcing (4.3) for a time step of size
 ${\rm\Delta}t$
. The map
 ${\it\Psi}_{{\rm\Delta}t}^{II}({\bf\omega},{\bf\xi})$
exactly solves all linear viscosity terms for a time step of size
 ${\rm\Delta}t$
. The map
 ${\it\Psi}_{{\rm\Delta}t}^{III}({\bf\omega},{\bf\xi})$
exactly solves (3.14) with fixed
 ${\bf\omega}$
to update the thermostat variables for a time step of size
 ${\rm\Delta}t$
. The map
 ${\it\Psi}_{{\rm\Delta}t}^{IV}({\bf\omega},{\bf\xi})$
solves the remaining terms of (3.13):
 $$\begin{eqnarray}\displaystyle \dot{{\it\omega}}_{\boldsymbol{k}}+J_{\boldsymbol{k}}({\bf\omega})=-{\it\xi}_{\ell }{\it\varepsilon}_{\ell }\partial _{\boldsymbol{k}}E_{\ell }({\bf\omega}),\quad \forall \boldsymbol{k},\ell =\ell (\boldsymbol{k}) & & \displaystyle\end{eqnarray}$$
using the implicit midpoint rule (Hairer et al.
Reference Hairer, Lubich and Wanner2006) with fixed
 ${\bf\xi}$
for a time step of size
 ${\rm\Delta}t$
. The above four maps are composed symmetrically to yield the numerical integrator
 $$\begin{eqnarray}\displaystyle ({\bf\omega}^{n+1},{\bf\xi}^{n+1})={\it\Psi}_{{\rm\Delta}t/2}^{I}\circ {\it\Psi}_{{\rm\Delta}t/2}^{II}\circ {\it\Psi}_{{\rm\Delta}t/2}^{III}\circ {\it\Psi}_{{\rm\Delta}t}^{IV}\circ {\it\Psi}_{{\rm\Delta}t/2}^{III}\circ {\it\Psi}_{{\rm\Delta}t/2}^{II}\circ {\it\Psi}_{{\rm\Delta}t/2}^{I}({\bf\omega}^{n},{\bf\xi}^{n}). & & \displaystyle\end{eqnarray}$$
For the application of splitting methods to stochastic differential equations, see Leimkuhler & Matthews (Reference Leimkuhler and Matthews2013).
The values of the parameters used in the simulations are summarized in table 1. We define four configurations. First is a high-resolution reference configuration (
 $K=256$
) utilizing physical viscosity
 $p=1$
in which both all forcing and dissipation scales are resolved. The observations used to define the Nosé–Hoover parameters are drawn from this configuration. The other three configurations are truncated with at a much lower wavenumber (
 $K=85$
) for which the Kolmogorov scale is unresolved. These include a simply truncated configuration, with all parameters equivalent to the reference configuration except for the resolution; a hyperviscosity configuration with
 $p=4$
and viscosity parameter (
 ${\it\nu}_{4}=4.3\times 10^{-15}$
) chosen such that the largest resolved modes are sufficiently dissipated; and the Nosé–Hoover configuration as described in the previous section.
4.1. Energy spectrum
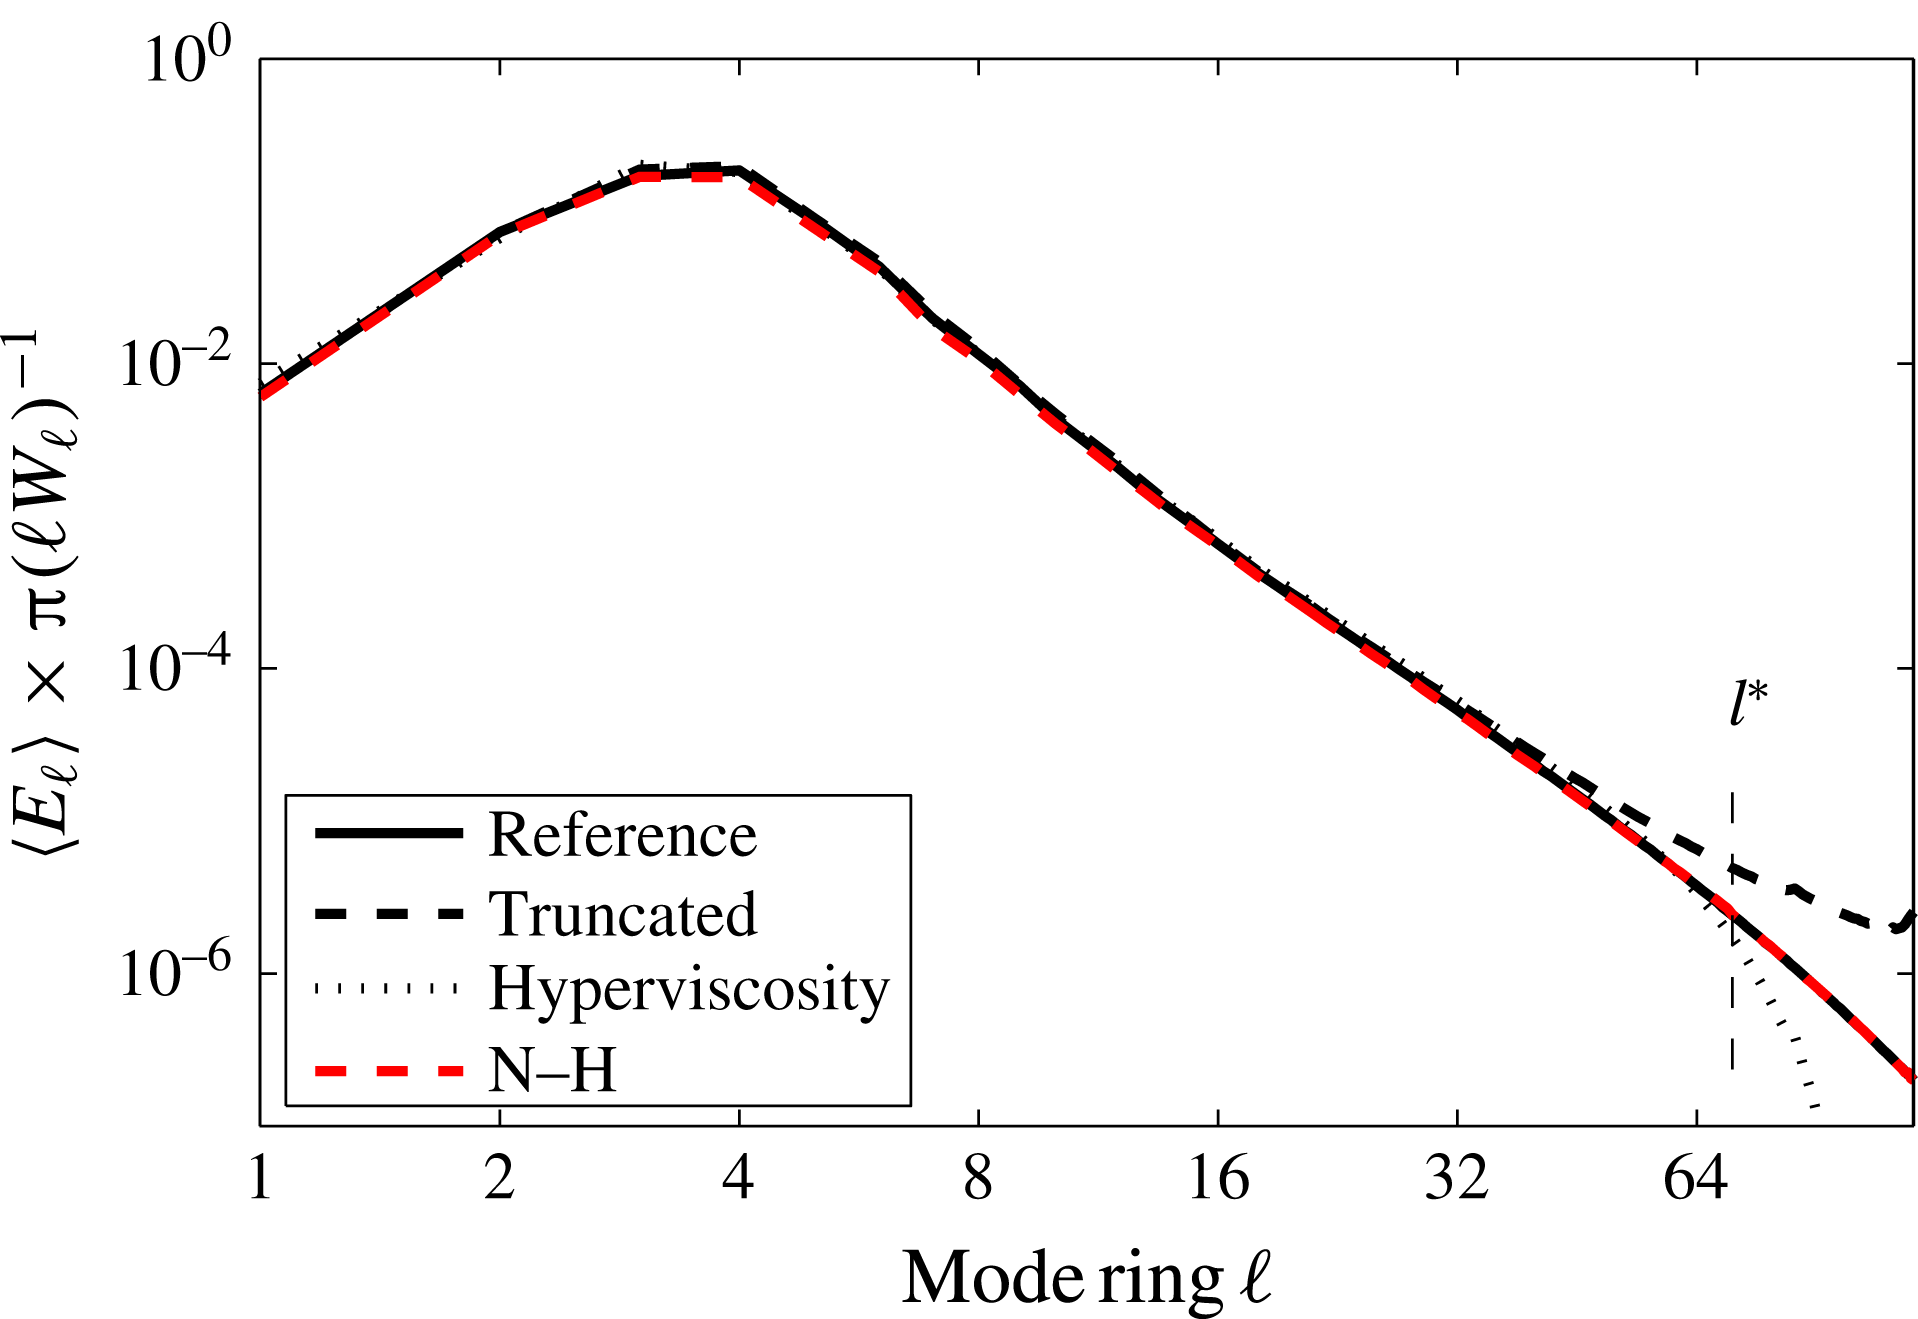
The energy spectrum for the reference, truncated, hyperviscosity and Nosé–Hoover configurations are compared in figure 2. The kinetic energy per energy shell is multiplied by a correction factor that accounts for (i) the non-uniformity that arises by partitioning of the discrete Fourier space into annular shells and (ii) the incomplete resolution of the highest wavenumber bands (i.e. those in the corners of the Fourier space). The factor is
 ${\rm\pi}/\ell W_{\ell }$
, where
 $W_{\ell }=-(\sum _{\ell -1/2<|\boldsymbol{k}|<\ell +1/2}{\it\Delta}_{\boldsymbol{k}}^{-1})/2$
, and essentially results in smooth spectra in figure 2 (cf. figure 1). The hyperviscosity model underestimates the kinetic energy in the large wavenumbers compared with the reference model. The kinetic energy spectrum in the Nosé–Hoover model is visually indiscernible from the reference model.
The kinetic energy spectrum, averaged over 100 time units, for the reference (solid), a truncated (dashed), hyperviscosity (dotted) and Nosé–Hoover (dashed, red) configurations. Parameters are given in table 1, where the
 $\dagger$
indicates the parameters used here for the Nosé–Hoover control.

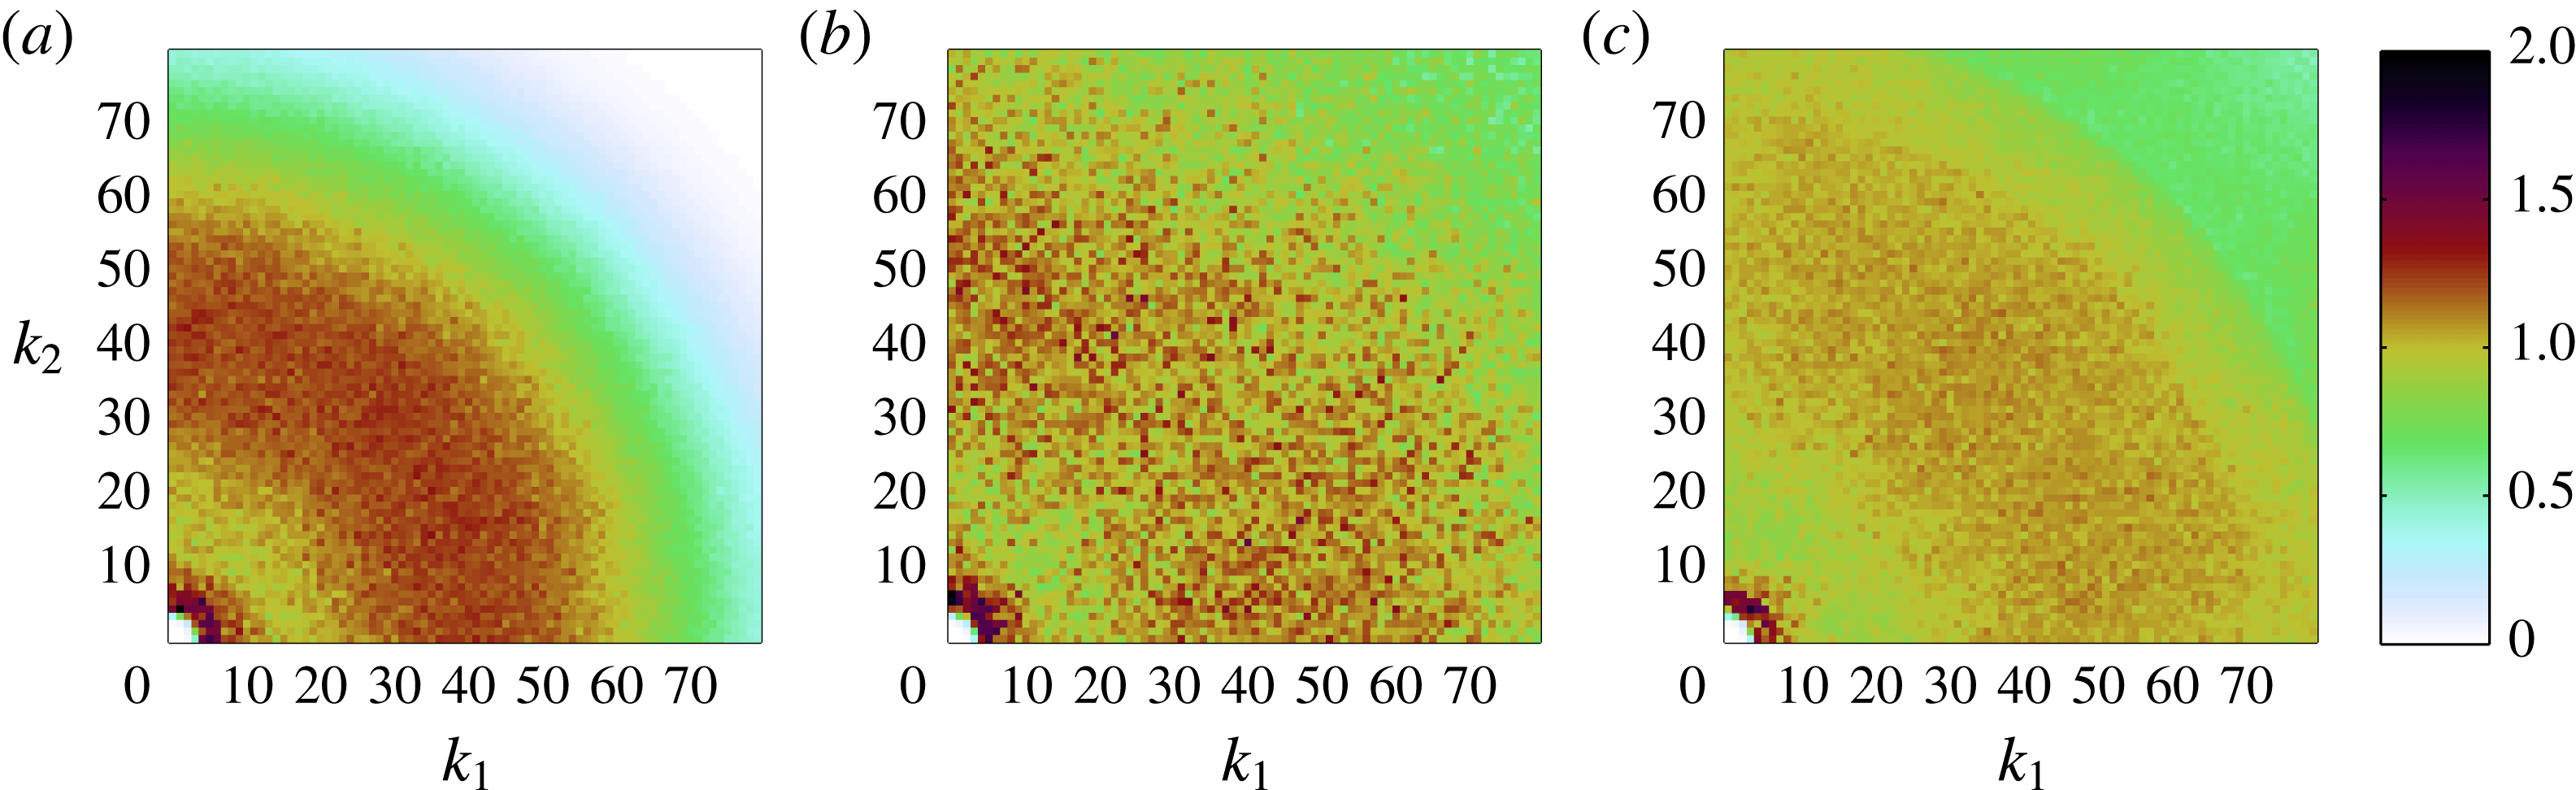
To investigate the energy spectrum more closely, the energy per mode, averaged over 100 time units, is represented in figure 3 for the reference, hyperviscosity and Nosé–Hoover simulations. The mean energy per mode is multiplied by the cube of the wavenumber magnitude. This will result in areas of equal colour for modes where the energy spectrum scales as
 $k^{-4}$
and where isotropy can be assumed. Anisotropy would appear as a break of the radial symmetry. This does not occur in the reference simulation and for most of the Nosé–Hoover controlled simulation. However, in figure 3 we do observe that, for the thermostated model, kinetic energy appears to be more uniformly distributed across the Fourier modes within a given energy shell than is the case for the reference model. This is most likely due to the heavily reduced dimensionality of the phase space (
 $85^{2}$
versus
 $256^{2}$
) leading to a much faster spread of the stochastic noise from the forcing through the available degrees of freedom.
A representation of the time-averaged energy in each Fourier mode using (a) the hyperviscosity model, (b) the reference simulation and (c) the Nosé–Hoover control; see table 1 for details. The value plotted is given by
 ${\hat{C}}_{\boldsymbol{k}}=2{\rm\pi}\overline{{\it\omega}_{\boldsymbol{k}}{\it\omega}_{\boldsymbol{k}}^{\ast }}/(C^{\prime }{\it\eta}^{2/3}k^{-3-d-1})$
, where the parameters
 $C^{\prime }$
and
 $d$
are fit to the reference solution (cf. (2.9)). When this value is close to unity, it indicates close local (in Fourier space) agreement to the power-law spectrum.

4.2. Vorticity field
In figure 4 the computed vorticity fields at
 $t=1$
and
 $t=10$
are shown for the reference model, the hyperviscosity model and the model using the Nosé–Hoover control. At
 $t=1$
, the vorticity structures produced by the thermostat are similar to those of the reference and hyperviscosity models, indicating that the thermostat only weakly perturbs the large-scale vorticity. After 10 time units, the solutions have diverged due to the chaotic nature of the dynamics, but the vorticity fields remain qualitatively similar.
Vorticity fields in a classical double cascade, obtained at
 $t=1$
(a–c) and
 $t=10$
(d–f) using (a,d) the model with added hyperviscosity, (b,e) the reference simulation and (c–f) the Nosé–Hoover method as indicated with
 $\dagger$
in table 1.

4.3. Autocorrelation functions
Autocorrelation functions provide dynamical information on the temporal variance at different scales. The autocorrelation function
 $R_{{\it\omega}{\it\omega}}(s;x)$
of the vorticity
 ${\it\omega}$
at a point
 $x$
is given by
 $$\begin{eqnarray}R_{{\it\omega}{\it\omega}}(s;x)=\frac{1}{T}\int _{0}^{T}{\it\omega}(t+s,x){\it\omega}(t,x)\,\,\text{d}t\end{eqnarray}$$
when observed over time
 $T$
. We study the autocorrelation function of the vorticity at a grid point. To limit the computational expense of fast Fourier transforms (FFTs), we compute the autocorrelation of a reduced-order vorticity field associated to Fourier modes
 $|\boldsymbol{k}|_{\infty }<16$
. Furthermore, as the vorticity at each grid point is identically distributed assuming homogeneous forcing, we also average the autocorrelation functions over the grid to take full advantage of available data.
We compare the autocorrelation functions for the resolved, truncated, hyperviscosity and Nosé–Hoover configurations. In figure 5(a) the autocorrelation function is shown for different perturbation parameters
 ${\it\varepsilon}_{0}$
; figure 5(b) focuses on the short-time behaviour. The agreement is relatively insensitive to perturbation parameter for the range of values shown (an order of magnitude). For larger values of
 ${\it\varepsilon}_{0}$
, the thermostat acts more strongly, approaching Langevin dynamics in the limit of large
 ${\it\varepsilon}_{0}$
(Frank & Gottwald Reference Frank and Gottwald2011). For smaller values of
 ${\it\varepsilon}_{0}$
the thermostat becomes weak, meaning the relaxation of the spectrum requires averaging on long times. The choice of thermostat threshold
 $\ell ^{\ast }$
has an even smaller effect on the autocorrelation functions and is therefore not shown.
(a) Autocorrelation functions
 $R_{{\it\omega}{\it\omega}}$
when simulating a classical double cascade. The Nosé–Hoover thermostat using various choices of the perturbation parameter
 ${\it\varepsilon}_{0}$
is compared with the reference solution (solid black), truncated simulation (dashed black) and hyperviscosity model (dotted black). (b) Double logarithmic plot of
 $1-R_{{\it\omega}{\it\omega}}$
, to focus on short time scale behaviour.

4.4. Ensemble dispersion
A 50-member ensemble is created from a single deterministic initial condition by randomizing the phase of all modes with
 $|\boldsymbol{k}|\geqslant 50$
; in this way each ensemble member has an identical initial kinetic energy spectrum. In figure 6 we compare ensembles, simulated up to
 $t=10$
, for the reference (b), hyperviscosity (a) and Nosé–Hoover (c) configurations by studying the phase angle of the
 $(0,1)$
-mode. Both the hyperviscosity model and the Nosé–Hoover control are less dispersive than the reference solution. Nevertheless, the thermostated ensemble exhibits observably more variance than the hyperviscosity model, and does manage to reflect some of the outlying trajectories of the reference solution.
Ensemble dispersion in a classical double cascade. Plotted is the phase angle of the
 $(0,1)$
-mode using (a) the model with hyperviscosity, (b) the reference simulation and (c) the Nosé–Hoover method as indicated with
 $\dagger$
in table 1.

5. Feedback control of a system with sub-grid scale forcing
In the previous section the Nosé–Hoover method corrected the energy spectrum in the forward enstrophy region for a truncated system. In this section we deviate from the classical setting of an intermediate forcing that results in two inertial ranges. Here we include a small-scale forcing term. This flattens the energy spectrum in the region between the two forcing scales when compared with the previous case. The form of the forcing is the same as before (Gaussian white noise in the Fourier components), only now the wavenumbers with
 $202.5<|\boldsymbol{k}|<206.5$
are additionally forced. The total power input in these modes is equal to that of the low-wavenumber forcing.
A Nosé–Hoover control with parameters as described in table 1 is applied to a truncated simulation with
 $K=85$
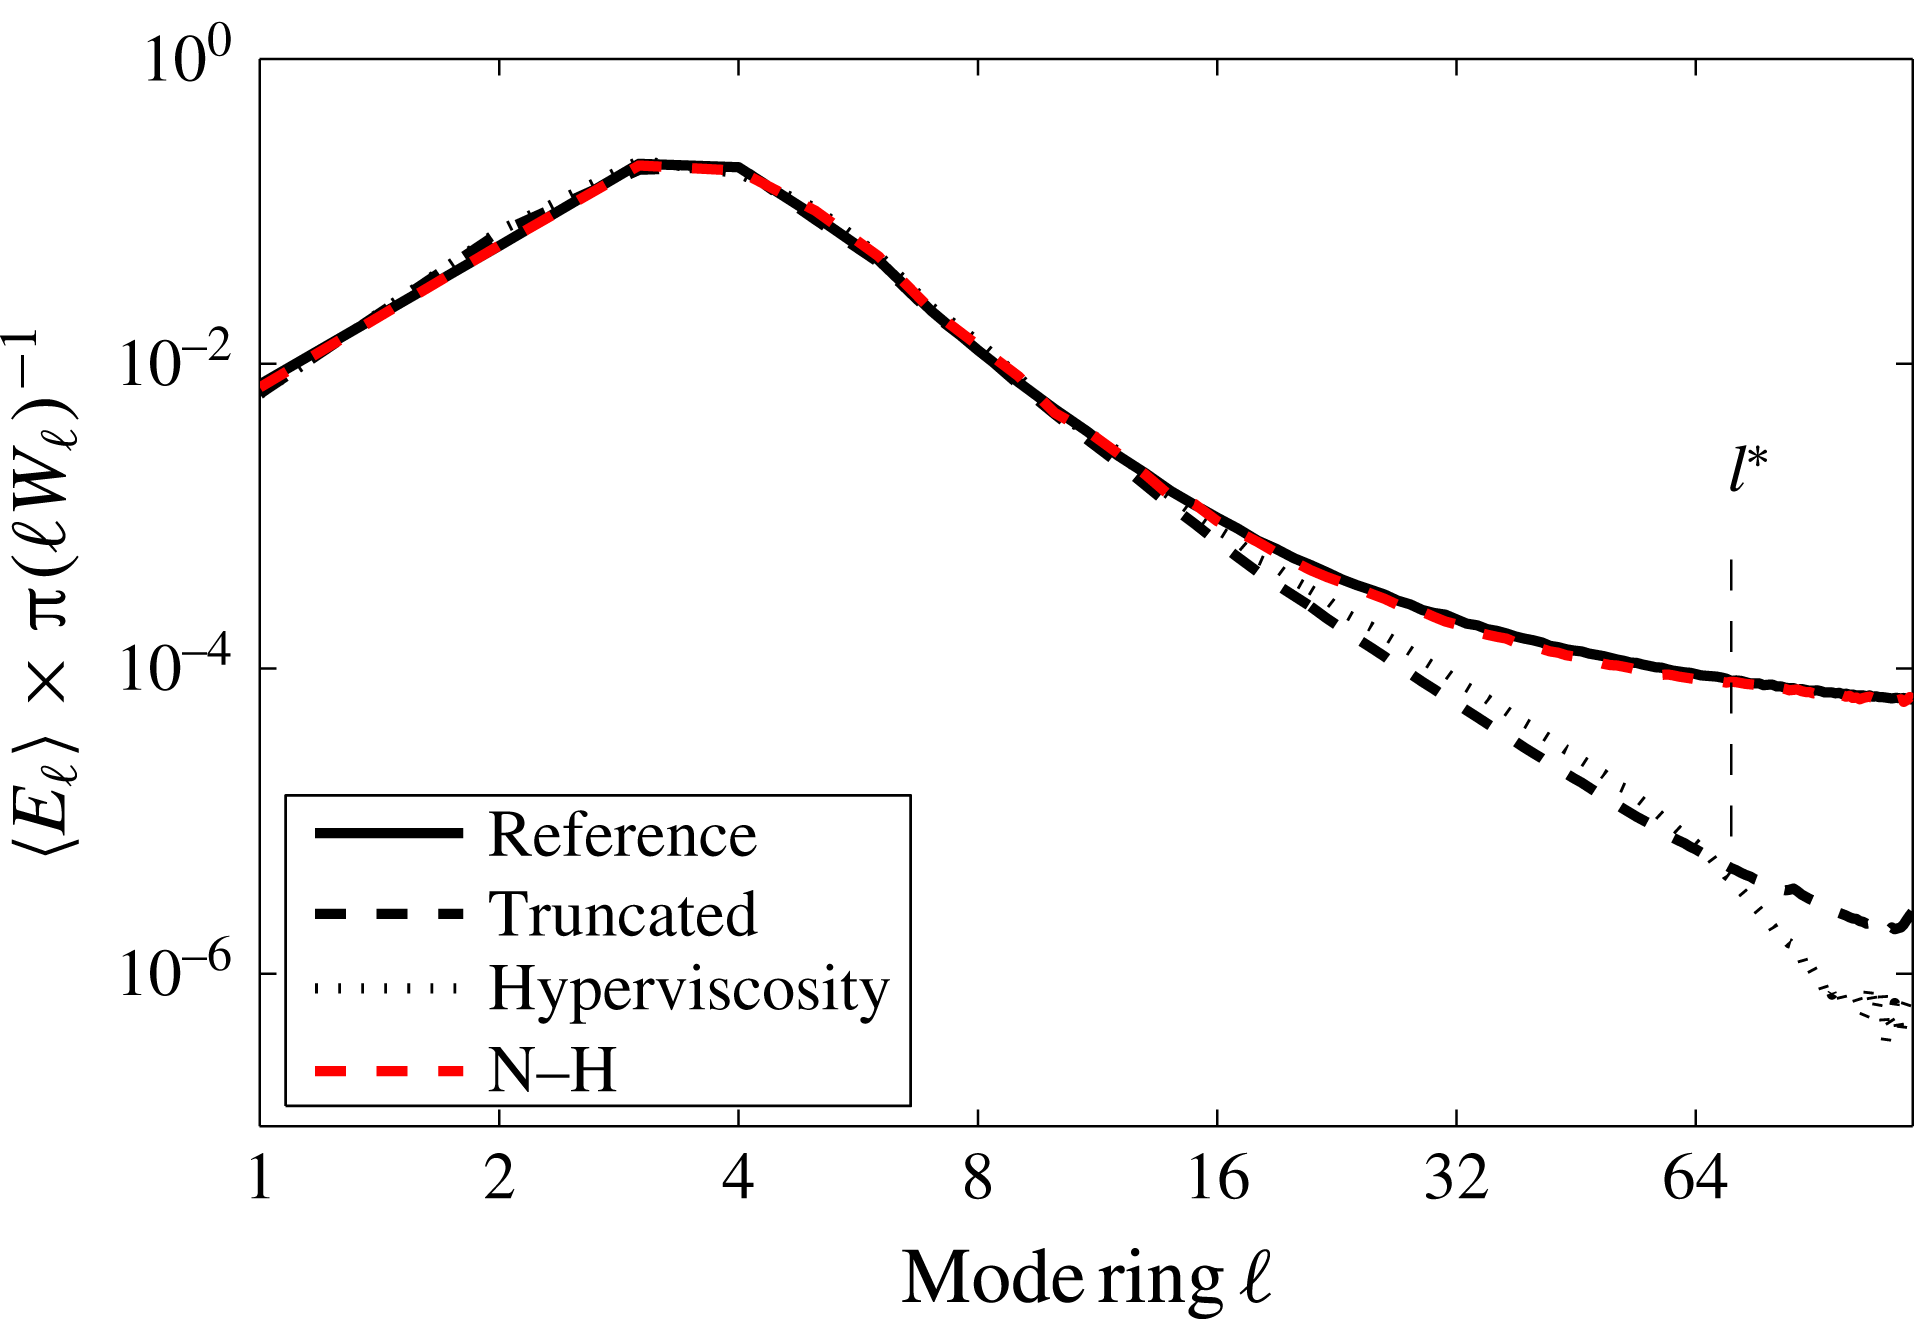
, i.e. the small-scale forcing is not resolved. Instead, the control target spectrum is observed from the fully resolved simulation after 100 time units. This simulates a scenario in which the fluid is forced at unresolved small scales, and we must attempt to incorporate this forcing given observations at resolved scales. Figure 7 shows the mean kinetic energy spectrum after a 100 units for each of the four configurations of table 1. Both the truncated and hyperviscosity models have no means of sensing the small-scale forcing and will consequently underestimate the energy in the smallest resolved scales. Clearly this is an unfair comparison, but we include results from these models to illustrate the difference. The Nosé–Hoover control acts only on mode bands
 $\ell ^{\ast }$
and beyond (
 $\ell ^{\ast }=71$
in the figure), yet the energy spectrum is accurate over all wavenumbers.
The kinetic energy spectrum after 100 time units for the reference (solid), truncated (dashed), hyperviscosity (dotted) and Nosé–Hoover (dashed, red) configurations. Parameters are given in table 1, where the
 $\dagger$
indicates the parameters used here for the Nosé–Hoover control. An additional forcing is applied to the wavenumbers
 $203.5<|\boldsymbol{k}|<206.5$
, with a power injection equal to that of the large-scale forcing.

5.1. Vorticity field
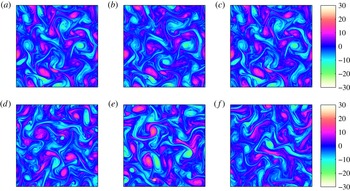
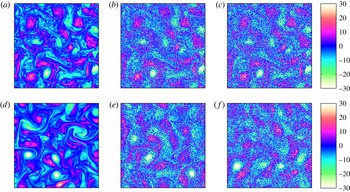
The inclusion of small-scale forcing leads to a noisier vorticity field for the reference solution as seen in the centre panels of figure 8. Using the Nosé–Hoover control produces similar vorticity fields. At
 $t=1$
, the large-scale structures of all three models are similar, again illustrating that the Nosé–Hoover control only weakly affects the dynamics at small wavenumbers. The chaotic nature of the flow leads to decorrelation of solutions over long time, yet at
 $t=10$
the controlled vorticity field remains qualitatively similar to the reference.
Vorticity fields with small-scale forcing, obtained at
 $t=1$
(a–c) and
 $t=10$
(d–f) using (a,d) the (overly diffusive) hyperviscosity model, (b,e) the reference simulation and (c,f) the Nosé–Hoover controlled method as indicated with
 $\dagger$
in table 1.

5.2. Autocorrelation functions
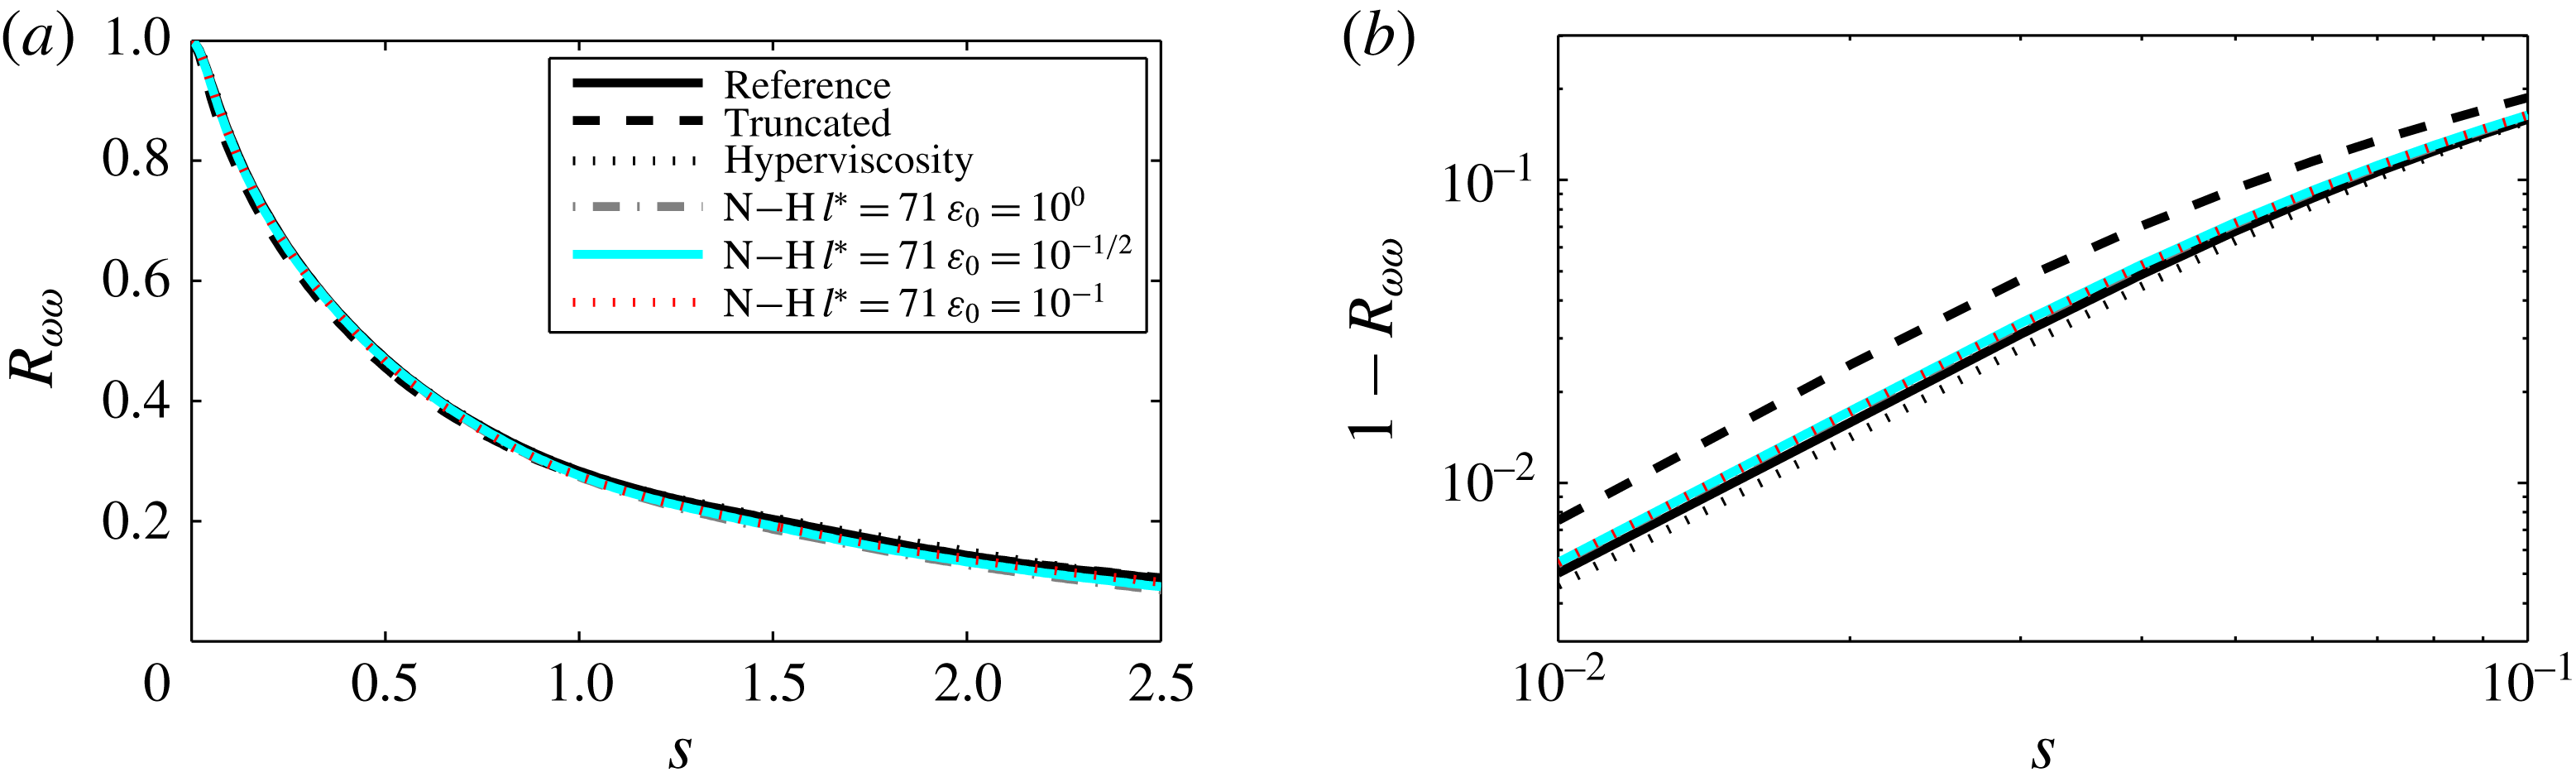
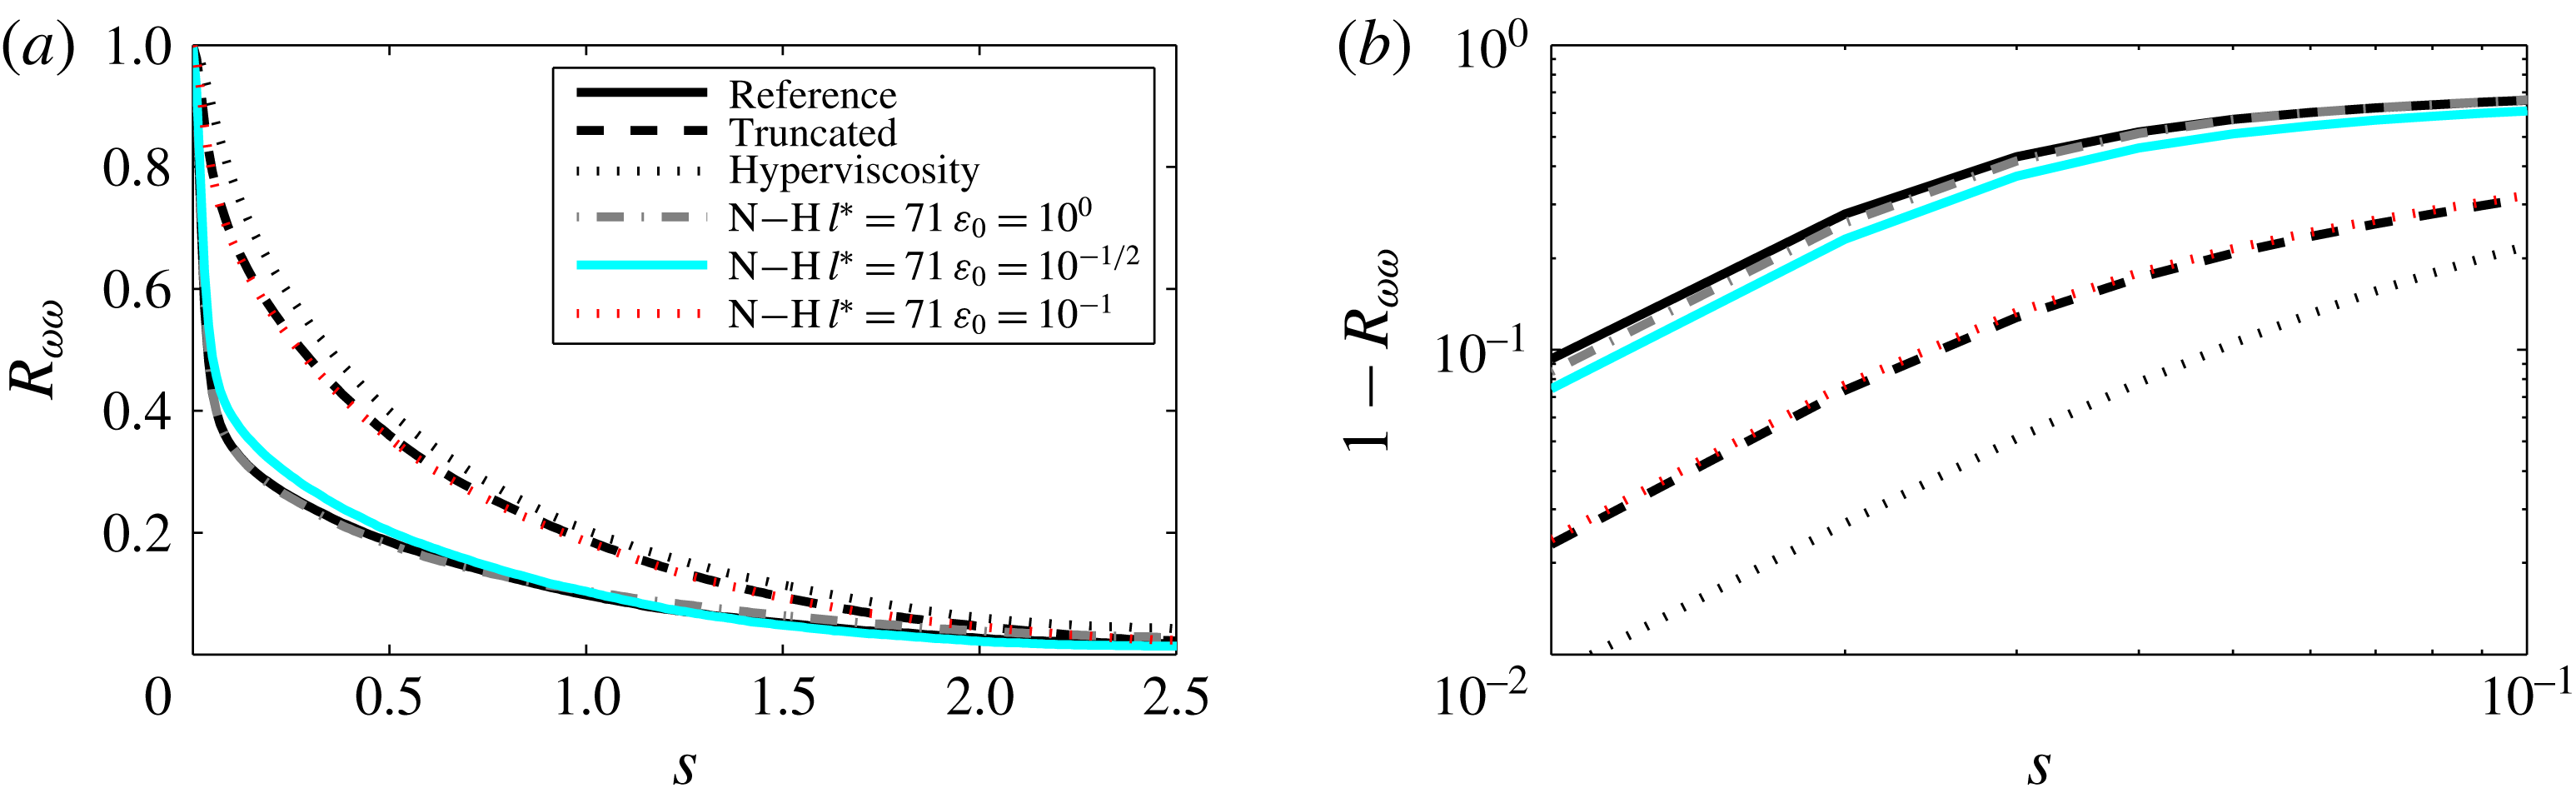
As in the case with solely large-scale forcing, we use autocorrelation functions for comparing dynamical properties. In figure 9 we compare the Nosé–Hoover control with different perturbation parameters (
 ${\it\varepsilon}_{0}\in \{1,10^{-1/2},10^{-1}\}$
) with the reference simulation, truncated simulation and hyperviscosity model. The results for the truncated and hyperviscous models show excessive correlation in time. The autocorrelation function for the controlled dynamics depends strongly on the perturbation parameter
 ${\it\varepsilon}_{0}$
in this case with small-scale forcing. For smaller
 ${\it\varepsilon}_{0}$
the autocorrelation functions approach those of the truncated dynamics. The largest
 ${\it\varepsilon}_{0}$
considered does decorrelate similarly to the reference solution. The results are insensitive to the wavenumber threshold
 $\ell ^{\ast }$
for the control.
(a) Autocorrelation functions
 $R_{{\it\omega}{\it\omega}}$
with small-scale forcing. The Nosé–Hoover thermostat using various choices of the perturbation parameter
 ${\it\varepsilon}_{0}$
is compared with the reference solution (solid black), truncated simulation (dashed black) and hyperviscosity model (dotted black). (b) Double logarithmic plot of
 $1-R_{{\it\omega}{\it\omega}}$
, to focus on short time scale behaviour.

5.3. Ensemble dispersion
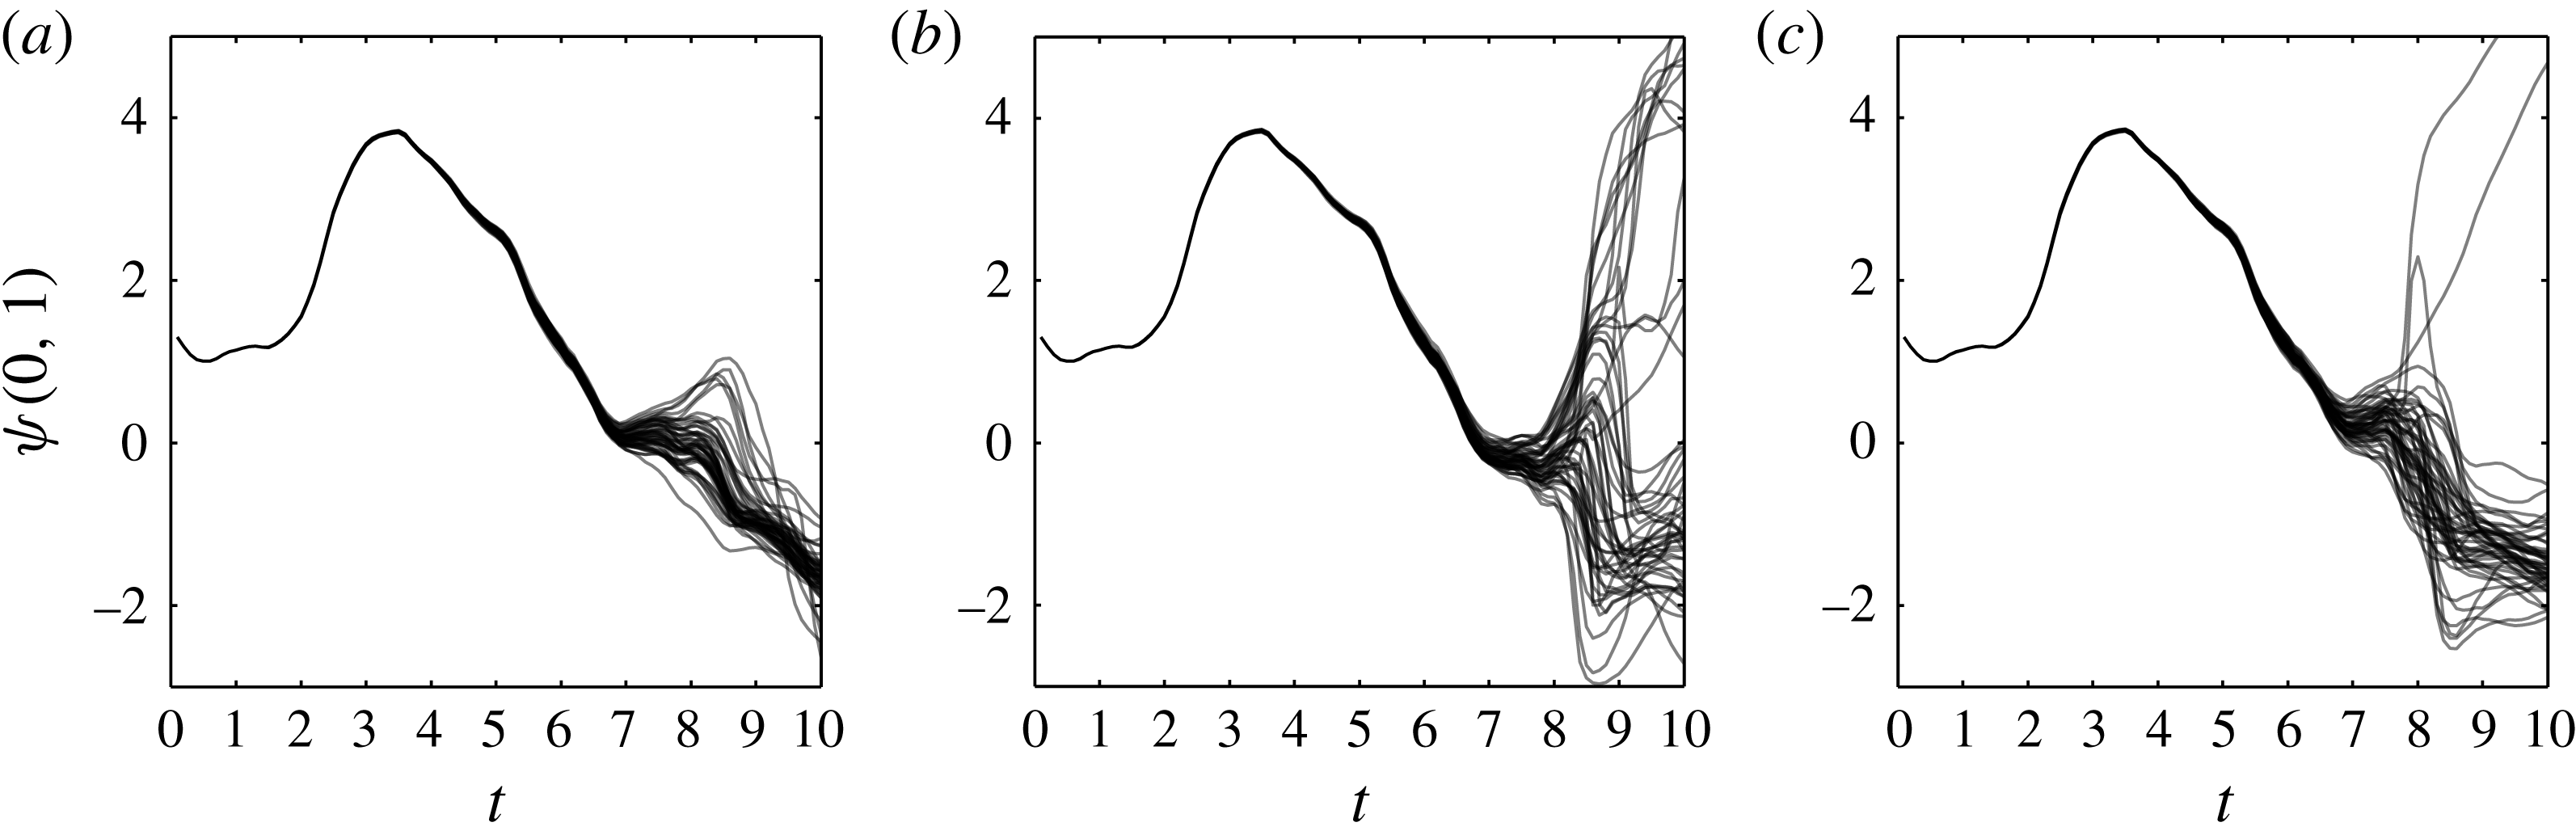
Again we compare the evolution of the phase angle of the
 $(0,1)$
-mode in a 50-member ensemble simulation for each of the three models. The ensemble was again prepared by randomizing the phases of modes with
 $|\boldsymbol{k}|\geqslant 50$
. The Wiener increments
 $R_{k}(t)$
and
 $S_{k}(t)$
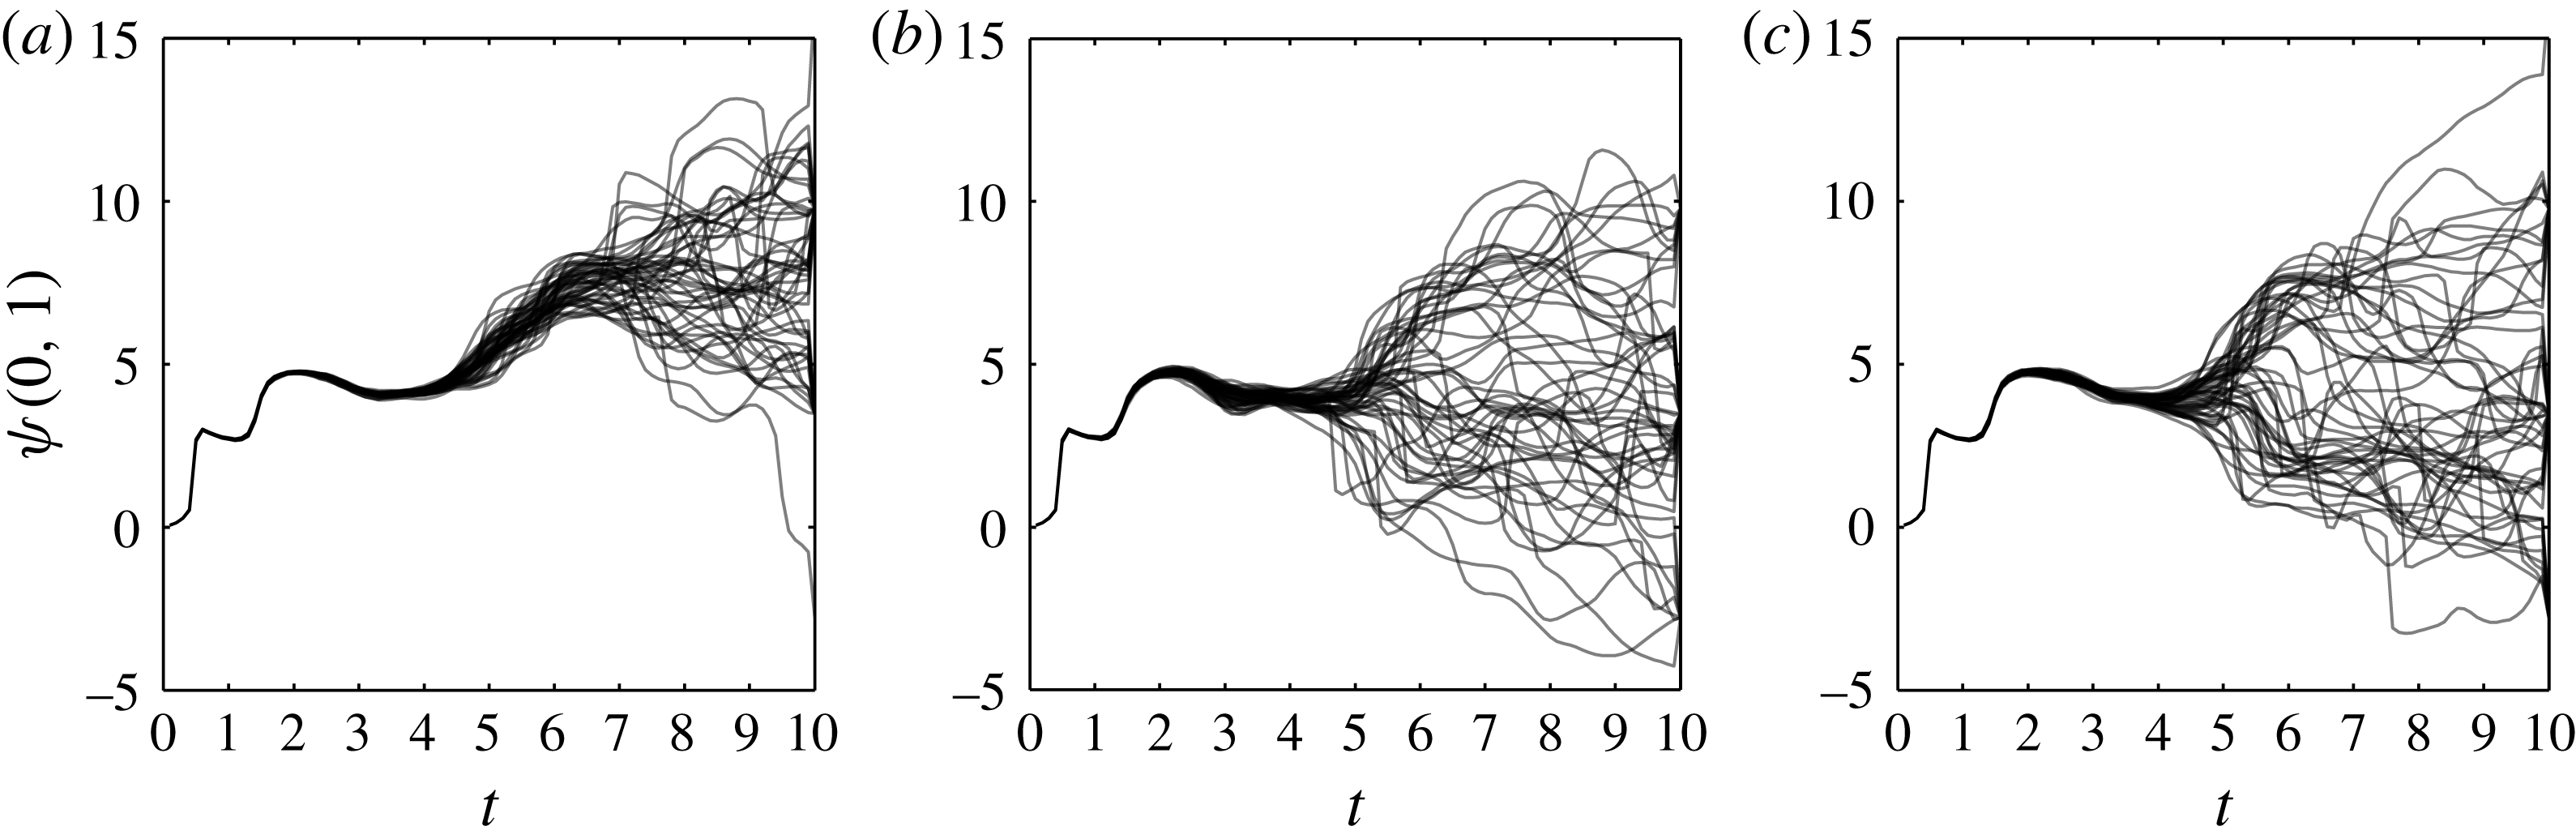
in (4.3) were taken identical across all ensemble members. Consequently the observed ensemble spread is due to the effects of initialization and the different closure models, and not due to differences in the Wiener process forcing the simulations. Figure 10 compares the reference (b) with the hyperviscosity (a) and Nosé–Hoover control (c) models. The reference and Nosé–Hoover controlled ensembles show significant decorrelation at about time
 $t=5$
, whereas for the hyperviscosity model, the decorrelation is delayed until time
 $t=7$
or
 $t=8$
. In the reference there is a notable split of the ensembles around
 $t=5$
into two main branches. This split can also be observed in the Nosé–Hoover approach, but not in the hyperviscosity model. At the final time
 $t=10$
, both reduced models are slightly underdispersive.
Ensemble dispersion in a simulation with small-scale forcing. Plotted is the phase angle of the
 $(0,1)$
-mode using (a) the model with hyperviscosity, (b) the reference simulation, and (c) the Nosé–Hoover as indicated with
 $\dagger$
in table 1.

6. Discussion
We have shown that the Nosé–Hoover method can be used to enforce a target background kinetic energy spectrum in two-dimensional turbulence models with stochastic forcing, even when truncated well below the viscous scale. The parameterization comes at the mild cost of one additional dynamic variable for each energy shell controlled.
In the experiments reported in the previous section, the target spectrum was inferred from a high-resolution simulation, but it is important to emphasize that the target spectrum could also be taken from experiments or theory. In particular, the method described here could be developed to enforce a
 $k^{-3}$
spectrum in low-resolution models, if so desired. The approach makes no explicit use of two-dimensional structure and hence is potentially extensible to three-dimensional turbulence.
Fröhlich & Schneider (Reference Fröhlich and Schneider1999) simulate two-dimensional turbulent dynamics using a wavelet basis. If adapted to this setting, our control method might be even more effective, as the action could be restricted to the homogenous regions away from coherent structures.
Sukoriansky et al. (Reference Sukoriansky, Galperin and Chekhlov1999) observe that the large-scale dissipation influences the spectral slope in the forward enstrophy cascade. This means that it might be useful to apply a control on this end of the spectrum to perform simulations that display the hypothesized
 $k^{-3}$
spectrum in the high wavenumbers.
Acknowledgements
The authors express gratitude to A. Donev and J. Vanneste, as well as the anonymous referees, for helpful comments on earlier drafts of this article. The work of the second author was supported by grant EP/G036136/1 from the Engineering and Physical Sciences Research Council (UK). K.W.M. was supported by a grant financed by the Netherlands Organisation for Scientific Research (NWO), as part of research programme 613.001.009.
Supplementary movie
Supplementary movie is available at http://dx.doi.org/10.1017/jfm.2015.526.