1. Introduction
1.1 Supporting ecosystem connectivity
Human caused habitat fragmentation is a major problem in tropical forests. Regulations to protect biodiversity loss in critical ecosystems often fail because they do not consider the livelihood needs of local populations. This study focuses on a landscape within the Bukit Batabuh Protection Forest (Batabo Hill) in Sumatra, Indonesia. The Forest provides a key wildlife corridor connecting two Priority Tiger Conservation Landscapes, the Bukit Rimbang Baling Wildlife Reserve and the Bukit Tigapuluh National Park (Sanderson et al., Reference Sanderson, Forrest, Loucks, Ginsberg, Dinerstein, Seidensticker, Leimgruber, Songer, Heydlauff, O'Brien, Tilson and Nyhus2010). The 135,267 ha wildlife reserve and the 138,185 ha national park are critical for the conservation of endemic mammals, including the Sumatran tiger (Panthera tigris sumatrae) and the Sumatran elephant (Elephas maximus sumatranus).
To help safeguard remaining unique ecosystems, Sumatra Island's spatial planning regulations recognise corridor ecosystems as critical for connecting protected areas and home ranges for large mammals. A 2012 Presidential Decree designates the RIMBA Corridor as one of five ecosystem corridors within Sumatra (Sulistyawan et al., Reference Sulistyawan, Eichelberger, Verweij, Boot, Hardian, Adzan and Sukmantoro2017).Footnote 1 In addition, national and provincial governments together with the World Wildlife Fund (WWF) Indonesia are implementing the RIMBA Project – a Global Environmental Facility (GEF) project to strengthen forest and ecosystem connectivity.Footnote 2 The Batabo Hill Protection Forest is a key landscape within the RIMBA Corridor.
The RIMBA GEF project is considering a number of interventions to restore the Batabo Hill Protection Forest as a viable and sustainable wildlife corridor to link the two Tiger Priority Conservation Landscapes. The site of the RIMBA GEF project is an 11 km highway bisecting the Batabo Hill landscape. Over the past two decades, around half the original forest on 5 km on either side of the highway has been converted to other uses, mostly smallholder rubber production and scrub.
One proposed intervention includes eco-infrastructure, building a series of bridges at key wildlife corridors to allow tigers safer pathways across the 11 km road. In all, six bridges, known as ‘fly-overs’, would facilitate the migration and dispersal of the Sumatran tiger and other animals. The proposed eco-infrastructure is estimated to cost around USD6 millionFootnote 3 to build. In addition, rights to land near the six fly-overs need to be acquired. Several hundred smallholders operate under tenuous tenure circumstances, farming rubber along the highway.Footnote 4 Therefore, securing project buy-in and land access rights from key smallholders operating in Batabo Hill is central to any wildlife connectivity effort.
This study examines the willingness of the rubber producers operating within Batabo Hill to participate in a wildlife connectivity project. This study estimates the costs associated with farmers giving up their rubber trees and abandoning their land in Batabo Hill. Much of this land is needed to support the wildlife connectivity objectives of the eco-infrastructure activities.
This research follows the approach of Southgate et al. (Reference Southgate, Haab, Lundine and Rodríguez2010) to investigate the cost of a payment for environmental services (PES) program that directly pays land users to give up access to their land for a period of five years. Based on advice from the WWF Indonesia RIMBA project team, the PES program would seek as much land as possible for 5 km on either side of the 11 km road. The aim is to reduce human activity and allow the understory cover to regenerate to attract prey animals. The proposed PES program would directly target the agents of agricultural expansion (Delacote and Angelsen, Reference Delacote and Angelsen2015), who are in the best position to protect the wildlife corridor (Ferraro, Reference Ferraro2001).
PES programs are increasingly popular, with successful applications in Indonesia (see Pasha and Leimona, Reference Pasha, Leimona, Ottaviani and El-Hage Scialabba2011; Leimona et al., Reference Leimona, van Noordwijk, de Groot and Leemans2015b; and Suich et al., Reference Suich, Lugina, Muttaqin, Alviya and Sari2016 for reviews of Indonesia's experience with PES programs). During the past 20 years, PES projects in Indonesia have included ecosystem restoration concessions, water use and catchment area protection, nature-based tourism and forest carbon. The Indonesian government provides a legal framework for PES implementation. Over time, the government continues to formulate policies to strengthen PES development and implementation, especially when related to REDD+ (Ardiansyah et al., Reference Ardiansyah, Marthen and Amalia2015).
To investigate the potential for a PES program, we build on recent work by Cacho et al. (Reference Cacho, Milne, Gonzalez and Tacconi2014) in Sumatra to examine the openness of farm households to accept compensation to give up access to their land as part of a hypothetical conservation intervention. Using an open-ended willingness to accept (WTA) approach, we estimate the payments that households in four villages surrounding Batabo Hill would require to participate in the conservation program. In addition to directly asking the household what amount of compensation they would be willing to accept, we employ an innovative ‘inferred valuation’ approach developed by Lusk and Norwood (Reference Lusk and Norwood2009a); Lusk and Norwood (Reference Lusk and Norwood2009b), which asks respondents to infer the preferences of others.
We contribute to the emerging inferred valuation literature in two ways. First, we test the inferred valuation method in a developing-country context. Second, we extend the empirical evidence base via the third known application of the inferred valuation method to a WTA approach (following on from Kaczan and Swallow, Reference Kaczan and Swallow2013, and Drichoutis et al., Reference Drichoutis, Lusk and Pappa2016) and the first application using an open-ended elicitation format. In addition, we contribute to the literature on PES programs for habitat and species of global consequence in developing country contexts (e.g., Bulte et al., Reference Bulte, Boone, Stringer and Thornton2008).
We analyse the effects of social desirability bias and hypothetical bias on WTA estimates and calculate simple mean WTA values. To validate our results we compare the WTA results to local land values and opportunity costs of farming rubber.
1.2 The ecological issue
Sumatra's forests produce vital ecosystem services and provide habitats to species of global consequence, including Orang-utans, and the Sumatran tiger, Sumatran elephant and Sumatran rhinoceros. Historically, Riau Province was a stronghold for the Sumatran tiger, estimated to harbour around 30 per cent of the population (Borner, Reference Borner1978). However, based on historical rates of deforestation, Sumatra is at risk of losing the last important forest habitats for tigers, with much of the remaining forest area under pressure from agricultural expansion. In 2012, Indonesia surpassed Brazil,Footnote 5 recording the highest annual deforestation rate in the world. Between 2000 and 2012 Sumatra lost nearly 18 per cent, or 2.8 million hectares, of its primary forests, directly resulting in habitat loss and animal extinctions (Margono et al., Reference Margono, Potapov, Turubanova, Stolle and Hansen2014).
Indonesia designates several legal categories for forest areas, including Production Forests, Protection Forests, Conservation Forests, Nature Reserves and Nature Conservation Forests (Ardiansyah et al., Reference Ardiansyah, Marthen and Amalia2015). The government's spatial planning regulations are designed to protect home ranges for large mammals with corridor ecosystems. Protecting forest areas is recognised as a leading approach to conservation, particularly for large mammals (Margules and Pressey, Reference Margules and Pressey2000; Adams et al., Reference Adams, Aveling, Brockington, Dickson, Elliott, Hutton, Roe, Vira and Wolmer2004).
While Conservation Forests, National Parks and Nature Reserves receive the highest levels of protection, Indonesia's Protection Forests allow roads and underground mining permits.Footnote 6 Recent studies conclude that biodiversity, wildlife habitat and agricultural productivity are all at risk in Indonesia (OECD, 2012; Leimona et al., Reference Leimona, Amaruzaman, Arifin, Yasmin, Hasan, Sprang, Dradjat, Agusta, Jaffee and Frias2015a; World Bank, 2015). This is partly driven by District governments seeking operating revenues through selling off land concessions for agriculture, and partly by economic policies that provide incentives to expand agriculture into important watersheds. The consequence is that the system to protect and conserve forests in Sumatra remains ineffective at preventing deforestation and the loss of key wildlife habitats (Brun et al., Reference Brun, Cook, Lee, Wich, Koh and Carrasco2015).
Interventions to help limit human activity in agro-ecosystems bordering high-biodiversity forests can facilitate movement of wildlife between fragmented habitats by enhancing connectivity. Tigers are likely to use areas with adequate understory and low levels of human activity radiating out from their main forest habitat; this includes plantation areas (Sunarto et al., Reference Sunarto, Kelly, Parakkasi, Klenzendorf, Septayuda and Kurniawan2012). If human disturbance can be removed or reduced sufficiently, and understory cover regenerated, the lands along the highway in Batabo Hill can provide a more suitable habitat for wildlife, including tigers.
2. Methods
2.1 Contingent valuation methods
The contingent valuation (CV) method is often used to estimate economic values of ecosystems and biodiversity (Mitchell and Carson, Reference Mitchell and Carson1989) and has been favoured by environmental economists to elicit values from private landholders using a ‘stated preference’ approach. Stated preference approaches (e.g., WTA and willingness to pay) are an important tool to inform policy and program design by providing insights in the absence of observable participation behaviour.
Over the previous two decades, the literature has favoured willingness to pay (WTP) over WTA methods. A report recommendation by the National Oceanic and Atmospheric Administration panel (Arrow and Solow, Reference Arrow and Solow1993) argues that WTP estimates are more conservative, warning that respondents may give protest bids or unrealistically high answers to WTA questions (Interis, Reference Interis2014). This concern stems from difficulty with controlling hypothetical bias, which is argued to be greater in WTA studies (List and Gallet, Reference List and Gallet2001; Murphy et al., Reference Murphy, Allen, Stevens and Weatherhead2005).
Concerns that the WTA format is not incentive-compatible for stated preference elicitation (Haab and McConnell, Reference Haab and McConnell2002) mean that WTP has been applied in circumstances where WTA is more appropriate (Knetsch, Reference Knetsch2005). When considering which method to apply, Petrolia and Kim, (Reference Petrolia and Kim2011) conclude that if the (perceived) property rights reside with the respondent, it is inappropriate to ask the respondents their WTP for land to which they already claim ownership. Brown and Gregory (Reference Brown and Gregory1999) warn that applying WTP when WTA is more appropriate tends to undervalue the environmental good.
Recent applications explore farm households' WTA compensation for participation in a hypothetical PES program (Ma et al., Reference Ma, Swinton, Lupi and Jolejole-Foreman2012; Kaczan and Swallow, Reference Kaczan and Swallow2013) and estimate the amount of compensation local households would require to forgo access to natural resources (Shrestha et al., Reference Shrestha, Alavalapati, Seidl, Weber and Suselo2007). In two rural locations in Guatemala and Ecuador, Southgate et al. (Reference Southgate, Haab, Lundine and Rodríguez2010) investigate the payments households would be willing to accept in exchange for scaling back farmed area for a period of five years in a hypothetical PES program. We draw on their approach to estimate private land users’ WTA compensation to forgo access to their land in Batabo Hill for a period of five years. The minimum amount of compensation required to motivate a farm household to participate in such scheme is used to estimate the potential cost of establishing a PES program.
Fears over high levels of ‘protest zeros’, non-response rates and hypothetical bias inflating estimates lead many researchers to prefer binary discrete choice approaches rather than open-ended approaches to WTA and WTP. However, in the case of double bounded discrete choice mechanisms, Carson and Groves (Reference Carson and Groves2007) find that the WTP estimates are higher than those from open-ended questions, and Lusk and Norwood (Reference Lusk and Norwood2009a) demonstrate that no elicitation approach is immune to hypothetical bias. The open-ended approach is preferable for this study as it provides scope to investigate the heterogeneity in the respondents' valuation of their land in the forest,Footnote 7 removing the opportunity for the respondents to simply agree with the bid amounts provided under a binary discrete-choice approach, or be influenced by starting point bias under binary choice or referendum approaches (Green et al., Reference Green, Jacowitz, Kahneman and McFadden1998; Mekonnen, Reference Mekonnen2000).
2.2 Mitigating against hypothetical and social desirability bias
In their review of CV methods to inform the design of PES mechanisms, Whittington and Pagiola (Reference Whittington and Pagiola2012) identify numerous developing country studies using stated preference techniques that fail to address hypothetical bias. Recent advancements in WTA survey design address these concerns, including the application of cheap talk scripts (Krishna et al., Reference Krishna, Drucker, Pascual, Raghu and King2013) and the use of novel inferred valuation techniques (Lusk and Norwood, Reference Lusk and Norwood2009a; Lusk and Norwood, Reference Lusk and Norwood2009b). First developed by Lusk and Norwood (Reference Lusk and Norwood2009a), the inferred valuation literature (e.g., Lusk and Norwood, Reference Lusk and Norwood2009b; Norwood and Lusk, Reference Norwood and Lusk2011; Yadav et al., Reference Yadav, van Rensburg and Kelley2013) is based on the premise that there are two sources of bias in the typical CV measure – hypothetical bias and social desirability bias, which is itself a form of hypothetical bias.
Hypothetical bias can be a problem in CV where there is potential for a discrepancy between what people say they will pay or accept in a hypothetical survey, compared to what they will actually pay or accept in a real world situation. One particular type of hypothetical bias is strategic behaviour, where respondents answer in the hope of skewing results and consequently any program or policy informed by the survey's findings (Kaczan and Swallow, Reference Kaczan and Swallow2013). Another form of hypothetical bias is ‘yea saying’, where respondents may indicate their willingness to participate in a PES program without fully considering the associated trade-offs (Bennett and Blamey, Reference Bennett and Blamey2001).
By asking people to provide their own WTP for a good, as well as what they infer others’ WTP would be, provide empirical evidence to demonstrate that people derive utility from the act of saying they are willing to pay for a good; thus creating a wedge between the real and hypothetical value elicited. This effect is particularly strong for goods with normative motivations (Lusk and Norwood, Reference Lusk and Norwood2009b), where differences between self and inferred valuations are found to be very large (Yadav et al., Reference Yadav, van Rensburg and Kelley2013).
The inferred valuation method seeks to eliminate the utility people derive from the act of simply stating their WTP or WTA (Yadav et al., Reference Yadav, van Rensburg and Kelley2013). Inferred valuation methods control for this by asking people to predict or infer others’ values for a good rather than asking people to state their own value. Because the question relates to other people's values, rather than the respondent's, the respondent gets no utility from answering and is not motivated to answer in a socially desirable manner (Fisher, Reference Fisher1993).
The rationale behind using inferred valuation is that the individual respondent does not typically have knowledge of the specific preferences of the broader population. Without this information, the respondent who is asked to make the inferred valuation must instead use her own value. Because respondents are providing other people's values, rather than their own, there should be no motivation to answer in a way that enhances one's self-image or conforms to social norms. In testing this approach, Lusk and Norwood (Reference Lusk and Norwood2009a) hypothesised, and provided empirical evidence, that inferred values are roughly equal to conventional self-reported values, adjusted for social desirability bias. For this reason, the resulting value is more appropriate for PES program design and policy development (Kaczan and Swallow, Reference Kaczan and Swallow2013).
The inferred valuation method has seldom been explored in a WTA setting. Empirical applications by Kaczan and Swallow (Reference Kaczan and Swallow2013) and Drichoutis et al. (Reference Drichoutis, Lusk and Pappa2016) using choice experiment, payment card and dichotomous choice approaches find that inferred valuation has little effect on elicited WTA valuations. However, WTP applications highlight the potential for inferred valuation to mitigate against hypothetical bias.
The third person approach has been applied in settings where there is a tendency to overstate generosity or environmental concern (Epley and Dunning, Reference Epley and Dunning2000; Johansson-Stenman and Martinsson, Reference Johansson-Stenman and Martinsson2006). Yadav et al. (Reference Yadav, van Rensburg and Kelley2013) find that individuals believe they are willing to pay significantly more than others towards conservation. In this study context, there is potential for respondents to wish to appear relatively more willing to participate in the hypothetical conservation program, and provide a lower WTA value than their true preferences. The application of inferred valuation to this study context can help to examine the extent to which self-image effects, and the utility people derive from stating they are willing to cooperate, influence WTA values.
3. Experimental design
3.1 The household survey
Private landholders’ willingness to forgo access to their land for conservationFootnote 8 was investigated in four villages bordering Batabo Hill. Focus group discussions and key informant interviews with village heads confirmed that households from the four villages had land in Batabo Hill. Village heads provided an estimate of the approximate proportion of households with land in the forest. In total, 300 farm households were surveyed in the four villages – Kasang, Koto Cengar, Sangua and Seberang Cengar. The households were drawn randomly from a census of all village households, with 75 households from each village selected for interviewing.Footnote 9
The survey instrument was pretested on 50 households in June 2015,Footnote 10 before the final survey was conducted in July 2015. Thirteen local experienced enumerators were trained to deliver the household survey instrument, which elicited information on household characteristics, agricultural production, sources of income and land ownership, in addition to CV questions. The survey was conducted in private in the family home and took approximately two hours to complete.
To ensure a standardised approach throughout the CV component of the household survey, the enumerators were trained to read from a cheap talk script (Cummings and Taylor, Reference Cummings and Taylor1999). The script described the status quo and outlined the objectives of the study: to understand how the forest benefits local communities and to learn how much their plot in Batabo Hill is worth to them. Respondents were asked to consider how much money they would want to be paid to ‘give up’ their land in Batabo Hill for five years, during which time the plot would be left completely alone, and then returned to them at the end of the five-year period. The five-year time limit was chosen to emphasise that accepting payments would not threaten the recipient's property rights (Southgate et al., Reference Southgate, Haab, Lundine and Rodríguez2010). A cash transfer was chosen in recognition of the fact that the land users (typically low income farm households) had already established a recognised right to the land, and would require compensation for this lost livelihood activity. Throughout the WTA exercise, it was made clear that this was a hypothetical situation, undertaken purely for research purposes.
The survey followed the following structure – first using a direct valuation approach to ask (a) what the respondents would accept to give up their land for five years, followed by an inferred valuation approach, asking (b) what they thought their neighbour would say they would accept when surveyed, as well as (c) what their neighbour would actually accept.Footnote 11 Under this approach, (a) is capturing the hypothetical self, (b) the hypothetical other, which is aimed at removing the social desirability/warm glow bias, and (c) the actual other, which in theory, reduces both the hypothetical and social desirability bias (Lusk and Norwood, Reference Lusk and Norwood2009a).
We hypothesise that, in the absence of social desirability bias, the amount that the respondents will infer their neighbour will say they will accept when surveyed (WTA2) will be greater than the amount the respondents will say they will accept themselves (WTA1). Further, in the absence of both social desirability and hypothetical bias, we hypothesise that the amount the respondents are WTA (WTA1) will be greater than what they say their neighbour would accept in a real life situationFootnote 12 (WTA3).
To elicit what the respondents would be willing to accept, respondents were first asked to confirm their use rights to land in Batabo Hill. Respondents who admitted to having land in Batabo Hill were then asked to provide plot information including how many rubber trees they had on the plot, the age of the trees and the size of the plot. Respondents were then asked what payment amount (if any) they would be willing to accept to give up their land for five years. This payment would be provided as a lump sum payment, paid at the beginning of the five-year period. Based on their responses, respondents were then asked debriefing questions to understand why they were/were not willing to accept (Arrow and Solow, Reference Arrow and Solow1993).
This was followed by inferred valuation questions asking what respondents thought their neighbours would be willing to accept when surveyed, and asking what they thought their neighbours would actually accept (in a real life situation). Our approach differs from the earlier inferred valuation literature, which asked respondents what ‘other people’ (Lusk and Norwood, Reference Lusk and Norwood2009a) or the ‘average other’ (Carlsson et al., Reference Carlsson, Daruvala and Jaldell2010; Yadav et al., Reference Yadav, van Rensburg and Kelley2013) would accept.Footnote 13 This variation was made because the amount of compensation requested is expected to vary according to individual plot characteristics (Lizin, et al., Reference Lizin, Van Passel and Schreurs2015). In this context, the ‘other people’ or ‘average other’ approach would have precluded the vital plot information required to give a reference point for the valuation and, consequently, challenged the validity of the estimates.Footnote 14 As a test of the external validity of the WTA results (Kaczan and Swallow, Reference Kaczan and Swallow2013), we compare the WTA values to local land values and the opportunity cost of not producing rubber. These reference values play an important role in determining the presence of bias in our estimates, and highlight any differences between the financial and economic value placed on the land. From a program design perspective, an assessment of the local opportunity costs is important for adequately designing compensation to ensure appropriate incentives are in place (Wunder, Reference Wunder and Angelsen2009), specifically in contexts where the land use is illegal (Gregersen et al., Reference Gregersen, El Lakany, Karsenty and White2010) and formal market values do not exist.
4. Empirical analysis
4.1 Household characteristics
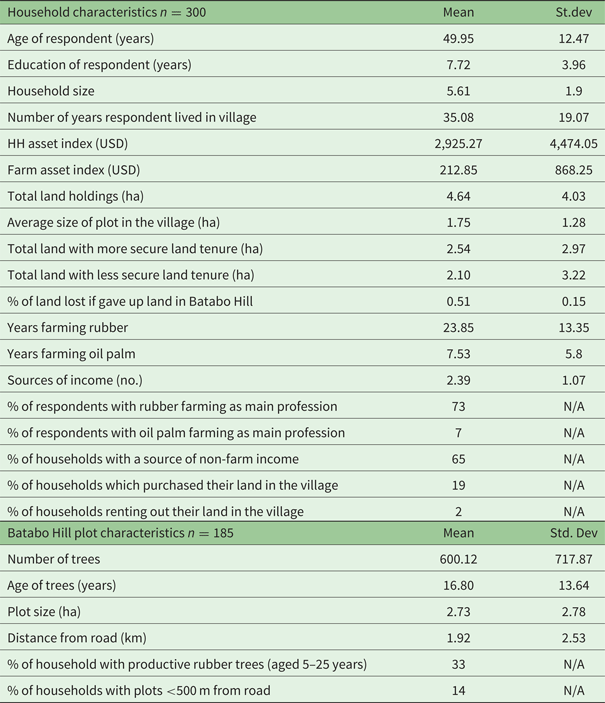
Table 1 presents the descriptive statistics of the survey sample. The household heads were predominantly male,Footnote 15 50 years old, had an average of eight years of formal education and had lived in the village for 35 years. The mean household size was six persons. Agriculture was the main source of livelihood for the sampled households and the mean landholdings totalled around 4.5 ha per household. Among household heads, three-quarters listed their main profession as rubber farming, with a further 15 per cent listing rubber farming as their secondary profession. Rubber is a traditional livelihood in this area; on average respondents have been farming rubber for 24 years. A smaller portion of household heads – 7 per cent – listed oil palm farming as their main profession, with a further 17 per cent listing it as their secondary profession. Oil palm is a newer form of livelihood in this area; farmers have been farming oil palm for eight years on average. Notably, 65 per cent of households have a source of non-farm income.
Descriptive statistics

In Batabo Hill, the mean plot size is 2.7 ha and typically the land is planted with rubber trees, with a mean of 602 trees per plot. The mean age of these rubber trees is 17 years. Plots averaged a distance of approximately 2 km from the road.
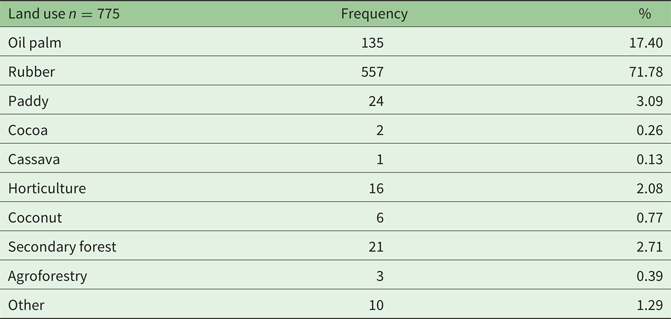
In addition to any land in Batabo Hill, all households have village land, on average 1.75 ha. The predominant land use is rubber, which accounts for 72 per cent of all plots in the sample, followed by oil palm, which accounts for 17 per cent of all plots. Paddy is less common in this area, covering only 3 per cent of all plots (see table 2).
Household plot land use, 2015

4.2 Sample selection
Of the 300 households in the full sample, 196 respondents admitted to having land in Batabo Hill, indicated they were willing to accept, and provided a lump sum payment amount. The remaining 104 respondents may not have provided a response to the WTA component because (a) the respondent did not have land in Batabo Hill,Footnote 16 (b) the respondent was unwilling to discuss illegally cleared land in Batabo Hill,Footnote 17 or (c) the respondent had other unknown reasons.
Six of the 196 respondents who admitted to having land in Batabo Hill were not willing to accept any amount of compensation. This represented 2 per cent of the survey sample, which is below a similar study in which 34 per cent of respondents were not willing to accept any amount of compensation (Shrestha et al., Reference Shrestha, Alavalapati, Seidl, Weber and Suselo2007). Further observations were removed that did not provide the plot size. The final usable sample analysed included 185 responses to the direct valuation questions and 148 responses to the inferred valuation questions.
While the original sample of households was selected randomly, there is no reason to assume a priori that the remaining sample, after the exclusion of invalid responses (outliers or responses with missing data), is random. We test whether there are systematic and non-random differences between the households that either did not respond to these questions, or provided an invalid response (hereafter referred to as invalid responders), and the remaining sample.
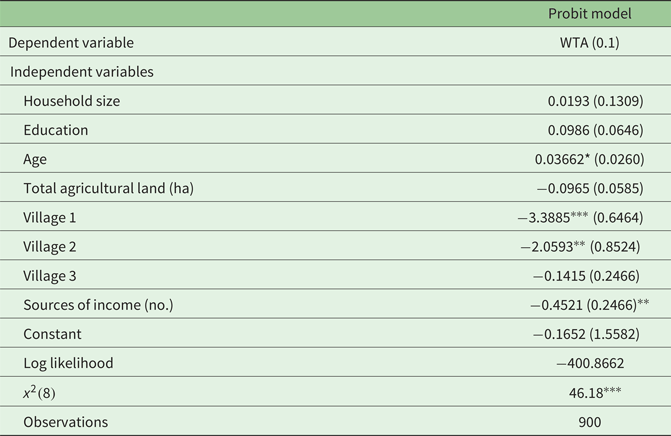
We use Heckman's two-step procedure (Heckman, Reference Heckman1979) to test for selection bias. To examine any differences between the two groups, the selection equation included individual characteristics which could influence the response to the WTA question: total land holdings, household size, education and sources of income, along with village dummy variables. The results from the Probit model indicate that the household heads who provided an invalid WTA response were older, their household had fewer sources of income, and they were less likely to be from village 1 or 2 (see table 3).
Parameter estimates of the Probit model

Notes: Standard error in parentheses. ***p<0.01, **p<0.05, *p<0.1.
From the first stage Probit model, we generate the inverse of Mill's ratio (IMR) to estimate λ, which we include in Model 1 to test for selection bias. As reported in table 5, we find that the coefficient of IMR is not significantly different from zero, which suggests that the invalid responders were missing randomly from the sample of respondents, therefore there is no evidence of sample selection bias (Strazzera et al., Reference Strazzera, Genius, Scarpa and Hutchinson2003). The implication of this is that the use of a standard Random Effects or Fixed Effects regression model is appropriate, and parameter estimates do not need to be corrected for sample selection bias.
4.3 Empirical analysis
We use a within-sample study design,Footnote 18 merging the three WTA observations into one WTA variable so that n=900 to create a panel data set with three unique WTA observations for each of the 300 households. We create dummy variables for the inferred valuation measures, WTA2 and WTA3, to compare to the baseline direct valuation WTA1, as well as variables to control for household and neighbour plot characteristics. The WTA2 dummy accounts for the effects of social desirability bias and the WTA3 dummy accounts for the effects of hypothetical bias on the WTA estimate.
We first ran a Fixed Effects model to explore the WTA decision for each household using the continuous WTA dollar amount per hectare as the dependent variable (List and Shogren, Reference List and Shogren2002).Footnote 19 The advantage of this approach is that it controls for individual household characteristics, accounting for the individual household factors that may impact or bias the predictor or outcome variables (Kyriazidou, Reference Kyriazidou1997). We compared this approach to a Random Effects model, which allows for the inclusion of individual household and plot characteristics to help explain the motivations behind the WTA valuation.
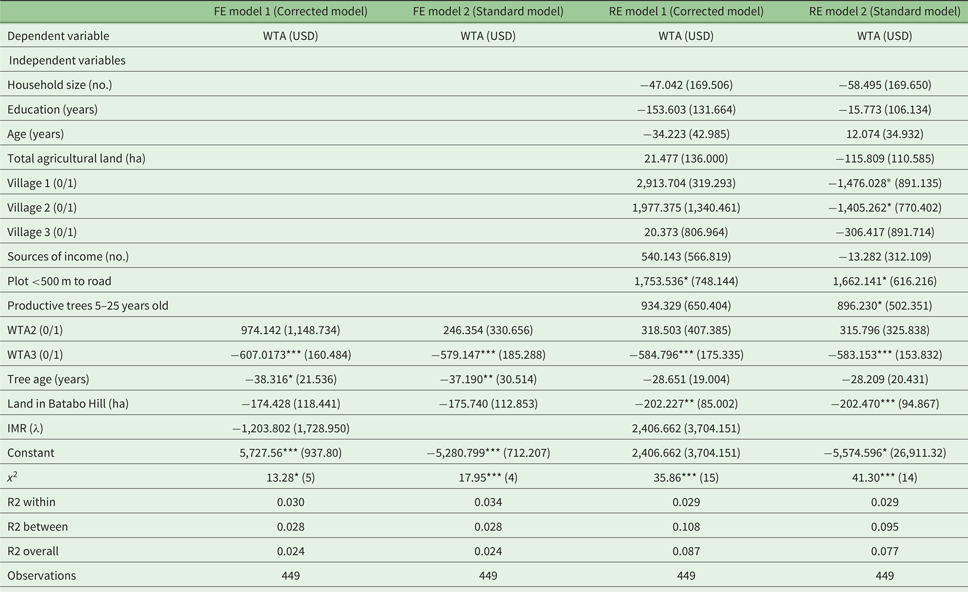
Table 4 reports the different sets of explanatory variables used in the models to understand the WTA decision.
Parameter estimates of Random Effects (RE) and Fixed Effects (FE) models with and without sample selection correction

Notes: Standard error in parentheses. ***p<0.01, **p<0.05, *p<0.1.
Both the Fixed Effects and Random Effects models have their advantages and limitations, and the results from the Hausman test suggest that in this instance the Random Effects model is preferred. As sample selection bias is not present, we only discuss the results from the standard (uncorrected) Random Effects model, Model 2. Of interest is the WTA3 dummy, which is highly significant, indicating that the amount of compensation respondents say their neighbours would actually be willing to accept (controlling for hypothetical and social desirability bias) is USD583 less per ha than what respondents themselves say they would accept for their plot.
The dummy for productive treesFootnote 20 is significant at the 10 per cent level and positive, suggesting that respondents with rubber trees aged between 5 and 25 years old require an additional USD896 to forgo access to their plot in Batabo Hill. This is intuitive, as farmers with younger, productive trees are forgoing more income than those with trees past their most productive years.
While not significant, the variable measuring total household agricultural landholdings is also negatively related to the WTA value, suggesting that households with more overall land require USD115 less compensation per hectare of total landholdings to forgo access to their land in Batabo Hill. This is intuitive, as these households have more additional land where they can employ their household labour. Isolating the effect to the land held in Batabo Hill, the variable measuring the number of hectares of land the respondent has in Batabo Hill is significant at the 1 per cent level, and negatively related to WTA. This suggests that for every additional hectare of land, the respondent is willing to accept USD202 less in compensation. On average, households with larger plots in Batabo Hill require less compensation per hectare.
The dummy for plots which are less than 500 metres from the road is positive and significant at the 5 per cent level. Respondents with plots in close proximity to the road require an additional USD1,662 in compensation. The premium placed on plots which are close to the road reflects the lower transport costs, time savings and easier access.
The Village 1 and 2 dummies have negative coefficients, significant at the 10 per cent level, indicating that, on average, respondents from these villages require between USD1405 and 1,476 less compensation respectively than respondents from Village 4 (the omitted category).
4.4 WTA values
For those providing a valid WTA response, we calculate simple means for all three WTA measures (table 5). The compensation payments requested by the farmers can be viewed as the value they place on their plot in Batabo Hill: accepting the payment means forgoing access to that land to generate income for a period of 5 years. WTA values were elicited in Indonesian Rupiah; however, results are presented here in USD.Footnote 21
WTA mean estimates, lump sum USD per ha

Three different measures of WTA are calculated in a lump sum payment per hectare format including:
• WTA1 (hypothetical self) – the amount of compensation the respondent would accept to give up his/her land;
• WTA2 (hypothetical other) – the amount of compensation the respondent infers his/her neighbour would say they would accept when surveyed;
• WTA3 (actual other) – the amount of compensation the respondent infers his/her neighbour would actually accept in real life.
Reported in table 5, the amount the respondents indicated that they would be willing to accept to give up their land in Batabo Hill (WTA1) is lower than what the respondents stated that their neighbour would say they are willing to accept when surveyed (WTA2).
Whilst these differences are not statistically significant,Footnote 22 social desirability bias does appear to be present, with respondents deflating their self-reported WTA relative to the (inflated) amount they infer their neighbour would be willing to accept. Respondents appear to be utilising themselves as a reference point when evaluating others (Lusk and Norwood, Reference Lusk and Norwood2009a; Carlsson et al., Reference Carlsson, Daruvala and Jaldell2010), using the survey to enhance their own self-image by stating a higher WTA value for their peers than for themselves (Dunning and Hayes, Reference Dunning and Hayes1996).Footnote 23
The effects of social desirability bias are reported to be stronger when the good is associated with normative motivations, and where pressures from social norms persist (Fisher, Reference Fisher1993; Johansson-Stenman and Martinsson, Reference Johansson-Stenman and Martinsson2006). Carlsson et al. (Reference Carlsson, Daruvala and Jaldell2010) find that the marginal WTP for charitable donations is higher when respondents state their own preferences but lower when respondents state what they believe to be other people's preferences. Yadav et al. (Reference Yadav, van Rensburg and Kelley2013) find that respondents believe they are willing to pay significantly more than others towards landscape protection; portraying themselves as having greater concern for their local environment than the ‘average other’. In this study, it is important for respondents to appear relatively more willing to help conserve the wildlife corridor than their neighbours, demonstrating this via a WTA marginally lower compensation.
Regarding the third measure of willingness to accept (WTA3), the inferred valuation literature suggests that by asking the respondents what they believe their neighbour would actually accept, both hypothetical and social desirability bias are removed, and the value provided is closer to the true valuation, approximately equal to conventional self-reported (non-hypothetical) values (Lusk and Norwood, Reference Lusk and Norwood2009a; Lusk and Norwood, Reference Lusk and Norwood2009b). Here, the estimated mean WTA3 values are lower than both the amount provided via directly questioning the respondents (WTA1) and by asking what they believed their neighbour would say they would accept if surveyed (WTA2).
Paired t-tests for hypothetical bias (WTA2-WTA3) were able to reject the null hypothesis that hypothetical bias is equal to zero. This is consistent with the regression results, where the WTA3 dummy coefficient is negative and statistically significant at the p<0.01 level. Therefore, once both hypothetical and social desirability bias are controlled for, the inferred ‘true value’ is significantly different from the conventional WTA value provided.
One possible explanation for this differential is that, when asked what their neighbour would be willing to accept when surveyed, the thought of potential program payments could have incentivised respondents to act strategically in the hopes of appearing relatively better value than their neighbour (Carson and Groves, Reference Carson and Groves2007), such that WTA1 < WTA2. However, the literature (Pronin, Reference Pronin2007; Lusk and Norwood, Reference Lusk and Norwood2009a) suggests that when asked what their neighbour would actually accept in real life, the respondents recognise the hypothetical bias in others (and themselves) and correct for it, acknowledging that in reality they will accept less compensation than what they say when surveyed, such that WTA3 is less than WTA2 and WTA1.
4.5 Opportunity cost comparisons
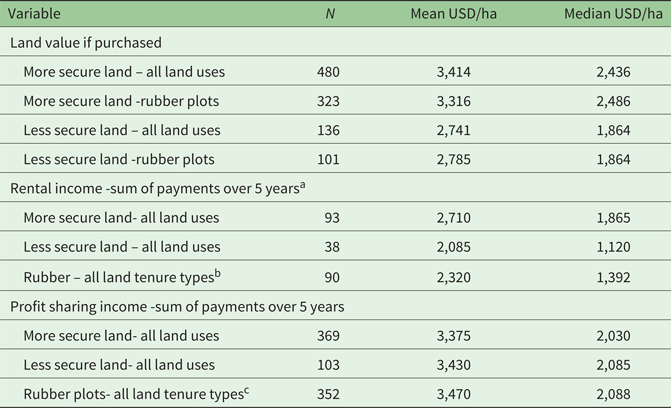
We test the validity of our WTA estimates by comparing the WTA values provided by respondents against local land values in the villages surrounding Batabo Hill and the opportunity costs of not producing rubber. A large discrepancy between these two measures can be indicative of the existence of hypothetical bias (Kaczan and Swallow, Reference Kaczan and Swallow2013).Footnote 24
In Batabo Hill, the most profitable land use is rubber, as informal rules prevent the planting of oil palm in the Protection ForestFootnote 25 (H. Perkasa, personal communication, 2015). The net income from one hectare of rubber over 5 years provides a measure of the opportunity cost of giving up the returns from the plot in Batabo Hill. The opportunity cost was USD3,798 on average, with a range of USD2,107 to USD5,963, reflecting variations in rubber price and discount rates.Footnote 26 The mean WTA value of USD3,920 (WTA3 in table 5) is within this range and close to the mean value, suggesting that the respondents’ valuations are in line with their opportunity costs.
To further test whether the WTA values provided by respondents are in line with the opportunity costs of giving up one hectare of land in Batabo Hill for 5 years, we compare these estimates to the market values of current household land reported by the respondents. These values were elicited based on what the respondents thought:
(a) their plot would be worth if sold today;
(b) their rental income would be if their plot was rented out today;
(c) their profit-sharing income would be if a profit-sharing arrangement was entered into today.
For the analysis, the household plots were divided into two categories based on tenure security. Land classified as ‘more secure’ was typically in the village, and included land that had been inherited, purchased or received from the government or village. Land classified as ‘less secure’ refers to land which had been cleared by the respondent in the forest (i.e., in Batabo Hill), which the household would be expected to have less secure tenure over. On average, households had approximately 2.5 ha of ‘more secure land’ and 2 ha of ‘less secure land’.
The land values provided by respondents in table 6 highlight the differences in tenure security, with ‘more secure’ plots, on average, valued significantly higher than ‘less secure plots’ with respect to purchase values and rental values. The purchase value for one hectare of land with rubber is USD3,316 for ‘more secure plots’ and USD2,785 for ‘less secure plots’ (such as those in Batabo Hill). The five-year rental values for ‘less secure’ land (USD2,085) and for rubber plots of all tenure typesFootnote 27 (USD2,320) are significantly less than the compensation demanded by households to give up their plots in the targeted wildlife corridor (USD3,920 in table 5), highlighting the price premium attached by households to these plots when asked to give them up in a survey situation.
Values provided by respondents based on what they ‘think’ their plot is worth, USD per 1 ha

a103 people gave rental values and profit sharing values for their plots.
bDue to the small sample size, the rental data was not broken down by land tenure categories for different land uses.
cDue to the small number of oil palm plots, the profit sharing land values were not further broken down by land tenure category.
The profit sharing income from rubber plots in the survey (USD3,470 in the last row of table 6), is in line with the opportunity cost of giving up rubber production for 5 years (mean USD3,798). Together, these land values provide a reference to validate the WTA values, which households have an incentive to inflate beyond their true opportunity costs (Kaczan and Swallow, Reference Kaczan and Swallow2013).
WTA may exceed opportunity costs if households include the cost of clearing the re-vegetated land at the end of the 5 years in their WTA estimate. However, the premium placed on the land in Batabo Hill could also be capturing attachment to place and customary values to the land, particularly given households longstanding family ties to the local village and broader district. This value is not fully captured by market prices (Bush et al., Reference Bush, Hanley, Moro and Rondeau2013) and CV methods are valuable in measuring the non-market value to households of giving up access to their land, helping to inform a level of compensation which leaves the household no worse off.
5. Discussion and conclusion
This paper explores the opportunity for a PES program to support the proposed GEF eco-infrastructure proposal. To improve connectivity in a targeted wildlife corridor in Sumatra, Indonesia, the PES program would ‘buy out’ the land from the smallholders for a period of 5 years, allowing time for the understory cover to regenerate, and for the wildlife to return.
How much land in Batabo Hill is needed to support the eco-infrastructure proposal's wildlife connectivity objectives? Under the eco-infrastructure proposal, land needs to be acquired from smallholders to construct the bridges, but additional land on either side of the bridges to encourage the animals to use the underpass is also required. The cost of securing land leading to, and surrounding, the eco-infrastructure is not included in the USD6 million construction budget.
The corridor concept means only specific areas need to be acquired for a successful outcome. With advice from tiger and conservation experts on the most important blocks of land near the eco-bridges, a PES program could target a subset of priority households where the wildlife connectivity payoffs are greatest, piloting the program and establishing the necessary institutional arrangements. One issue to consider is whether farmers who have given up their land as part of the program will simply clear new land elsewhere. However, displacing the agricultural expansion to areas outside of the targeted wildlife corridor will not negate the benefits of the PES program (Wunder et al., Reference Wunder, Engel and Pagiola2008).
This study tests inferred valuation in an open-ended WTA elicitation format. The use of the ‘neighbour’ rather than the ‘average other’ may prove a useful methodological contribution to the inferred valuation literature; particularly for future PES program design applications, and where a reference point (i.e., hectares of land) is required to give meaning to the valuation. We demonstrate the effectiveness of this adaptation in eliciting inferred valuations of rural farm households.
The study finds evidence of hypothetical bias in the conventional WTA values, with a statistically significant difference between what people say they would be willing to accept when surveyed, compared to what they say they would actually be willing to accept in ‘real life’. We find that respondents recognise hypothetical bias in others, and in doing so, the use of inferred questions provides a valid mechanism to mitigate against hypothetical bias in stated preference surveys.
This study provides a contribution to the CV literature, suggesting that studies valuing goods with normative motivations consider the application of inferred valuation techniques to mitigate against hypothetical bias. The WTA and land-valuation analyses provide useful insights not only for the study site but also for other projects involving trade-offs between agroecosystems and wildlife habitat.