Following the Democratic Progressive Party's (DPP) overwhelming defeat by the Kuomintang (KMT) in both the legislative and the presidential elections in Taiwan in early 2008, it was hard to imagine that the DPP could restore its popular support in just two and a half years. The DPP's second administration of 2004–2008 was widely viewed as an unpopular one.Footnote 1 Towards the end of that term, the DPP was severely criticized not only by various opposition forces such as the KMT, but also by a large group from within the DPP. Scholars and pundits have already identified the failures of former president Chen Shui-bian 陳水扁 and his administration which led to their defeat in the 2008 elections, including the administration's dissatisfactory economic performance supposedly owing to its closed-door China policy, the corruption scandals surrounding President Chen and his family members, increased ethnic conflicts and social instability, and the deterioration in Taiwan–US relations caused by Chen's radical and provocative pro-independence policies.Footnote 2
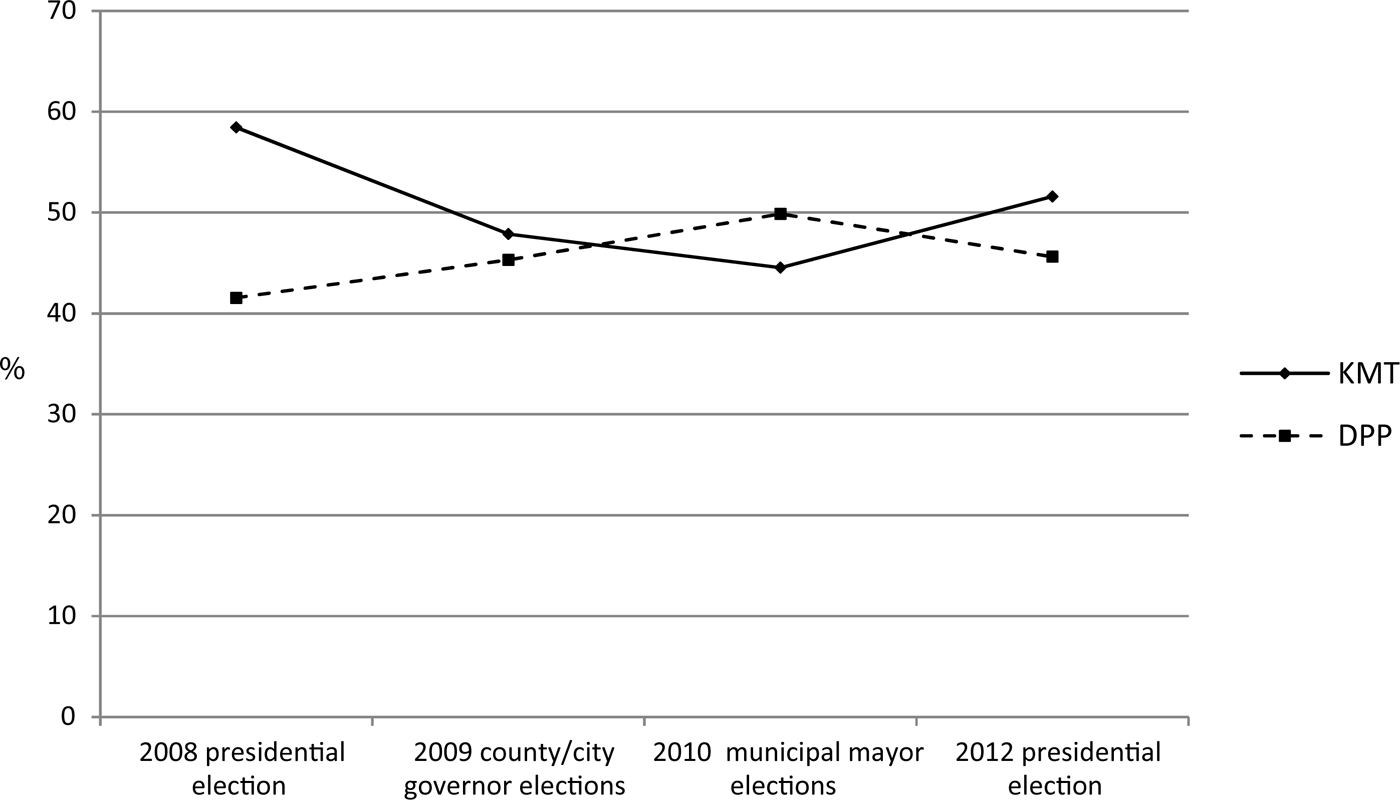
Nevertheless, as Figure 1 shows, since its electoral defeat in 2008, the DPP has been steadily gaining popular support in local elections, and did particularly well in the five important metropolitan city elections in November 2010 (although the DPP won one less mayoral seat than the KMT, its total vote count was over 5 per cent more). The city councillor elections, held together with the mayoral elections, also point to an increase in DPP support. The KMT used to dominate city councils, no matter which party won the mayoral seats,Footnote 3 but on this occasion the DPP's vote share and seats in all the five councillor elections increased significantly. Its average vote share was only 3.3 per cent less than that of the KMT (35.34 per cent versus 38.6 per cent), while the total number of its councillor seats was on a par with that of the KMT at 130. Moreover, popular support amassed by the DPP throughout the whole island from the five city mayoral elections and the 2009 county/city governor elections gave the party 48.21 per cent of the votes, more than the KMT's 45.76 per cent.Footnote 4 Consequently, after the five city elections, the DPP chairwoman, Tsai Ing-wen 蔡英文, declared that “the DPP is already able to compete on an equal footing with the ruling party.”Footnote 5 During the presidential and legislative election in early 2012, the DPP, boosted by its renewed popular support, hit the KMT hard on many social justice issues, making the election race extremely close. In the end, the DPP obtained mixed results from this election: it increased its legislative seats from 27 to 40, but lost the presidential election to the KMT by a 6 per cent margin, although its vote share increased 4 per cent from 41.6 per cent in 2008. In summary, the DPP's election record from 2008 to 2012 indicates that although it successfully managed to restore its popular support in local and legislative elections, this political comeback reached its limit in the presidential election.
KMT and DPP'S Vote Share in Local and Presidential Elections, 2008–2012

In trying to understand the DPP's limited resurgence, most explanations emphasize the short-term political and economic factors since 2008 that have either contributed to or constrained the DPP's political recovery. For example, on the DPP side, the new chairwoman, Tsai Ing-wen, has overseen substantial party reform to rid the DPP of the negative legacies left behind by its former chairman, Chen Shui-bian. Moreover, the performance of DPP local governors has improved significantly since 2008 and ranked much higher than that of the KMT governors in 2010. The party also adopted new and moderate campaign strategies in Taipei 台北市 and Sinbei 新北市 during the five metropolitan city elections. On the KMT side, the Ma Ying-jeou 馬英九 administration failed to lift Taiwan's economy by the end of 2009, and the new administration was also criticized by the public for its ineffective handling of some important national issues, such as the flood caused by Typhoon Morakot in August 2009.Footnote 6 Naturally, increasing popular dissatisfaction with the Ma administration boosted popular support for the DPP and contributed to its improved performance in local elections. On the other hand, many believe that the conservative China policy of 2012 DPP presidential candidate, Tsai Ing-wen, considerably hindered her chances of winning the election.Footnote 7
The aforementioned factors have indeed contributed to or hampered the DPP's political comeback. Nevertheless, this study proposes a broader perspective focusing on the development of, and relations among, globalization, social justice issues, and political and economic nationalism in Taiwan to gain a deeper understanding of the DPP's limited revival since 2008. Specifically, this perspective includes the following propositions.
First, as in many other countries, the Taiwanese government has generally been expected by the public to fulfil two major responsibilities: to increase national wealth by expanding the economy, and to allocate national wealth fairly through various policies, such as taxation and social welfare policies. The government's second responsibility is usually framed as addressing social justice issues in Taiwan.
Second, globalization is a double-edged sword: it can contribute to the country's economic development and help the government to fulfil its first responsibility, but on the other hand, it can bring about various environmental and social problems, such as increasing income inequality, which in turn make it more difficult for the government to fulfil its second responsibility.
Third, since the late 1990s, cross-Strait economic activities have gradually become the most important form of Taiwan's globalization. Increasing Taiwanese investment in mainland China at the expense of that in Taiwan has contributed to Taiwan's rising income inequality and other social justice issues, and has consequently affected many Taiwanese and increased the salience of various social justice issues in Taiwan's politics.
Fourth, with an increased social welfare budget, the DPP administration of 2000–2008 was able to control income inequality better and consequently gained relatively more support from the poorer sections of society. Since 2008 and at the national level, the DPP has shifted its policy focus from identity-oriented political nationalism to social justice-oriented economic nationalism. At the local level, it has further decoupled social justice issues from economic nationalism in order to tackle local social justice issues better without the constraints of nationalist ideology. These strategy changes have been instrumental in resurrecting popular support for the DPP, especially in local and legislative elections. However, the DPP's gradual moderation of political nationalism has led to the decline of nationalist sentiment among those Taiwanese not in a position to benefit from globalization and increased cross-Strait economic activities, which in turn made them less antagonistic to the KMT's China policy in the presidential election.
Finally, in the 2012 presidential election, the KMT's stability and development card, which placed emphasis on the government's duty to create national wealth fast, eventually beat the DPP's social justice card, which prioritized the government's responsibility for allocating national wealth fairly. The main reason behind the KMT victory (and the DPP's defeat) is that the KMT convinced the majority of Taiwanese that only its China policy could maintain the significantly improved cross-Strait relations essential to Taiwan's economic revival. In addition, since 2008, the KMT administration has generally maintained the former DPP administration's social welfare efforts, which helped it to see off the DPP's attacks on social justice issues.
This case study aims to improve understanding of Taiwan's party politics since 2000 by first challenging the popular image of a failed 2000–2008 DPP administration, which was widely believed to be only good at mobilizing “irrational” Taiwanese nationalist sentiment to maintain popular support. Second, it contributes to a deeper knowledge of the characteristics of DPP supporters who, especially the so-called deep-green (shenlü 深綠) fundamentalists, have a popular public image of being overly nationalist and less rational for supporting the unpopular DPP administration. As this study will show, they support the DPP not only because they share a strong Taiwanese nationalist sentiment with the DPP, but also because the DPP's social welfare policies and economic nationalism rhetoric speak to their rational concerns about their own economic security. Therefore, their support for the DPP is down to both nationalist and rational self-interest reasons.
Third, this article shows that, since 2008, the DPP's priority shift from political nationalism to social justice-oriented economic nationalism has contributed to its resurgence, especially in local and legislative elections. However, its moderate political nationalism was still believed by many to be detrimental to the improved cross-Strait relations. In a sense, Taiwanese people feel comfortable giving local and legislative power to the DPP because the DPP seems more willing and capable to fulfil the government's responsibility of addressing various social justice issues. However, the voters gave the state power to the KMT because it seemed more likely to fulfil the government's responsibility of developing Taiwan's economy based on a more flexible political nationalism that promotes cross-Strait relations.
Finally, the increasing salience of social justice issues in Taiwan's democratization and recent political development has already received the attention of some scholars. In contrast to their studies, which usually separate social justice issues from Taiwanese nationalism, this study attempts to show the new social justice turn of Taiwanese nationalism. In other words, since 2008, the Taiwanese nationalism championed by the DPP has been embracing a more social justice-based agenda and trying to combine political and economic nationalism in a more balanced way. This may have significant implications for both Taiwan's domestic politics and cross-Strait relations.
Following this perspective, the next section discusses the capital flight from Taiwan to mainland China, its contribution to rising unemployment and income inequality in Taiwan, and the DPP administration's improved social welfare budget. The article goes on to demonstrate how the less well-off segments of Taiwanese society gradually switched their support from the KMT to the DPP between 1996 and 2008. It then further explores the dual characteristics of this group of voters in Taiwan – their stronger nationalist sentiment and concerns about economic security – and shows how they relate these to the DPP's different balance between political and economic nationalism. The article then explains the DPP's limited resurgence since 2008 and ends with a discussion of some of the implications of this study.
Globalization, Social Justice Issues and the DPP's Efforts to Improve Taiwan's Social Welfare System
Most countries have found that globalization cuts both ways. It maximizes global investors' profit by optimizing the utilization of capital, labour, land, technology and many other productive resources in different countries, and as a result, develops those countries' economies. On the other hand, it also brings a variety of social justice issues to both developed and developing countries. One of the most prominent and persistent issues is the increasing wealth disparity in many parts of the world.Footnote 8 The causal relations between globalization and wealth disparity are complex, but the basic mechanism is that those who have capital and better skills gain much more income from economic globalization than those who have no such resources. As the two groups' unequal gains accumulate constantly, income inequality in these countries increases. While globalization has become irresistible to most countries, governments are expected by their people to minimize social justice issues related to globalization, such as the better control of income inequality.
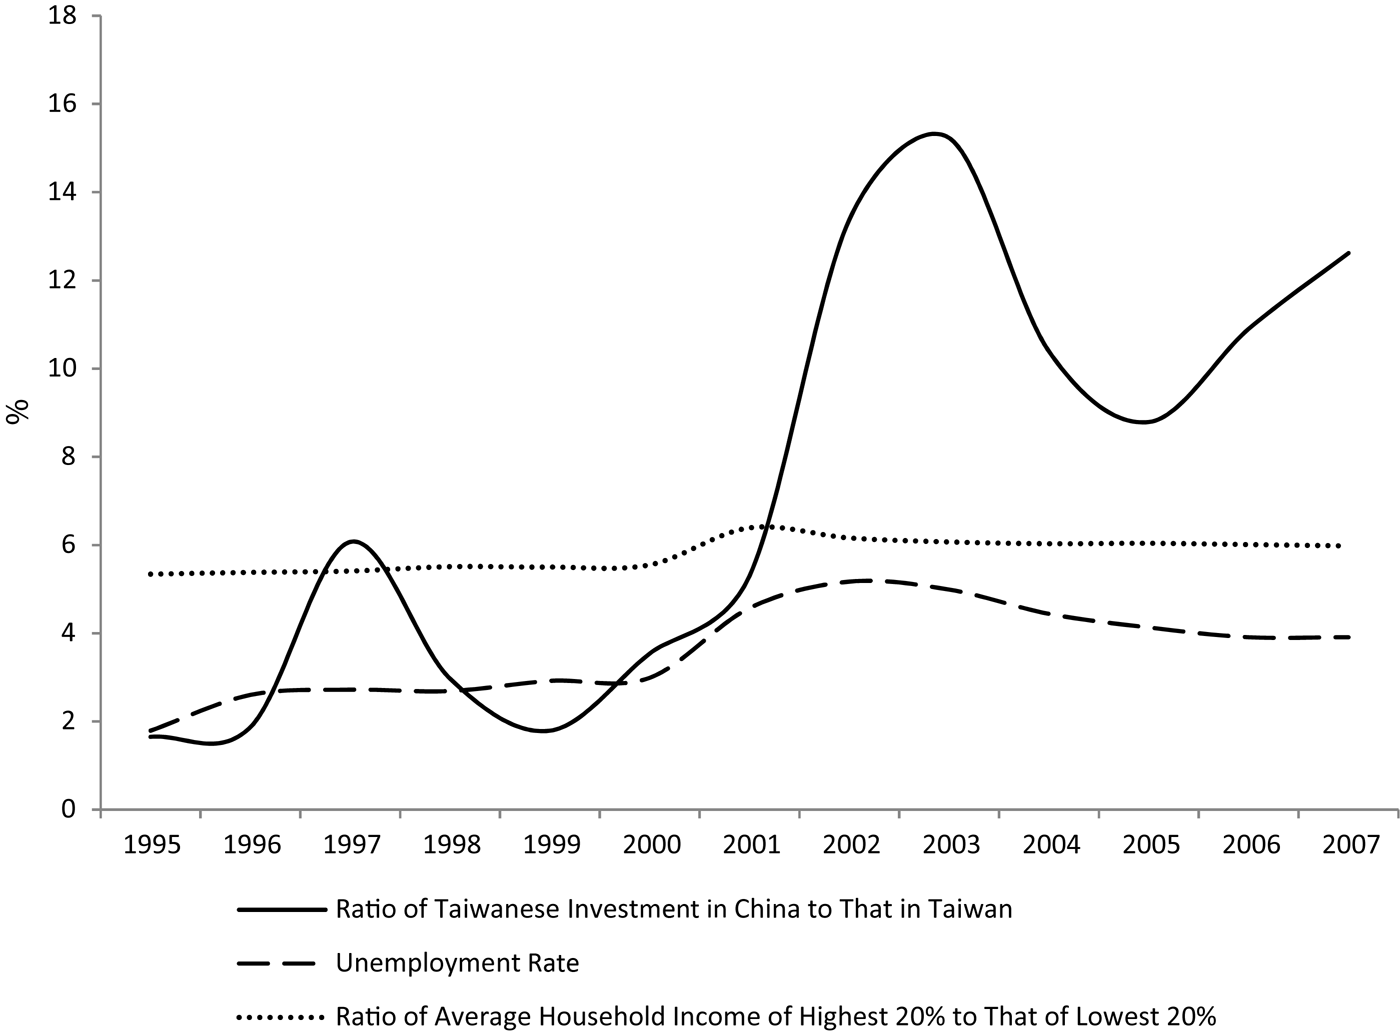
Taiwan's main form of globalization has been cross-Strait economic activities.Footnote 9 The increasing investment flow from Taiwan to mainland China has been one of the most important factors contributing to Taiwan's social justice issues.Footnote 10 For Taiwanese investors and the highly skilled labour that can follow the capital, investing in China can result in better profits and well-paid jobs; in contrast, for the less skilled who have no chance to work there because of competition from much cheaper mainland Chinese labour, this investment flight means fewer jobs in Taiwan.Footnote 11 In developed economies like Taiwan, unemployment significantly contributes to economic inequality. Figure 2 shows the overall development trends of three indicators from 1995 to 2007 in Taiwan. Generally, the ratio of investment in mainland China to that in Taiwan has significantly increased over this 12-year period. The correlations between the three indicators, as shown by Table 1, are highly positive and significant, suggesting that increasing investment in mainland China at the expense of that in Taiwan may contribute to the rise of unemployment and income inequality in Taiwan.
Development Trends of Investment, Unemployment and Inequality in Taiwan, 1995–2007
Pearson Correlations between the Three Indicators of Investment, Unemployment and Inequality, 1995–2007
Note: **Correlation is significant at the 0.01 level (2-tailed).
Source: As for Figure 1.
It is not just those at risk of unemployment – supposedly a small section of the population – who feel the pressure of globalization; a much larger share of the population believed that their social and economic status had declined over the past few decades. Lin's research shows that, in 1992, while about 40 per cent of Taiwanese identified themselves as middle class, that figure had fallen to about 32 per cent in 2007. In contrast, during the same period, the percentage of Taiwanese identifying themselves as lower middle/lower/working class increased from about 50 per cent to about 64 per cent.Footnote 12 This clearly indicates an increased sense of economic insecurity in Taiwanese society.
Unemployment, income inequality and economic insecurity as a result of globalization are common to many parts of the world and have profoundly influenced institutional and non-institutional politics such as elections and social movements. There has been a rise in populist, leftist, progressive and social democratic appeals in many countries' elections, as well as a variety of anti-globalization movements across the world over the past few decades, and Taiwan is no exception. Although the politics of Taiwan's democratization and its consolidation during the past three decades have been mainly characterized by political cleavages caused by ethnic and unification/independence issues, some scholars have recently turned their attention to the role of social justice issues. For example, regarding class politics, Yang finds that around the mid-1980s, it was not the middle classes but the rural and urban working classes that showed stronger support for the opposition (dangwai 黨外) movement and the DPP.Footnote 13 Hu, Lin and Wong discuss the revival of class politics in Taiwan since the 1990s,Footnote 14 and Kevin Wong explores the emergence of class division since 2000 owing to the economic integration of Taiwan and mainland China, and looks at how the DPP strategically politicized the enlarging cleavage to attract support from less skilled labour.Footnote 15 In reference to social welfare issues in Taiwan's politics, Aspalter shows that, since the 1980s, increasing electoral competition from the opposition movement and the DPP forced the authoritarian KMT regime to expand its conservative social welfare system, which had until then mostly benefited the mainlanders, to cover much larger segments of the population.Footnote 16 Joseph Wong believes that the increasing salience of progressive politics aimed at addressing various social justice issues in Taiwan indicates the deepening of Taiwan's democracy.Footnote 17
In general, the above studies imply that to understand Taiwan's electoral politics better, in addition to the popular ethnic and nationalist issues, social justice issues such as different parties' social policies should also be taken into account. Furthermore, the studies also suggest that the DPP, as a centre-left party opposed to the centre-right KMT, has been the leading force in addressing Taiwan's various social justice issues. Following this line of thought, the bonds between the DPP and its support base may be better understood from a new angle of social justice. In other words, the main reasons that people support the DPP may not only be due to the DPP's nationalist stance on Taiwan's independence issues, as the popular perspective of Taiwanese political nationalism suggests, but also because of its policies on social justice issues. Therefore, to understand the decline and rise of popular support for the DPP, we should look into the interactive dynamics between the DPP and its social base around both nationalist and social justice issues.
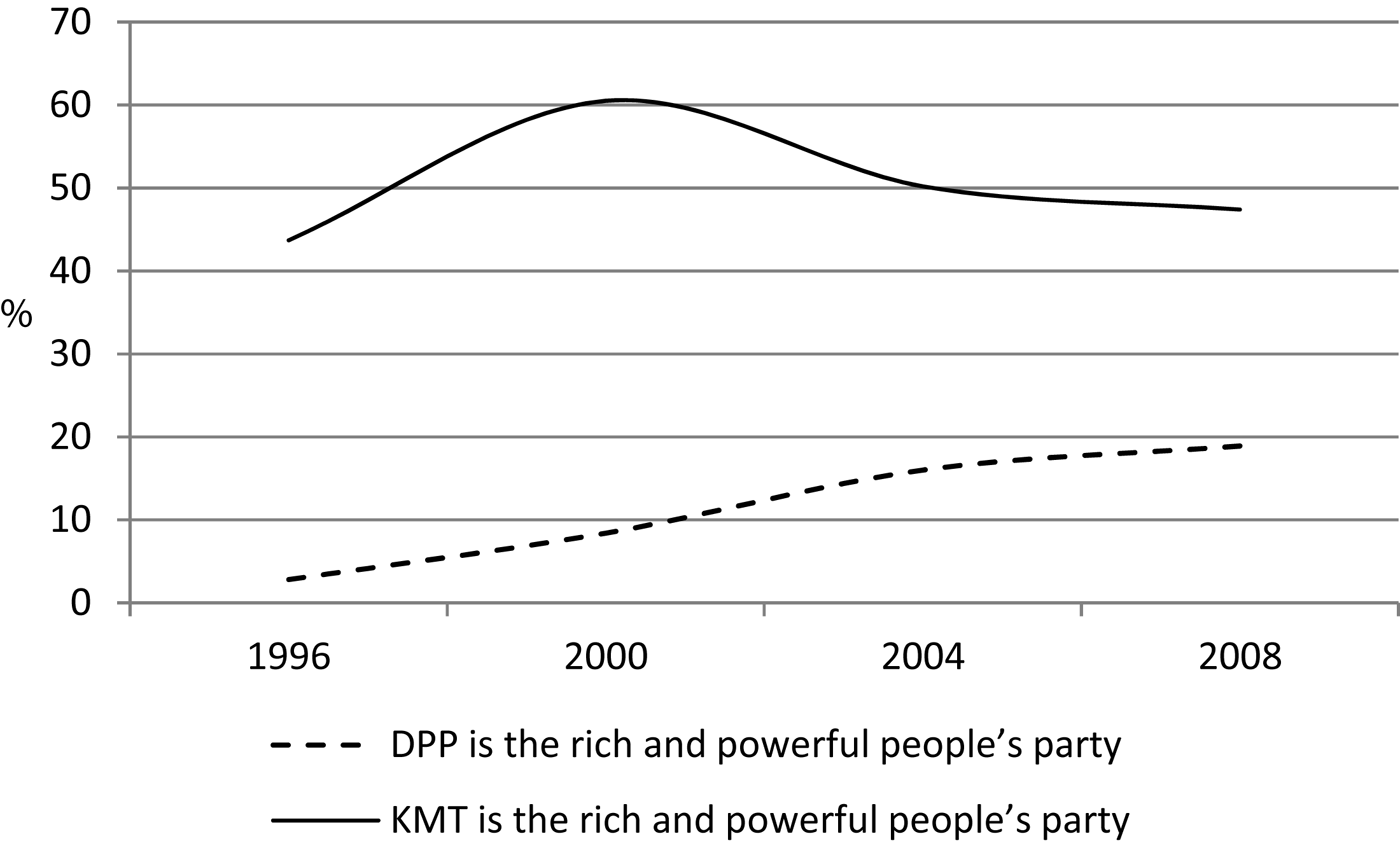
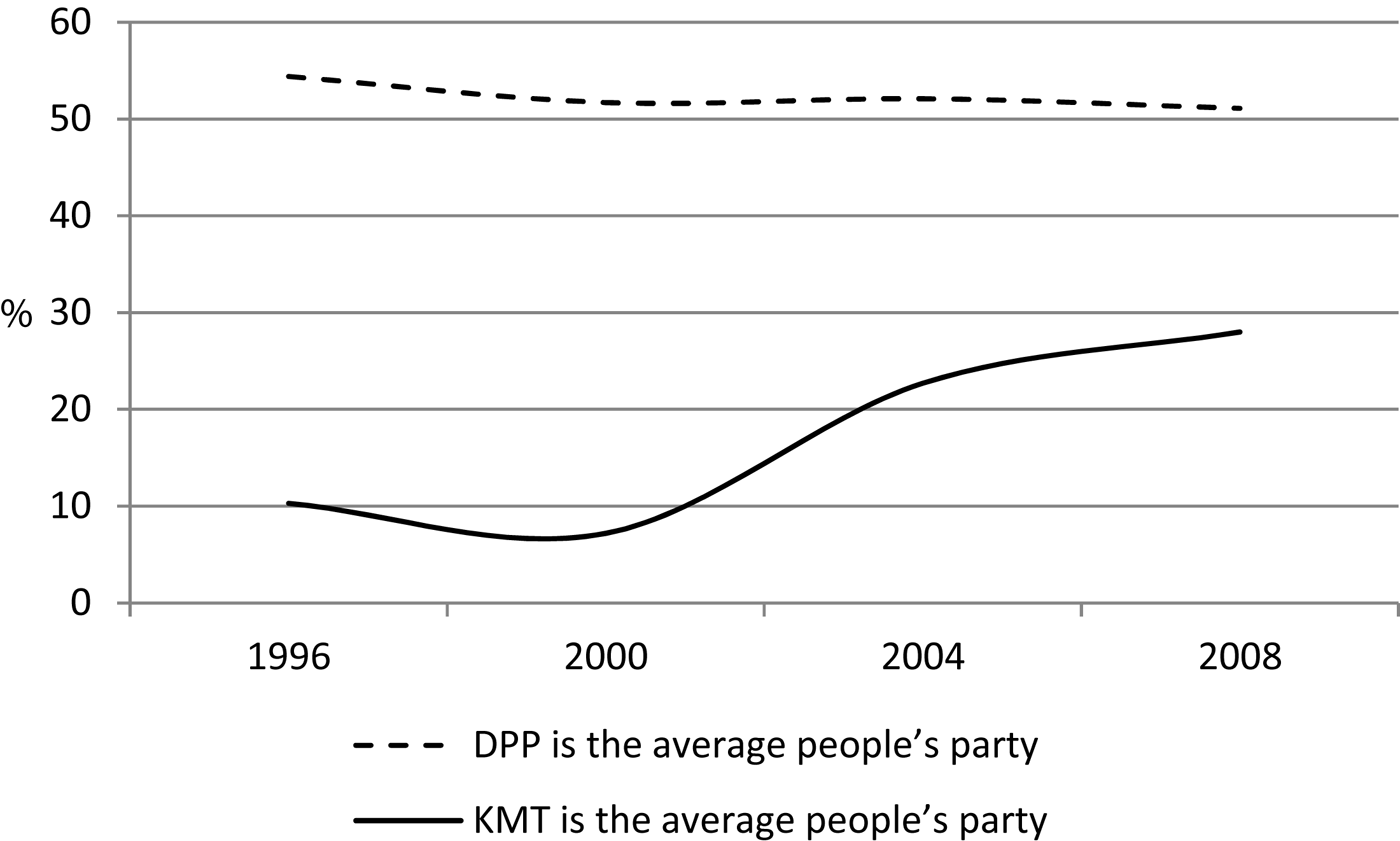
In general, social justice issues reflect cleavages and conflicts between privileged, rich and powerful people and the underprivileged, poor and ordinary ones on a variety of issues related to wealth and the allocation of resources. Indeed, while it is acknowledged that the DPP is seen as a pro-independence party, what is less well-known is that most Taiwanese people see the DPP as the ordinary people's party, in contrast to the KMT, which is mostly viewed as the rich and powerful people's party. This is clearly shown in Figures 3 and 4.Footnote 18 For example, in 2008 nearly half of all people surveyed believed that the KMT represented the interests of the rich and powerful, whilst 51.1 per cent believed that the DPP represented the ordinary person.
Percentage of People Who Believe That KMT/DPP Represents the Interests of the Rich and Powerful
Percentage of People Who Believe That KMT/DPP Represents the Interests of the Average Person
The present study proposes that the Taiwanese nationalism promoted by the DPP has been a combination of political and economic nationalism: political nationalism aims at Taiwan's de jure independence from China, while the objective of economic nationalism is to protect the welfare of less affluent or advantaged Taiwanese through a restrained China policy. The Chen Shui-bian administration of 2004–2008 radicalized political nationalism to consolidate its support from the deep-green faction after it was attacked by both the opposition forces and members from within the DPP. This radicalization seemed to serve Chen's personal political purposes well, but caused conflict and instability in society and between Taiwan, China and the US, and finally alienated moderate supporters from within and outside the party. However, the failure of radical political nationalism does not necessarily mean that the Chen administration also failed in promoting economic nationalism. Its performance on tackling social justice issues may help the DPP to maintain its credibility as a centre-left party championing economic Taiwanese nationalism.
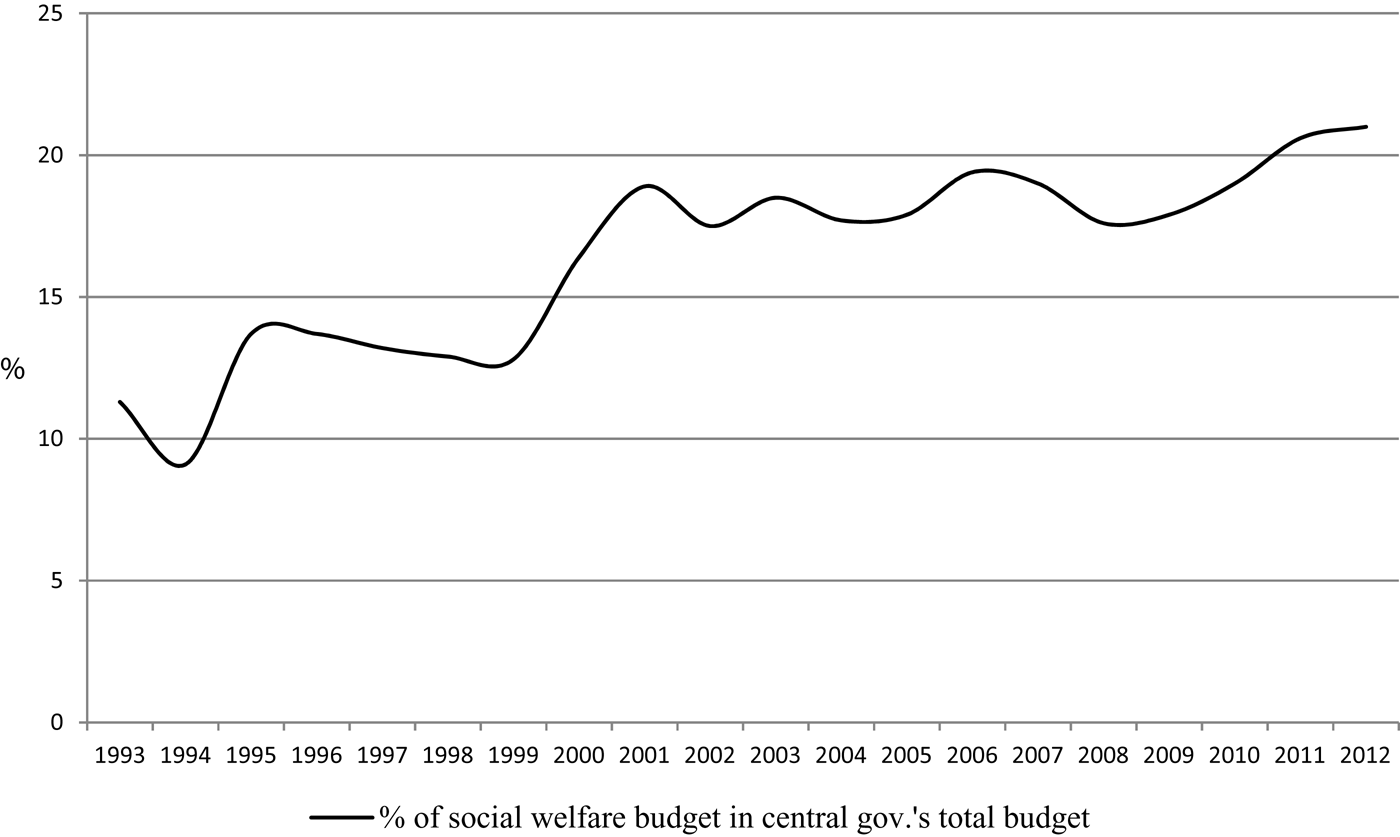
The DPP has been a pro-social welfare party with a strong social democratic orientation since its foundation in 1986. Before it took power in 2000, social welfare issues such as pensions had been one of its major appeals in local and national electoral campaigns. Studies have shown that owing to the DPP's strong push for more equal and better social welfare, Taiwan's social welfare system significantly improved in the 1990s.Footnote 19 During its eight years in office, although the DPP became less progressive in some social welfare and environmental fields, and was consequently criticized by some civil organizations, it actually significantly increased central government expenditure on social welfare. From the figures presented in Figure 5, it can be calculated that while the average percentage of the social welfare budget in the central government's total budget was 12.4 per cent from 1993–1999 under the KMT regime, it was 18.2 per cent during the DPP administration, an increase of 5.8 per cent.
Percentage of Social Welfare Budget in Central Government's Total Budget, 1993–2012
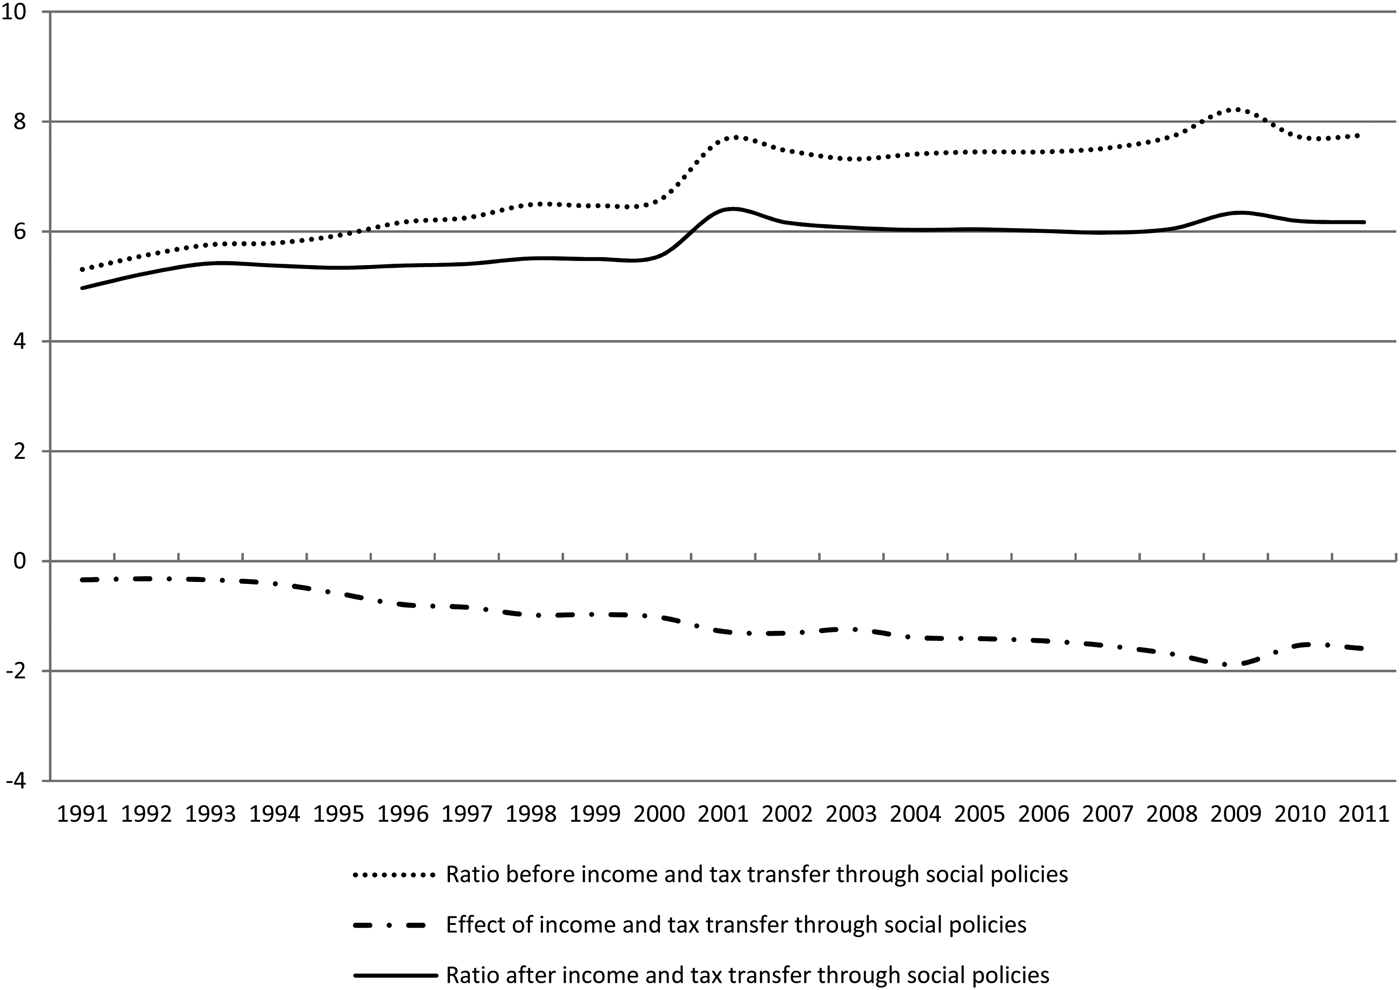
Figure 6 shows that, with the help of income and tax transfers provided by taxation and social welfare policies, the constantly rising trend of income inequality was suppressed during the DPP administration. Actual income inequality dropped almost continuously during the last six years of the DPP administration, from 6.39 in 2001 to 5.98 in 2007. In contrast, during the two KMT administrations (1991–1999; 2008–2010), income inequality had an apparently rising trend, increasing from 4.97 to 5.50 during 1991–1999 and from 6.05 to 6.17 during 2008–2011.
Ratio of Average Household Income of Highest 20 Per Cent to That of Lowest 20 Per Cent (Measure of Income Inequality), 1991–2011
DPP's Support Base
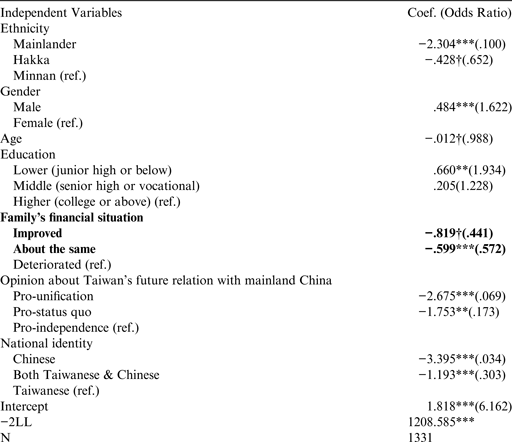
The major beneficiaries of the DPP administration's improved social welfare efforts were the financially less well-off. Did the DPP successfully win their hearts? The regression of votes for the DPP in the 2008 presidential election shown in Table 2 provides a positive answer. The dependent variable in the regression is binary: a DPP vote versus KMT vote. The interested independent variable is each respondent's family's economic situation. It is a categorical variable including three possible answers to the question: “Would you say that, over the past year, your own household's financial situation has (1) improved, (2) stayed about the same, or (3) deteriorated?”
Binary Logistic Regression of Individuals' Votes for the DPP, 2008
Source: TEDS2008P.
Note: †p ≤ .1, *p ≤ .05, **p ≤ .01, ***p ≤ .001, vote for the KMT is the reference category.
The regression also includes gender, age, ethnicity, education and two nationalist sentiment indicators as control variables. One of the nationalist sentiment indicators is self-claimed national identity, including Taiwanese, Chinese, and both Taiwanese and Chinese. The other indicator is the respondent's opinion on Taiwan's future relationship with China, which also includes three categories: pro-independence, pro-unification and pro-status quo. The respondents who identified themselves as Taiwanese only or had pro-independence opinions are defined as having Taiwanese nationalist sentiment. The regression shows that people whose financial situations had deteriorated were more likely to vote for the DPP in 2008 presidential election.
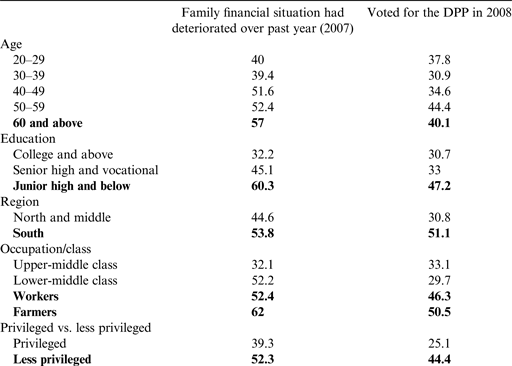
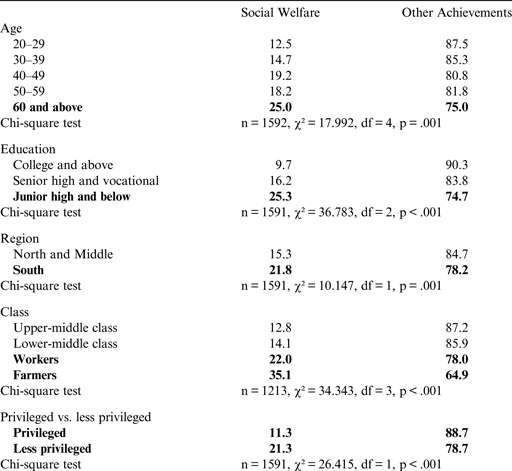
Next, it is necessary to know the social characteristics of those whose households had suffered financially. Table 3 indicates that, in 2008, people who were less educated (i.e. junior high or below), southern Taiwan residents or farmers were most likely to be worse-off, and most likely to vote for the DPP in their social category defined, respectively, by education, residence region and class/occupation. In addition, among the five age groups, the oldest group (60 and above) had suffered the most financially and showed the second highest level of support for the DPP. Workers were the second most financially worse-off group among the four class groups and showed the second highest level of support for the DPP. Their level of DPP support was much closer to that of farmers than to those of the upper and lower middle classes. Therefore, workers were more like farmers in terms of vote choice. In general, it seems clear that the household finances of the elderly, less educated, southern Taiwan residents, workers and farmers had deteriorated the most, and that these groups were more likely to vote for the DPP.
Percentage of Worse-off Families and Votes for the DPP in Each Social Group, 2008
(Unit: % of people in each social group, i.e. row %)
Source: TEDS2008P.
The most obvious commonality shared by these five social groups is that it is generally assumed that, in a highly globalized economy like Taiwan, they will be in an economically less privileged position. The older generation, the less educated, workers and farmers usually have little opportunity to follow the capital flight to China and reap the benefits of globalization. People in southern Taiwan are also less likely to gain from globalization, as cross-Strait economic activities, such as trade and investment, are usually concentrated in northern and central Taiwan. At the same time, they are more likely to be negatively affected by the outward flow of investment. Therefore, we can define people from one or more of those groups as “the less privileged” in Taiwan's globalization. Conversely, those who have none of these characteristics may be termed “the privileged.”
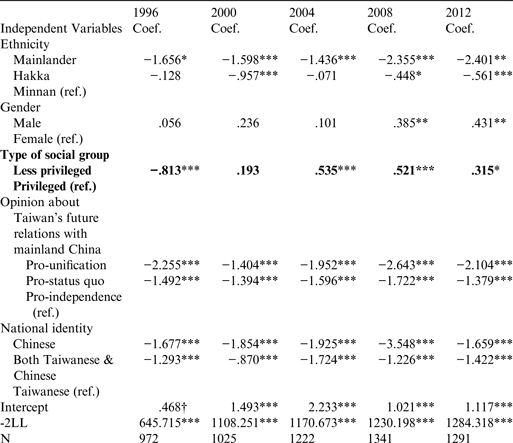
It is important to know whether the less privileged have always been more likely to support the DPP in presidential elections. Table 4 shows a clear trend that after the DPP took power in 2000, the less privileged switched their support from the KMT to the DPP. Specifically, in the 1996 presidential election, people from the less privileged groups were more likely to vote for the KMT, and in 2000, there was no significant difference between the less privileged and the privileged in their voting decisions; but in 2004, the less privileged became more likely to vote for the DPP, and their significantly stronger support for the DPP continued in 2008 and 2012. Additionally, Table 5 shows that, relatively speaking, in 2008 the less privileged segments of Taiwanese society were more likely to choose “social welfare” as the DPP administration's best achievement. Therefore, it seems that the DPP administration's performance on social welfare issues had a significantly positive and lasting effect on their support from the less privileged groups.
Binary Logistic Regressions of Individuals' Votes for the DPP
Source: See footnote 18, except for the 2012 model, which uses TEDS2012 (NSC 100-2420-H002-030). TEDS2012's principal investigator is Professor Yun-han Chu.
Note: †p ≤ .1, *p ≤ .05, **p ≤ .01, ***p ≤ .001, vote for the KMT is the reference category.
Percentage of People in Each Social Group Choosing Social Welfare as the Chen Administration's Best Achievement in its Second Term, 2008
(Unit: % of people in each social group, i.e. row %)
Source: TEDS2008P.
In general, the findings about the social characteristics of Taiwan's less privileged groups tallies with two previous studies on the characteristics of the DPP's deep-green supporters. Cheng shows that, around the mid-2000s, deep-green supporters were likely to be older, less educated and working class.Footnote 20 Wang, Cheng and Chen similarly found that, in 2007, deep-green support was strongest amongst older people, people with less education and those from rural areas, especially southern Taiwan.Footnote 21
Concerns of the Less Privileged Taiwanese and the DPP's Political and Economic Nationalism
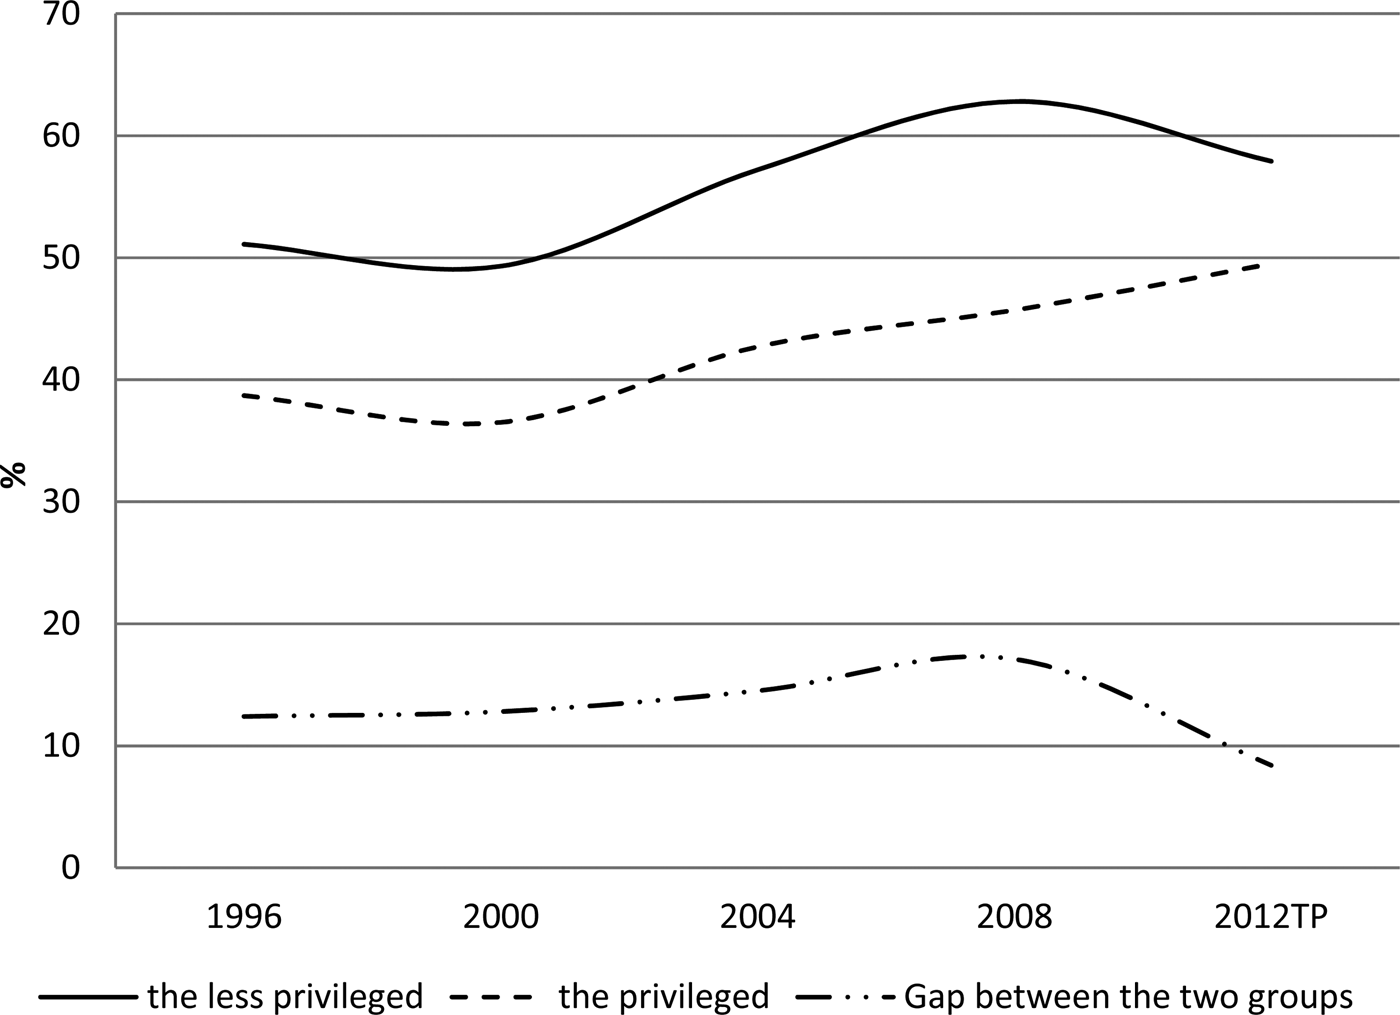
To understand better the underlying motivations of the less privileged Taiwanese's support for the DPP, it is necessary to look further at their shared characteristics. As shown by Figure 7, Taiwanese nationalist sentiment has always been stronger among the less privileged groups than the privileged.Footnote 22 Specifically, in 1996 the proportion of the less privileged with Taiwanese nationalist sentiment is 12.4 per cent higher than that of the privileged. This gap increased to 17.1 per cent in 2008. Many studies have shown that those with Taiwanese nationalist sentiments are more likely to support the DPP, so it seems reasonable to suspect that the less privileged Taiwanese's stronger support for the DPP is entirely down to their stronger Taiwanese nationalist sentiment. However, the regressions in Table 4 demonstrate that, even after controlling for Taiwanese nationalist sentiment, the less privileged Taiwanese were still significantly more likely to vote for the DPP in 2004, 2008 and 2012. In other words, having Taiwanese nationalist sentiment and being less privileged both have independent and positive effects on people's support for the DPP.
Level/Per Cent of Nationalist Sentiment among the Less Privileged and the Privileged, 1996–2012
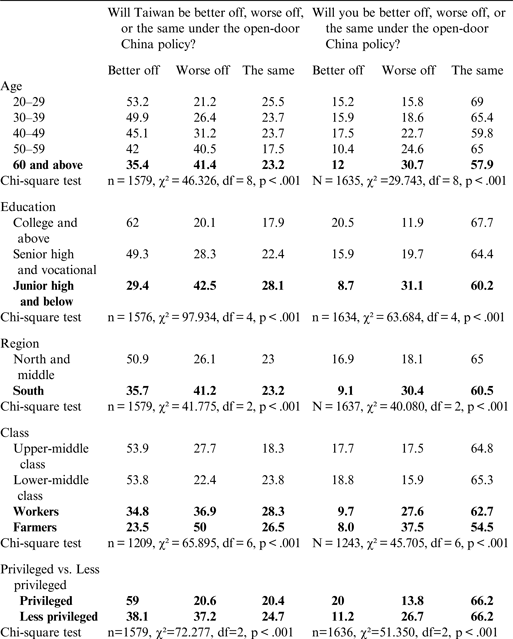
This leads to a further question: in addition to stronger Taiwanese nationalist sentiment, what other reasons lead voters from a less privileged background to support the DPP? The previous section indicates that it may be owing to the DPP administration's better performance on social welfare issues which benefited this section of Taiwanese society. Another major characteristic of the less privileged provides a clue. Table 6 shows that, in 2008, those from less privileged groups were more likely to believe that both Taiwan and themselves would become worse off under the open-door China policy; they are also less likely to believe that both Taiwan and themselves would become better off under that policy.Footnote 23
Percentage of People in Each Social Group Possibly Approving or Disapproving the Open-door China Policy, 2008
(Unit: % of people in each social group, i.e. row %)
Source: TEDS2008P.
The stronger nationalist sentiments found among the less privileged Taiwanese and their concerns about the open-door China policy were echoed in the DPP's nationalist rhetoric.Footnote 24 In general, since 2000, this nationalist rhetoric has comprised of political nationalism aimed at protecting Taiwan's current de facto independence and pursuing its future de jure independence, and economic nationalism aimed at protecting the less privileged groups' welfare with a conservative China policy. For both nationalisms, mainland China is viewed as the largest threat by the DPP. Therefore, the DPP has argued that Taiwan needs a conservative and restrained China policy in both political and economic fields and that the KMT's open-door China policy will jeopardize both Taiwan's de facto independence and the welfare of less privileged Taiwanese.
What distinguishes the nationalist rhetoric of Chen Shui-bian in his second administrative term of 2004–2008 from that of Tsai Ing-wen during 2008–2012 is the change in focus from political to economic nationalism. To divert public attention away from the scandals surrounding his family and administration and to maintain the deep-green's support, Chen radicalized political Taiwanese nationalism by enshrining the goal of Taiwan's independence and the act of loving Taiwan. The message that this brought to the public was that nothing was more important than pursuing Taiwan's independence and loving Taiwan, and that no one upheld this more than Chen and his administration. It also justified Chen's closed-door policy towards China: although it might be detrimental to Taiwan's economy, it was a necessary step in order to protect Taiwan's independence. In summary, the whole argument of this radical political nationalism was that Taiwan's independence was the highest national priority and pursuing this goal was the most sincere manifestation of loving Taiwan; Chen and his administration's policies were the best way to achieve Taiwan's future independence and therefore they loved Taiwan most; anyone who challenged their policies was opposed to Taiwan's independence and therefore was a “China conspirator” who did not love Taiwan.
In contrast, after the DPP lost power in 2008, party moderates, including Tsai Ing-wen, gradually took over the party and reined in Chen's radical political nationalism, which had become a major liability for the party. The DPP moderates seem to be both idealists and pragmatists. They are committed to a vision of political Taiwanese nationalism, which is Taiwan's de jure independence, but have a clear understanding of the tremendous difficulties of pursuing this goal. They oppose the use of radical ways to address these difficulties, and particularly dislike the political manipulation of independence issues for personal gain in politics. In terms of cross-Strait relations, they share the radicals' worries about China's efforts to incorporate Taiwan through economic means, but do not think that completely isolating Taiwan from China is a rational choice. Instead, they suggest gradual, careful and transparent exchanges between the two sides of the Taiwan Strait.
Although Tsai and other moderates abandoned radical political nationalism, they still have concerns about China's threat to Taiwan's national security and future independence. On the other hand, in order to protect the less privileged Taiwanese who are threatened by increased cross-Strait investment, they have prioritized economic nationalism. These dual concerns have become apparent in the DPP's opposition to the Economic Cooperation Framework Agreement (ECFA) since 2008. In terms of national security, the DPP has argued that the ECFA will lead to Taiwan's economic integration with mainland China and then its eventual political integration, as anticipated by the Chinese government. In her debate with President Ma Ying-jeou on ECFA issues, Tsai stated that the DPP's preferred option would be for Taiwan to open to “the world,” especially developed economies such as the US, before approaching China. This is in contrast to the KMT's ECFA scheme of opening to China first, and then going to “the world” through China.Footnote 25
Another major concern raised by the DPP in its argument against the ECFA is its potential negative impact on Taiwan's social equality. The DPP believes that the ECFA will only benefit a few large enterprises and the more privileged section of society; Taiwan's small and middle enterprises (SME), the middle and lower classes, and those living in middle and southern Taiwan will gain little or even lose out in terms of wages and business opportunities. It believes that the gap in incomes will significantly widen in Taiwan as a result and cites Hong Kong as an example to support their argument: income inequality increased in Hong Kong after it signed the Closer Economic Partnership Arrangement (CEPA) with China.Footnote 26
DPP's Limited Resurgence, 2008–2012
To understand the DPP's comeback in local and legislative elections and its limitations in the presidential election, it is necessary to evaluate the Ma Ying-jeou administration's general performance since 2008. In the 2008 presidential election, Ma Ying-jeou's unprecedented landslide victory was driven by popular dissatisfaction with Chen Shui-bian and his administration in four areas: the corrupt practices of Chen, his family members and his close government officials; the disappointing economic performance supposedly caused by his closed-door China policy; increasing ethnic conflicts as a result of his radical pro-independence and ethnically divisive policies; and the deterioration in Taiwan's international relations, especially with the US, caused by Chen's provocative pro-independence policies. The Taiwanese people expect the Ma administration to perform better in these areas, and in general, Ma's report card does not disappoint: Ma and his administration have no serious corruption scandals; Taiwan's economy has survived the 2008 world financial crisis and the ECFA with mainland China is expected to boost Taiwan's economic revival quickly; ethnic tension in Taiwan has declined visibly; and Taiwan's relations with the US have improved.
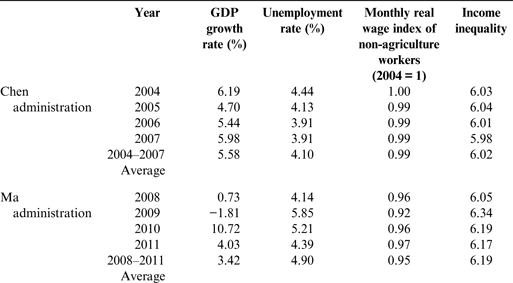
However, a closer look at the Ma administration's key economic and social performance indicators in Table 7 reveals that its performance was actually worse than that of the Chen 2004–2007 administration in some important fields. In terms of GDP growth, Table 7 shows that the Chen administration maintained a fairly stable growth rate. In contrast, the world financial crisis of 2008 impacted Taiwan negatively, registering extremely slow and negative GDP growth in the first two years of the Ma administration. It was only in 2010 that the Taiwanese economy bounced back with a two-decade high of 10.72 per cent. However, the rebound was short-lived; in 2011, Taiwan's economic growth dipped to 4.04 per cent. Overall, Taiwan's economy experienced its worst economic setbacks during Ma's first term in office. With an average annual growth rate of 3.42 per cent, Ma's economic performance was worse than Chen's (5.58 per cent).
Comparison of Key Economic and Social Performance Indicators under the Ma and Chen Administrations
Source: Copy and recalculation of the data from Directorate General of Budget, Accounting and Statistics and Council of Labor Affairs, Executive Yuan, ROC.
In terms of issues related to social justice such as unemployment levels, income inequality and the real wage index, the Ma administration also performed worse than the Chen administration. The average unemployment rate and income inequality were both higher under Ma than the average numbers during the Chen administration. On average, the real wage during the Ma administration declined by 5 per cent from the 2004 level, while it only declined by 1 per cent during the Chen administration. Unemployment and real wage decline impact the masses more tangibly than any positive impact of GDP growth, and so the DPP criticized the economic recovery under the Ma administration for being a “recovery unfelt by people.”Footnote 27
With the above comparison, it is not difficult to understand why the DPP campaigned on social justice issues in both the local and national elections after 2008, and as a result gained increasing support. In the national presidential election, because nationalist issues such as cross-Strait relations were a major concern for the majority of voters, the DPP linked social justice issues to nationalism and presented the public with a policy of strong economic nationalism. As we have discussed previously, the DPP's argument that Ma's open-door China policy would not only jeopardize Taiwan's de facto independence, but would also have a negative impact on various social justice issues provided the reasoning behind the DPP's promotion of social justice-oriented economic nationalism against China. However, in local and legislative elections, the DPP usually decoupled social justice issues from economic nationalism because nationalism played a much less important role in local elections. For example, during the five municipal elections in November 2010, the DPP more or less ceased their attacks on the ECFA and concentrated instead on highlighting the KMT local governors' incompetence in addressing various social justice issues.
The DPP's general strategy is to use a different focus at the local level from the national level. At the national level, the DPP has moderated its political nationalism and prioritized social justice-oriented economic nationalism to maintain the support of the less privileged Taiwanese and attract swing voters. The regression of the Taiwanese's vote choice in the 2012 presidential election in Table 4 indicates that the DPP successfully maintained this group's support in the election. At the local level, the decoupling of social justice issues and economic nationalism has reduced the constraints of nationalist ideology in local elections, and has consequently improved the DPP's flexibility in framing local social justice issues and proposing policy solutions to voters. In general, this strategy worked well for the DPP, especially at the local level; the puzzle is why the DPP still lost to the KMT in the presidential election.
In the 2012 presidential election, owing to huge public concern with cross-Strait relations, the result rested largely on the KMT and the DPP's China policies. As previously discussed, Ma Ying-jeou's economic and social performance did not particularly outshine Chen Shui-bian's. However, using a flexible political nationalism along with the principles of “no unification, no independence, and no use of force” and the “1992 consensus,” his efforts to improve cross-Strait relations have been substantial, visible and, most importantly, successful. The signing of the ECFA is considered by the Ma administration to be one of the most important contributory factors in Taiwan's economic revival.
To counter the “1992 consensus,” Tsai Ing-wen proposed the “Taiwan consensus” as the cornerstone of her China policy. She described the “Taiwan consensus” as the democratic way to achieve a consensus in Taiwan, which would provide a more legitimate basis for the future administration's China policy. However, the outcome of the “Taiwan consensus” would not be known until this democratic process, in the form of a referendum, was held. The “Taiwan consensus” appeared to be a way for Tsai to escape from her disadvantaged position on cross-Strait issues. In reality, however, it did not address the public's concern about whether her China policy could further improve or even maintain current cross-Strait relations. To allay the fears of swing voters about her China policy, Tsai gradually shifted her position on the ECFA from complete rejection to acceptance. She also promised that the current amicable cross-Strait relations would be maintained under her future administration. This promise lost ground when the Chinese government insisted that good cross-Strait relations would only be possible if Tsai accepted the “one-China policy” implied in the “1992 consensus.” Although Tsai and the DPP have toned down their radical political nationalism since 2008, it is still impossible for them to accept either the “1992 consensus” or “one-China policy.” Throughout the election campaign, Tsai enjoyed much less public trust and support than Ma on cross-Strait issues. Tables 8–10 show the results of a survey conducted shortly before the presidential election on Ma's performance and policy of managing the cross-Strait relations. Two findings are telling. The less privileged were still less likely than the privileged to be satisfied with Ma's performance on managing cross-Strait relations, to believe that Taiwan's overall economy had improved because of the ECFA, and to support the continuation of the “1992 consensus.” This may further explain the less privileged groups' relatively weak support for the KMT (and relatively strong support for the DPP). However, on the other hand, even within the less privileged groups, more people were happy with Ma's performance and policy on cross-Strait relations than were unhappy. This may imply that the support generally received by the less privileged Taiwanese groups might have been impacted by the latter's high approval of Ma's cross-Strait performance and policy in the presidential election. The last rows in Tables 8–10 also indicate that, shortly before the election, more people overall approved of Ma's China policy and the continuation of the “1992 consensus” than disapproved.
Are You Satisifed or Dissatisfied with President Ma's Performance Managing Cross-Strait Relations in the Past Three Years?
(Unit: % of people in each social group, i.e. row %)

Source: TEDS2012-TP.
Has Taiwan's Overall Economy Improved, Declined or Remained the Same because of ECFA?
(Unit: % of people in each social group, i.e. row %)

Source: TEDS2012-TP.
Should We Continue to Use “1992 Consensus” to Negotiate with Mainland China?
(Unit: % of people in each social group, i.e. row %)

Source: TEDS2012-TP.
Several other factors might have impacted the less privileged Taiwanese groups' overall support for the DPP in the presidential election. First, Figure 7 indicates that shortly before the election, the less privileged Taiwanese's nationalist sentiment had declined by 5 per cent from its 2008 level. This could be owing to a combination of the DPP's moderated political nationalism and the significantly improved cross-Strait relations under the Ma administration's liberal China policy. Second, Figure 5 shows that since 2008, the Ma administration has generally maintained the social welfare improvements instigated by the Chen administration, with an average percentage of the social welfare budget in the total budget during the Ma administration of 2008–2011 being 0.6 per cent higher than that during the Chen administration of 2004–2007. Finally, the Chinese government, in response to worries about further alienating the less privileged groups in Taiwan, has promised to minimize the ECFA's negative impact on themFootnote 28 and Ma's administration has also decided to compensate some of those who could lose out under the agreement.Footnote 29 This might lessen the appeal of the DPP's economic nationalism to the less privileged.
Conclusion and Implications
This article argues that to get a clearer understanding of Taiwan's party politics since 2000, and particularly the DPP's limited resurgence since 2008, we should pay more attention to the links between globalization, social justice issues, and political and economic nationalism in Taiwan. To put it simply, globalization has negatively impacted large groups of less privileged people and widened the income gap in Taiwan, which in turn has made the less privileged more receptive to social justice-oriented economic nationalism. Therefore, a nationalist and centre-left party with a better record for improving social welfare and controlling income inequality, and which promotes a social justice-oriented economic nationalism, may obtain support from the less privileged groups in society. This is the case for the reversal of the DPP's fortunes since it lost power in 2008.
The DPP has learned from its 2008 electoral catastrophe that radicalizing political nationalism brought more problems than it solved for both Taiwan and the DPP. Therefore, at the national level the DPP has moderated its political nationalism and shifted its policy focus to economic nationalism. Political nationalism mobilizes loyalty by appealing to ideological and symbolic factors, such as national identity and ethnic cleavage, and economic nationalism attracts support by promising both to address social justice issues and protect the ordinary people's welfare. Therefore, the DPP's new balance between political and economic nationalism has impacted Taiwan's national politics positively. The significance of highly ideological, emotional and divisive nationalist issues has declined and a variety of social justice issues closely related to ordinary people's livelihoods has become more salient in Taiwan's national politics. At the local level, the DPP has further downplayed political nationalism and decoupled local issues from economic nationalism. This has also led to positive changes as it has allowed for the de-nationalism of local politics, which in turn has made policy debates more concrete and meaningful.
Although the DPP was able to revive its popular support with a better balance of political and economic nationalism, this comeback hit a wall in the 2012 presidential election. The Ma administration did not outperform the Chen administration in many aspects, but it's achievements in creating better cross-Strait relations became its best vote-winning platform. In contrast, the DPP's moderate political nationalism was still not flexible enough to propose a more liberal and pragmatic China policy and thus negatively impacted its popular support in this election.
According to the present study's findings, if the KMT and the mainland Chinese governments wish to win over the less privileged Taiwanese groups, they will have to pacify their nationalist sentiment and provide them with economic benefits. If only one of these concerns is addressed, the remaining other concern may be enough to maintain the less privileged Taiwanese's support for the DPP. In other words, they will need to provide the less privileged with both “romance” and “bread.”Footnote 30 This also generally supports Wang, Chen and Keng's finding that both symbolic and self-interest considerations significantly affect Taiwanese people's policy positions.Footnote 31
The history of Taiwanese politics over the past several decades suggests that it is too early to conclude that a typical two party-dominated system, with the centre-right KMT and the centre-left DPP, has been institutionalized in Taiwan. In response to the DPP campaigning on social justice issues, the KMT has also enhanced its policy efforts to help those losing out under the ECFA. The DPP's increasing emphasis on social justice issues may be primarily for winning elections; nevertheless, since Chen Shui-bian overly played highly ideological, emotional and divisive nationalist issues and consequently exposed the dark side of radical political nationalism to society, it seems impossible for the DPP to rely only on traditional ethnic and identity issues to maintain broad popular support. Social justice-oriented economic nationalism is a new battlefield created by the DPP since 2008 and has helped to restore its popular support. Therefore, it is likely that the DPP will continue with a balanced combination of political and economic nationalism that emphasizes both national security and the ordinary people's welfare in its promotion of Taiwanese nationalism and struggle for local and national power.