Introduction
Myopia is a major eye condition with a high prevalence worldwide, manifesting as an elongated eye axis that causes light to focus in front of the retina, resulting in blurred distance vision. Reference Baird, Saw and Lanca1 Global prevalence of myopia is rising, with projections indicating that by 2050, around 49.8% of the world’s population, or approximately 4.758 billion people, will be affected. Reference Holden, Fricke and Wilson2 Adolescents have a greater risk of myopia than younger children. Reference Wu, Huang, Yu, Fang and Chen3,Reference Rudnicka, Kapetanakis and Wathern4 Myopia, which progresses over time, heightens the risk of ocular complications such as myopic macular degeneration, retinal detachment, cataracts, and open-angle glaucoma. Reference Haarman, Enthoven and Tideman5 As such, the prevalence of myopia in adolescents is now a significant public health issue of global concern.
Myopia develops because of genetic predisposition and environmental influences. Although genetic susceptibility is important, evidence suggests that lifestyle choices, such as prolonged near work and insufficient outdoor activity, are equally critical in driving myopia progression. Reference Cai, Shen, Chen, Zhang and Jin6,Reference Philipp, Vogel and Brandt7 The connection between body metrics and myopia has gained attention in recent research, with some studies indicating that higher body mass index (BMI) may be indicative of a higher risk of myopia. Reference Chen, Sheng, Wang and Liu8 However, BMI does not account for differences in body fat distribution. Reference Woolcott and Bergman9 Our study introduces relative fat mass (RFM), a metric that incorporates waist circumference and height to more accurately assess body fat. As reported, in South Korea, myopia in young adults aged 19–39 has been correlated with higher body fat percentages (BFP), and those with central and general obesity appear to be at an elevated risk of developing myopia. Reference Noh and Jung10 However, the impact of RFM on myopia in adolescents remains unclear and requires additional research.
Utilizing data from the National Health and Nutrition Examination Survey (NHANES), this study examined the link between RFM and myopia in adolescents. The analysis of large-scale population data aimed to uncover metabolic factors that could contribute to myopia, offering insights for its prevention and control.
Methods
Study population
Data were sourced from NHANES (https://www.cdc.gov/nchs/nhanes/index.html), a large-scale survey coordinated by the Centers for Disease Control and Prevention and the National Center for Health Statistics. NHANES employed a stratified, multi-stage sampling scheme to evaluate the health and nutrition of the U.S. population. We focused on adolescents aged 12–19 years (n = 10,731) from the 1999–2008 survey cycles. After excluding cases with incomplete data on myopia status (n = 833), RFM (n = 207), and other relevant covariates (n = 945), a final sample of 8746 adolescents was included in the analysis (Fig. 1).
Flowchart showing the selection of the studied population.

Deriving RFM values
RFM was calculated using height and waist circumference. Given age- and gender-related differences in body composition, fat distribution, and height-to-waist ratios across developmental stages in adolescents, this study adopted age- and gender-specific RFM formulas based on previous adolescent studies to minimize estimation bias that might arise from applying a single adult formula to this population. Reference Gletsu-Miller, Henschel, Tekwe and Thiagarajah11,Reference Woolcott and Bergman12 For adolescents aged 15–19 years, the formula for females was RFM = 76−(20 × [height/waist circumference]) and for males it was RFM = 64−(20 × [height/waist circumference]). For those aged 12–14 years, the formula for females was RFM = 79−(22 × [height/waist circumference]) and for males was RFM = 74−(22 × [height/waist circumference]). These age- and gender-specific formulas have been applied in prior adolescent studies and are considered more appropriate than adult formulas for capturing pubertal differences in body composition; however, they have not been directly validated against gold-standard measures such as DXA in the present sample, and the results should therefore be interpreted with caution.
Myopia screening
NHANES conducted refractive exams on participants aged 12 years and older using the Nidek ARK-760 autorefractor. Each eye was measured three times consecutively, and the median values of spherical power, cylindrical power, and axis were recorded. The spherical equivalent (SE) was calculated as the spherical power plus half of the cylindrical power. Myopia was defined as SE ≤ −1.0 D. Reference Chen, Xu and Lv13 Specifically, myopia was classified as mild (−3.00 D < SE ≤ −1.00 D), moderate (−6.00 D < SE ≤ −3.00 D), or high (SE ≤ −6.00 D). Reference Qiu, Wang, Singh and Lin14 Since cycloplegia was not used in the NHANES refractive measurements, broader criteria (SE ≤ −0.75 D and SE ≤ −0.50 D) were also applied in sensitivity analyses to identify more myopic individuals and validate the robustness of the results.
Covariates
The covariates in this study included age, gender, race, poverty-income ratio (PIR), vitamin A intake, vitamin E intake, total energy intake, physical activity, outdoor activity, and screen usage time. Participants were categorized into low-age (12–14 years) and high-age (15–19 years) groups based on their age. According to the PIR, participants were classified into three groups: low income (≤1.3), middle income (1.3–3.5), and high income (>3.5). Reference Setiono, Guerra, Leung and Leak15 Vitamin A, vitamin E, and total energy intake were assessed via 24-hour dietary recall interviews. Data on physical activity and outdoor activity were collected using the Global Physical Activity Questionnaire. Physical activity (in MET-min/week) was calculated as follows: Frequency of activity per week × Duration per session × MET value of the activity. NHANES provides recommended MET values for each type of physical activity. According to the World Health Organization, adolescents are recommended to engage in more than 60 minutes of moderate-to-vigorous physical activity per day (equivalent to 240 MET-min/day), Reference Chaput, Willumsen and Bull16 which translates to 1680 MET-min per week. Activities were recorded as either outdoor or non-outdoor (including indoor activities and sedentary behavior). Outdoor activities included aerobic exercise, baseball, basketball, dance, cycling, and similar pursuits. Screen usage time was defined as the time spent watching television or using a computer. Screen usage time exceeding 2 hours per day was classified as excessive screen use. Reference Jain, Shrivastava, Mathur, Pathak and Pathak17
Statistical analysis
Statistical analyses were performed using R (v4.4.2). Baseline data were organized with the gtsummary package, grouped by whether participants had myopia. The weights used in this study were the MEC weights (WTMEC2YR/5). Categorical variables were reported as weighted counts and proportions, and continuous variables were expressed as weighted means ± standard deviations. Weighted logistic regression models were constructed with the survey package to assess the relationship between RFM and myopia. Model I was adjusted for basic demographics (age, gender, and race). In Model II, PIR, vitamin A intake, vitamin E intake, energy intake, sufficient physical activity, outdoor activity, and screen usage time were further adjusted. In the fully adjusted model, restricted cubic spline (RCS) analysis (rms package) was used to examine the nonlinear relationship between RFM and adolescent myopia, with three knots at the 10th, 50th, and 90th percentiles of RFM, to balance flexibility and reproducibility. Stratified multivariate logistic regression was conducted for subgroup analysis, with stratification factors including age group, gender, race, and PIR. Interaction analyses were performed, and multiple testing correction was applied using the Benjamini–Hochberg method. Finally, sensitivity analyses were carried out using two alternative diagnostic criteria for myopia (SE ≤ −0.75 D and SE ≤ −0.50 D) in the fully adjusted weighted logistic regression model. This study described the distribution of myopia severity (mild, moderate, high). Given the limited sample size, particularly for high myopia, these results are presented as descriptive and exploratory information and are not the main basis for inference. To compare the strength of association between RFM and BMI as obesity indicators, both metrics were standardized, and ORs with 95% CIs per 1-SD increase were calculated in the fully adjusted model. A two-sided P < 0.05 was considered statistically significant.
Results
Baseline characteristics
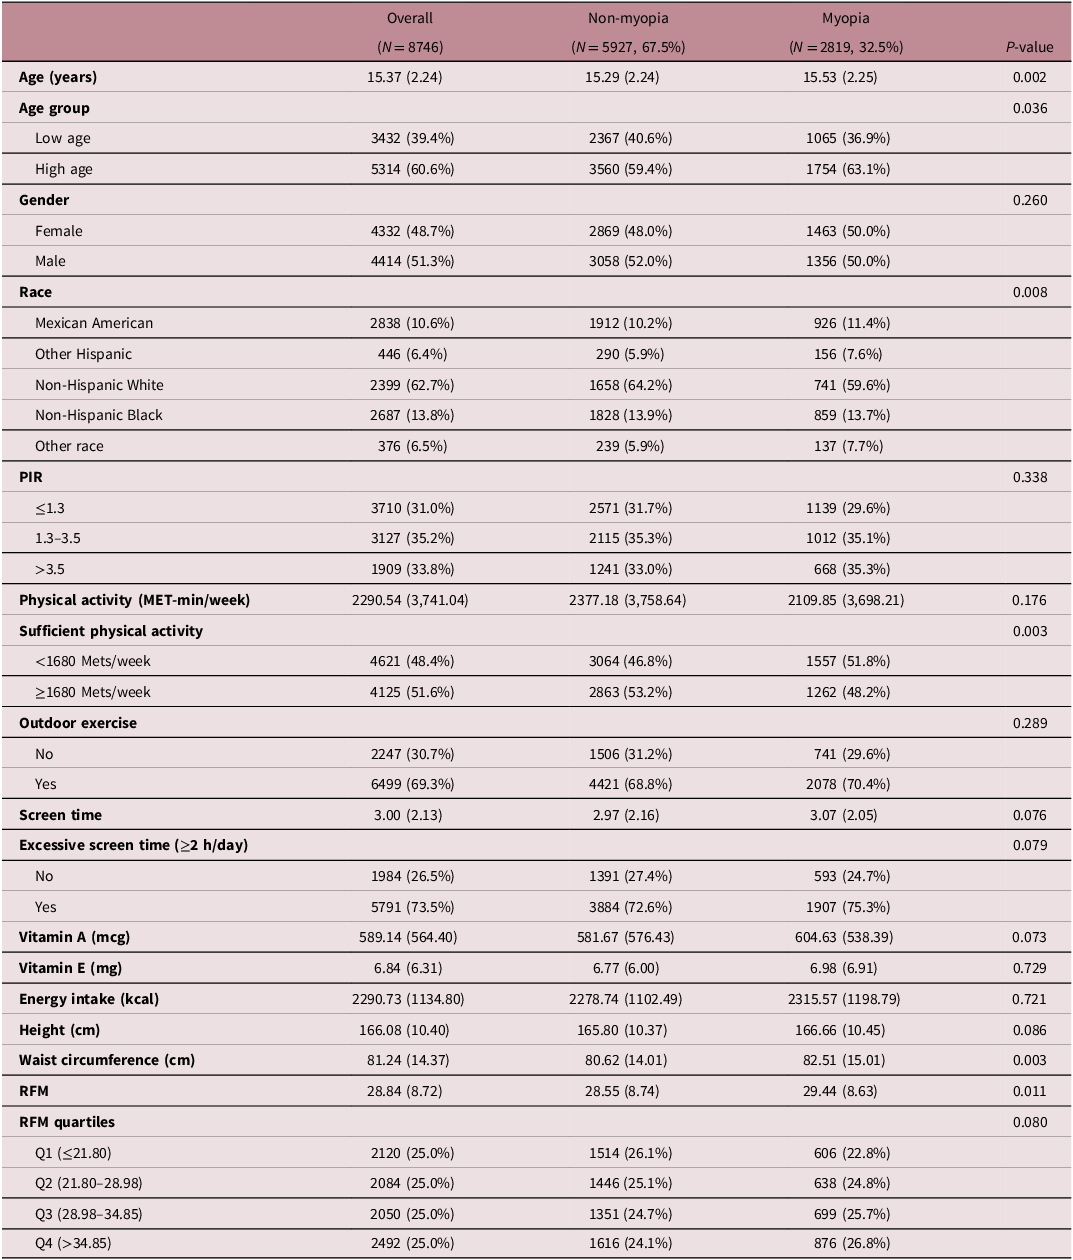
Table 1 summarizes baseline characteristics of 8746 participants, including 2819 myopic individuals (1805 with mild myopia, 807 with moderate myopia, and 207 with high myopia), with an average age of 15.37 ± 2.24 years and a myopia prevalence of 32.5%. Participants were grouped based on the presence or absence of myopia. The results showed that, compared to non-myopic adolescents, those with myopia tended to be older (proportion in the high-age group: 63.1% vs. 59.4%, P = 0.036), were more likely to lack sufficient physical activity (51.8% vs. 46.8%, P = 0.003), and had larger waist circumference (82.51 vs. 80.62, P = 0.003) and higher RFM values (29.44 vs. 28.55, P = 0.011). Additionally, although the between-group difference in total continuous physical activity (MET-min/week) was not statistically significant, the proportion of sufficient physical activity (based on the recommended threshold) differed significantly.
Characteristics of NHANES participants between 1999–2008

Table 1. Long description
A table comparing characteristics of participants with and without myopia. The table has 18 rows and 7 columns. Column headers are Overall, Non-myopia, Myopia, and P-value. Row labels include Age (years), Age group, Gender, Race, PIR, Physical activity (MET-min/week), Sufficient physical activity, Outdoor exercise, Screen time, Excessive screen time (≥2 h/day), Vitamin A (mcg), Vitamin E (mg), Energy intake (kcal), Height (cm), Waist circumference (cm), RFM, and RFM quartiles. Each row contains values for Overall, Non-myopia, Myopia, and P-value. Notable trends include differences in age group, sufficient physical activity, waist circumference, and RFM values between participants with and without myopia.
Continuous variables were presented as mean (SD), and categorical variables were expressed as N (%). Mean (SD) and percentage (%) are weighted.
Association of RFM with adolescent myopia
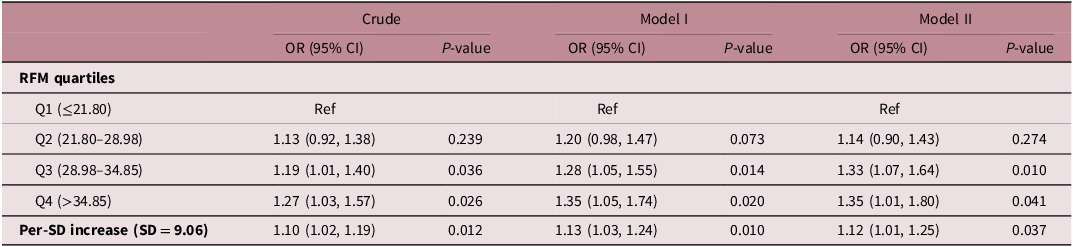
A weighted logistic regression model was employed to investigate the association between RFM and adolescent myopia (SE ≤ −1.0 D). The results demonstrated a positive correlation between RFM and adolescent myopia across all three models. In the fully adjusted model, each one-standard-deviation (9.06) increase in RFM was associated with a 12% higher odds of myopia (OR = 1.12, 95% CI: 1.01–1.25, P = 0.037). Compared to the lowest quartile group, the third and highest quartile groups showed a significantly increased odds of myopia by 33% (OR = 1.33, 95% CI: 1.07–1.64, P = 0.010) and 35% (OR = 1.35, 95% CI: 1.01–1.80, P = 0.041), respectively (Table 2).
The odds ratios between RFM and myopia in adolescents, NHANES 1999–2008

Table 2. Long description
A table showing the odds ratios between RFM and myopia in adolescents, NHANES 1999-2008. The table has 5 rows and 7 columns. The columns are labeled as Crude, Model I, and Model II, each with OR (95% CI), P-value, and RFM quartiles as row labels. Row 1: Q1 (≤21.80), Ref, Ref, Ref. Row 2: Q2 (21.80-28.98), OR 1.13 (0.92, 1.38), P-value 0.239, OR 1.20 (0.98, 1.47), P-value 0.073, OR 1.14 (0.90, 1.43), P-value 0.274. Row 3: Q3 (28.98-34.85), OR 1.19 (1.01, 1.40), P-value 0.036, OR 1.28 (1.05, 1.55), P-value 0.014, OR 1.33 (1.07, 1.64), P-value 0.010. Row 4: Q4 (>34.85), OR 1.27 (1.03, 1.57), P-value 0.026, OR 1.35 (1.05, 1.74), P-value 0.020, OR 1.35 (1.01, 1.80), P-value 0.041. Row 5: Per-SD increase (SD = 9.06), OR 1.10 (1.02, 1.19), P-value 0.012, OR 1.13 (1.03, 1.24), P-value 0.010, OR 1.12 (1.01, 1.25), P-value 0.037.
No covariates were adjusted in Crude model. Model I was adjusted for age, gender, race. Model II was adjusted for age, gender, race, PIR, vitamin A, vitamin E, energy intake, sufficient physical activity, outdoor exercise, screen usage time.
Subsequently, an RCS model was used to further explore the nonlinear relationship between RFM and adolescent myopia. As RFM increased, the odds of myopia showed a significant upward trend (P for overall association = 0.004), but no significant nonlinear relationship was observed (P for nonlinearity = 0.406) (Fig. 2).
Analysis of the nonlinear relationship between RFM and adolescent myopia using the restricted cubic spline model. The model was adjusted for age, gender, race, PIR, vitamin A, vitamin E, energy intake, sufficient physical activity, outdoor exercise, screen usage time. The OR is represented by the green line, and shaped part represents the 95% CI.

Subgroup analysis
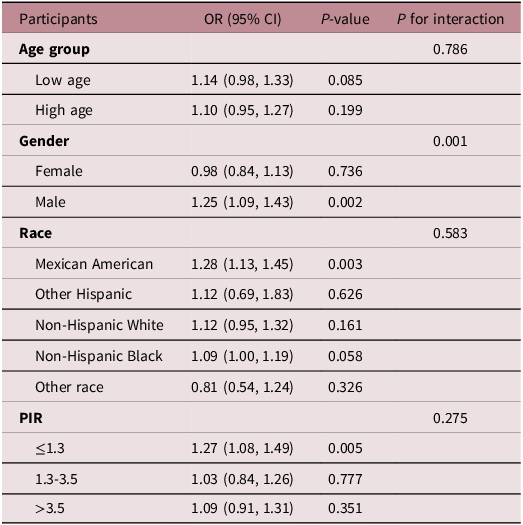
Table 3 shows the relationship between RFM and the odds of myopia across different subgroups. After adjusting for all confounding factors, the results showed that RFM was significantly positively associated with the odds of myopia in males (OR = 1.25, 95% CI: 1.09–1.43, P = 0.002), Mexican Americans (OR = 1.28, 95% CI: 1.13–1.45, P = 0.003), and low-income populations (OR = 1.27, 95% CI: 1.08–1.49, P = 0.005). Furthermore, interaction analysis indicated that gender had a significant interactive effect on the association between RFM and the odds of myopia (P for interaction = 0.001).
Subgroup analysis for the association between RFM and myopia in adolescents, NHANES 1999–2008

Table 3. Long description
A table with five columns and eleven rows, including a header row. The columns are labeled Participants, OR (95% CI), P-value, and P for interaction. The table presents data on the relationship between RFM and the odds of myopia across different subgroups, including age group, gender, race, and PIR. Each row provides specific odds ratios (OR), 95% confidence intervals (CI), P-values, and P for interaction values for each subgroup. Notable findings include significant associations in males, Mexican Americans, and low-income populations, with P-values of 0.002, 0.003, and 0.005 respectively. The P for interaction value for gender is 0.001, indicating a significant interactive effect.
The model was adjusted for age, gender, race, PIR, vitamin A, vitamin E, energy intake, sufficient physical activity, outdoor exercise, screen usage time.
Sensitivity analysis
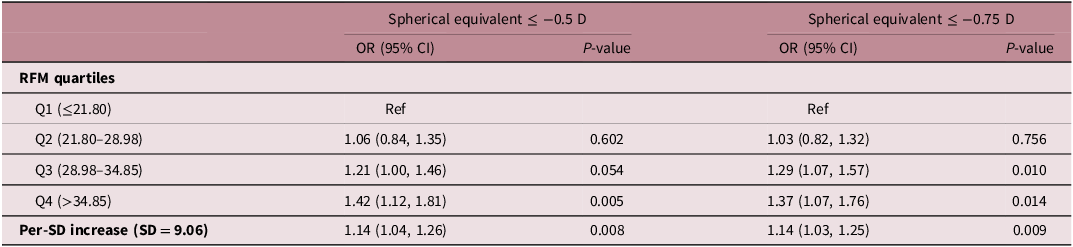
We conducted sensitivity analyses using myopia diagnostic criteria of SE ≤ −0.50 D and SE ≤ −0.75 D. After adjusting for all confounding factors, when SE ≤ −0.50 D was used as the diagnostic criterion, the highest quartile of RFM was associated with a 42% higher odds of myopia compared to the lowest quartile (OR = 1.42, 95% CI: 1.12–1.81, P = 0.005). When SE ≤ −0.75 D was used as the diagnostic criterion, the third and highest quartiles showed 1.29-fold (95% CI: 1.07–1.57, P = 0.010) and 1.37-fold (95% CI: 1.07–1.76, P = 0.014) higher odds of myopia, respectively, compared to the lowest quartile (Table 4). Each one-standard-deviation (9.06) increase in RFM was consistently associated with significantly elevated odds of myopia under both diagnostic criteria. These results demonstrate that the main findings of this study are robust.
Odds ratios for the association between RFM and myopia using different definitions of spherical equivalent in adolescents, NHANES 1999–2008

Table 4. Long description
A table with four rows and five columns. The columns are labeled RFM quartiles, OR (95% CI) for Spherical equivalent <= -0.5 D, P-value for Spherical equivalent <= -0.5 D, OR (95% CI) for Spherical equivalent <= -0.75 D, and P-value for Spherical equivalent <= -0.75 D. The row labels are Q1 (<=21.80), Q2 (21.80-28.98), Q3 (28.98-34.85), Q4 (>34.85), and Per-SD increase (SD = 9.06). The values in the table are as follows: Row 1: Ref, Ref; Row 2: 1.06 (0.84, 1.35), 0.602, 1.03 (0.82, 1.32), 0.756; Row 3: 1.21 (1.00, 1.46), 0.054, 1.29 (1.07, 1.57), 0.010; Row 4: 1.42 (1.12, 1.81), 0.005, 1.37 (1.07, 1.76), 0.014; Row 5: 1.14 (1.04, 1.26), 0.008, 1.14 (1.03, 1.25), 0.009.
The model was adjusted for age, gender, race, PIR, vitamin A, vitamin E, energy intake, sufficient physical activity, outdoor exercise, screen usage time.
Comparison between RFM and BMI
To compare the strength of association between RFM and BMI as obesity indicators, both metrics were standardized per 1-SD increase. In the fully adjusted model, both RFM and BMI were associated with higher odds of myopia in adolescents. The effect estimate for RFM was slightly higher than that for BMI (RFM: OR = 1.15, 95% CI: 1.04–1.26; BMI: OR = 1.13, 95% CI: 1.05–1.21) (Table S1). These findings support the use of RFM as an adiposity-related indicator in this study. However, given the close effect estimates and overlapping confidence intervals, the incremental advantage of RFM over BMI should be interpreted with caution.
Discussion
Using nationally representative data, this study revealed a significant positive association between RFM and adolescent myopia, with a stronger association observed in males. Sensitivity analyses using a broader myopia definition confirmed the robustness of our findings. In the comparative analysis, both RFM and BMI were positively associated with the odds of myopia, with RFM showing a slightly higher effect estimate, suggesting that RFM – which incorporates both height and waist circumference – may provide complementary information for assessing obesity-related myopia risk in adolescents. However, given the close effect estimates, the incremental predictive value of RFM over BMI requires further validation in longitudinal studies and external populations.
Recent research has begun to unravel the relationship between obesity and myopia. Data from Korean NHANES allowed the following researchers to conclude that obese children and adolescents are 3.77 times more likely to develop high myopia compared to normal-weight peers. Reference Lee, Lee, Lee and Kim18 This trend was also observed in a study from Ireland, which surveyed children from 37 schools and showed considerably higher myopia prevalence among overweight and obese children compared to those who were within a healthy weight range. Reference Harrington, Stack and O’Dwyer19 Another study highlighted that individuals with myopia generally have higher BFP, BMI, and waist circumference compared to those with unimpaired vision. Reference Noh and Jung10 In a cross-sectional study conducted in China with 35,108 children and adolescents aged 6–17, researchers observed that overweight and obese girls, compared to those with normal weight-for-age, had a 33% and 22% higher odds of myopia in the 6–8 and 9–11 age groups, respectively. Reference Yin, Gan and Xu20 The study also showed that higher BFP and BMI were closely linked to myopia. Reference Yin, Gan and Xu20 In agreement with earlier studies, our research indicates that RFM, which measures obesity and body fat content, is positively correlated with the odds of myopia in adolescents. Yet, there are studies that have found otherwise. According to a Mendelian randomization study, higher BMI and fat mass, as determined by genetic factors, are associated with a lower odds of myopia; in other words, higher levels of BMI and fat mass may act as protective factors against myopia. Reference Lu, Zhang and Ma21 Intriguingly, educational attainment has been identified as a potential mediator in this relationship. Reference Lu, Zhang and Ma21 A nationwide study of 1.3 million adolescents demonstrated a J-shaped association between BMI and myopia, indicating that low and high BMI values are connected to an increased likelihood of myopia. Reference Peled, Nitzan and Megreli22 Unlike the BMI studies mentioned above, our RSC analysis did not reveal a significant nonlinear relationship between RFM and the odds of myopia. A possible explanation is that BMI is influenced by both fat mass and lean mass, making it less reflective of fat distribution, whereas RFM, calculated from waist circumference and height, more directly reflects central fat accumulation, Reference Kunutsor, Jae, Dey and Laukkanen23,Reference Suthahar, Bergman and de Boer24 thus showing a more linear increasing trend in the odds of myopia in our study population. Additionally, differences in age, racial composition, myopia definition, adjustment for lifestyle factors, and study design across studies may also contribute to the inconsistent dose-response patterns.
The precise mechanisms through which elevated RFM increases the odds of myopia in adolescents remain unclear but may involve chronic inflammation and insulin resistance. Obesity-induced adipose tissue dysfunction leads to the excessive release of free fatty acids, reactive oxygen species, and pro-inflammatory cytokines, resulting in lipid deposition in non-adipose organs and organelle dysfunction, thereby exacerbating systemic inflammation. Reference Ahmed, Sultana and Greene25 Patients with inflammatory diseases have a higher incidence of myopia compared to those without, and inflammatory markers such as interleukin-6 (IL-6), tumor necrosis factor-α (TNF-α), and transforming growth factor-β (TGF-β) are significantly elevated in the sclera of experimental myopia models. Notably, treatment with the immunosuppressant cyclosporine A has been shown to alleviate myopia progression. Reference Lin, Wei and Chang26 Proteomic analyses further support the activation of inflammation-related signaling pathways, such as the S100 family, which are closely associated with myopia development. Reference Jiang, Koh and Seah27 Additionally, chronic low-grade inflammation disrupts insulin signaling, leading to glucose dysregulation and insulin resistance. Reference Kojta, Chacinska and Blachnio-Zabielska28 Mendelian randomization evidence indicates a significant causal relationship between elevated glycated hemoglobin levels and an increased risk of myopia. Reference Li, Zhu and Shao29 Compensatory hyperinsulinemia due to insulin resistance may reduce plasma IGFBP-3 levels and impair retinoic acid receptor signaling, promoting scleral growth and axial elongation, ultimately contributing to myopia development. Reference Cordain, Eaton, Brand Miller, Lindeberg and Jensen30–Reference Kusakari, Sato and Tokoro32
Subgroup analysis revealed that sex was the only variable showing an interaction with the association between RFM and adolescent myopia. A significant positive association was observed in males, but not in females. This sex difference may be attributable to distinct fat distribution patterns between sexes. Reference Loomba-Albrecht and Styne33 Males tend to accumulate abdominal fat with higher visceral adiposity, whereas females are more likely to store fat in the gluteal and femoral regions. Reference Tchernof, Brochu and Maltais-Payette34,Reference Palmer and Clegg35 Consequently, males are more prone to metabolic disturbances such as insulin resistance, which may exacerbate myopia risk. Reference Nedungadi and Clegg36 Additionally, the positive association between RFM and myopia reached statistical significance among Mexican American and low-income populations. Of note, the interaction tests for race and PIR were not statistically significant; therefore, these subgroup findings should be interpreted as exploratory rather than as definitive evidence of racial or socioeconomic disparities. The significant association in Mexican Americans may be explained by a combination of genetic background, dietary patterns, obesity phenotypes, outdoor activity, and screen exposure. Reference Díaz, Lazarus and Fuentes-López37,Reference Aleman, Almandoz, Frias and Galindo38 The significant association in the low-income population may reflect socioeconomic factors such as access to healthy food, eye health services, educational resources, neighborhood environment, and extracurricular activity opportunities. Reference Rock, Thomson and Gansler39–Reference Rosenfeld, Grega and Karlsen41 These interpretations warrant further validation through targeted external studies.
This study has important public health implications. Adolescents may reduce the odds of myopia by adopting healthy lifestyles and dietary habits to lower RFM, including reducing high-fat food intake, appropriately supplementing prebiotics to modulate gut microbiota, and engaging in moderate-to-vigorous physical training. Reference Hall, Bemis and Brychta42–Reference Wewege, van den Berg, Ward and Keech44 Based on the subgroup results, future myopia prevention and weight management strategies could particularly target male and low-income adolescents, integrating affordable outdoor activity opportunities, nutritional improvement, regular physical activity, and eye health screening into conventional myopia prevention programs to enhance intervention accessibility and practicality. 45
Nevertheless, this study has several limitations. First, due to the cross-sectional design of the NHANES data, causality between RFM and myopia cannot be established. Second, this study used NHANES data from 1999 to 2008, which are now dated; screen use patterns, near-work behaviors, and outdoor activity habits among adolescents may have changed substantially since then, warranting caution when extrapolating the findings to contemporary adolescent populations. Third, refractive assessments were performed without cycloplegia, which may compromise measurement accuracy, particularly in individuals with mild myopia. Fourth, although the distribution of mild, moderate, and high myopia was descriptively reported, the limited sample size – especially for high myopia – may lead to unstable regression estimates; therefore, no strong conclusions were drawn regarding myopia severity. Fifth, vitamin A, vitamin E, and energy intake were derived from 24-hour dietary recalls, which are subject to recall bias and intraday intake variability. Serum nutrient levels were not included, so long-term nutritional status cannot be fully reflected. Sixth, despite adjustment for multiple confounders, key genetic information such as parental myopia history was unavailable in NHANES, and residual confounding may still affect the estimated association between RFM and myopia. Finally, although chronic inflammation and insulin resistance were proposed as potential mechanisms in the discussion, no biomarker verification was performed using C-reactive protein, fasting glucose, or insulin. Considering the availability of these biomarkers, the fasting subsample design, and the potential reduction in sample size after including them, future studies using datasets with complete biomarker information and appropriate weighting designs are needed to further validate these mechanisms.
Conclusion
Increased RFM was significantly associated with higher odds of myopia in adolescents, with a stronger association observed in males. These findings suggest that body fat control and RFM reduction may represent a promising direction for comprehensive myopia prevention in youth. For male and low-income adolescents, weight management, healthy diet, regular moderate-to-vigorous physical activity, and accessible eye health services could be integrated into conventional myopia prevention strategies. However, given the cross-sectional design of this study, the value of these interventions requires further validation through longitudinal and interventional studies.
Supplementary material
The supplementary material for this article can be found at https://doi.org/10.1017/S204017442610066X.
Data availability statement
The data supporting the current study are available from the corresponding author on reasonable request.
Acknowledgments
Not applicable.
Author contribution
Yan He contributed to data analysis, drafting and revising the article, gave the final approval of the version to be published, and agreed to be accountable for all aspects of the work.
Funding statement
Not applicable.
Competing interests
Not applicable.
Ethical standard
Ethical approval and consent were not required as this study was based on publicly available data.
Consent for publication
Not applicable.