What is the impact of transport infrastructure access on economic development? Following Fogel’s (Reference Fogel1964) seminal work on the impact of the United States’ rail infrastructure investment on various economic measures, there has been a resurgence of interest in empirical investigations into the impact of transport infrastructure on economic development using historical data. Basic transport network expansion, such as railways, roads, and canals, is seen as a means to increase market access, reduce transaction costs, and provide more incentives for productivity improvements and market-oriented economic activities. In previous research, transport network expansion is found to be significantly linked to historical improvements in agricultural activities (Atack and Margo Reference Atack and Margo2011; Donaldson Reference Donaldson2018; Donaldson and Hornbeck Reference Donaldson and Hornbeck2016), market integration (Reference Brunt and CannonBrunt and Cannon 2014; Jacks Reference Jacks2005), economic specialization (Niemi Reference Niemi1970), industrial development and productivity (Bogart and Chaudhary Reference Bogart and Chaudhary2013; Tang Reference Tang2014), urbanization (Rae Reference Rae1944; Berger and Enflo Reference Berger and Enflo2017), changes in trade patterns (Fletcher Reference Fletcher1958), income levels (Banerjee, Duflo, and Qian 2020), and even detriments to health (Zimran Reference Zimran2020). Although previous studies shed light on the aggregate spillover effects of transport network development within an agent’s locality, there is little discussion to what extent the aggregate effect is driven by those agents located directly adjacent to transport infrastructure.
This article takes the research question to a more micro level using a unique dataset constructed from Bangkok household-level orchard land deeds/tax records from the 1880s. Not only does the rare dataset provide an approximation of labor productivity, it also provides detailed property characteristics allowing us to determine whether households had access to transport networks. This enables us to empirically test the impact of being located directly adjacent to a transport network on agricultural productivity. In particular, we assess the impact of access to Bangkok’s canal network in the nineteenth century on households’ production decisions for domestically consumed orchard cash crops, reflected in orchard labor productivity.
Throughout the nineteenth century, canals provided the primary means of transport both within Bangkok and between the city and outlying regions, earning the city its nickname, “Venice of the East.” As British diplomat Bowring (Reference Bowring2013, p. 402) noted during his stay in Bangkok in 1855, “[t]he highways of Bangkok are not streets or roads, but the river and the canals. Boats are the universal means of conveyance and communication.” Large infrastructure projects throughout the nineteenth century greatly expanded the canal system primarily to facilitate defense, transporting rice and sugar for international trade, and the flooding of rice paddy fields. Since these canals were exploited as general transport canals by the public, it is possible that they also afforded households engaged in orchard cash crop agriculture greater access to transport. Such a hypothesis is illustrated and confirmed by our estimation of travel cost savings from a historical account. Access to transport canals, as a result, could have further contributed to the development of domestic market activities by giving more incentives to orchardists to be more productive. Indeed, our analysis suggests households with access to a transport canal had 10.7 percent higher labor productivity compared to households without any transport canal access. We also find evidence for productivity gains associated with access to irrigation canals, but, unlike transport canals, these gains can be attributed to water input provision and management rather than transport access.
In an attempt to provide a consistent causal estimate of the impact of access to transport canals on improved labor productivity, we recognize that there are two potential sources of endogeneity. It can be ascertained from the background literature that canals in nineteenth-century Bangkok were built for purposes exogenous to orchard cultivation and hence the setup is safe from reverse causation. Nevertheless, there is still a concern that orchardists might sort onto plots adjacent to canals in a systematic way in relation to their productivity. Even though our article does not directly correct for this potential selection bias, in the robustness check we employ a method developed in Oster (Reference Oster2014, 2019) to estimate the size and the direction of the potential selection on the unobservables in relation to the observables, such that the baseline estimated impact of canal access on labor productivity would be driven to zero. We then evaluate whether such unobservable selection is empirically possible.
The robustness check shows that for unobservable selection to be significant enough to fully remove the effect of access to canals on labor productivity, positive sorting—in other words, more productive orchardists sorting onto plots by canals—has to be evident. However, results of further empirical evaluation based on the assumption that sorting was possible in less populated areas are not consistent with positive sorting. We can, thus, conclude with a certain level of confidence in our baseline result that having access to canal networks significantly and causally led to an improvement in labor productivity of 10.7 percent. In addition, potential increases in cash crop revenues stemming from gaining direct access to new canals translate into non-negligible household welfare gains.
The findings can also shed light on the broader debate of whether economic growth in developing countries is impeded by inadequate investment in basic infrastructure. Specific to the Thai context, Feeny (Reference Feeny1979) argues that the Thai government’s failure to provide sufficient water supply and drainage through a more extensive irrigation system in the early twentieth century resulted in a decline in rice yields despite high demand for rice from international trade. While economic expansion on the extensive margin—the increasing use of land and labor—can provide one explanation for the decline in rice yields in Thailand (Huff and Angeles Reference Huff and Angeles2011), the existing debate ignores the role of other forms of large-scale public investment that could have had unintended consequences on agricultural productivity in historical Thailand. Our results show that public investment in canals, which were, in fact, not intended for orchard agriculture development, improved market access and irrigation provision, resulting in labor productivity improvements, and better livelihoods for a significant number of households in nineteenth-century Bangkok.
The rest of the article is organized as follows. The next section covers the historical background of (1) the development of Bangkok’s canal network and how it can be taken as exogenous to orchard agricultural production, (2) how orchardists made use of transport canals, and (3) transport cost savings generated by canal access. The following sections explain the data and variables used for the empirical analysis, the empirical strategy, and the results. We then present a robustness check that considers unobservable selection and evaluates its possible impact on our estimated coefficient of interest. The final sections present welfare implications for households that gained access to canal infrastructure and conclusions.
HISTORICAL BACKGROUND
Development of Bangkok’s Canal Network
Canals are one of the oldest forms of transport routes. Notable countries that experienced the “Canal Era” range from China with its Grand Canal, Great Britain during the Industrial Revolution, to France and the United States in the early nineteenth century (Geiger Reference Geiger1984). Likewise, waterways—both natural and manmade—have long been the primary means of transport in central Siam. Many canals in the vicinity of Bangkok predate the removal of the capital from Ayutthaya in 1767. After the establishment of Bangkok as the capital in 1782, the development of Bangkok’s canal network accelerated, especially during the reigns of King Rama III (1824–1851), King Rama IV (1851–1868), and King Rama V (1868–1910). It is well documented that canals in Bangkok were built to serve various purposes, all of which could be identified as unrelated or exogenous to production decisions of individual orchard landholders living within the city. The purposes for building manmade canals can be grouped into four main categories: moats for defensive purposes; regional transport routes and travel time reduction; shipping routes for specific internationally traded goods (e.g., rice and sugar); and enlarging arable frontier land for rice farming.
The government constructed a series of manmade canals around Bangkok as a defensive strategy against foreign threats during the Thonburi and the early Rattanakosin Kingdoms.Footnote 1 The city moats were seen as necessary until the early period of King Rama III’s reign since Siam engaged in frequent warfare with the neighboring Konbaung (Burmese) and Vietnamese Kingdoms. Owing to the fall of these neighboring kingdoms to British and French colonization in the region, building city moats was no longer necessary. The last canal built explicitly for defensive purposes was Padung Krung Kasem Canal built in 1854 during the reign of King Rama IV.
Similar to canals in Britain that were built for the purposes of transporting certain goods such as coal and manufacturing products (Reference Brunt and CannonBrunt and Cannon 2014), many canals in central Siam were built specifically to transport goods and to reduce travel time for people. These canals, for instance, include Bang Khun Thian (1831), Phra Khanong (1840), Hualampong (1857), and Thanon Trong (1857). The Thanon Trong canal in Bang Rak sub-district, in particular, was demanded by the Western expatriate community to reduce the expatriates’ travel time into the inner city (Bunnag, Nopkhun, and Thadaniti 1982).
Manmade canals were also built to serve as shipping routes for specific internationally traded goods after the signing of the Burney and Bowring international trade treaties in 1826 and 1855, respectively. For example, Phra Phasi Sombat, a prominent sugar mill owner, requested to build the Phasi Charoen Canal (1872) out of future canal fare revenue to connect the Ta Chin and Chao Phraya Rivers for the specific purpose of transporting sugar and sugarcane (Bunnag, Nopkhun, and Thadaniti 1982). Branches of smaller canals, such as Bang Wa, Bang Ranae, and Bang Ranae Noi, were also built as part of the extended canal system from the main Phasi Charoen Canal. Maha Sawat (1860) and Damnoen Saduak (1868) canals were built to link Bangkok to Nakhon Chai Si and to Ratchaburi, respectively, to transport sugar and sugarcane, which were Siam’s primary export goods before the Philippines captured the international market for sugarcane towards the end of the nineteenth century.Footnote 2
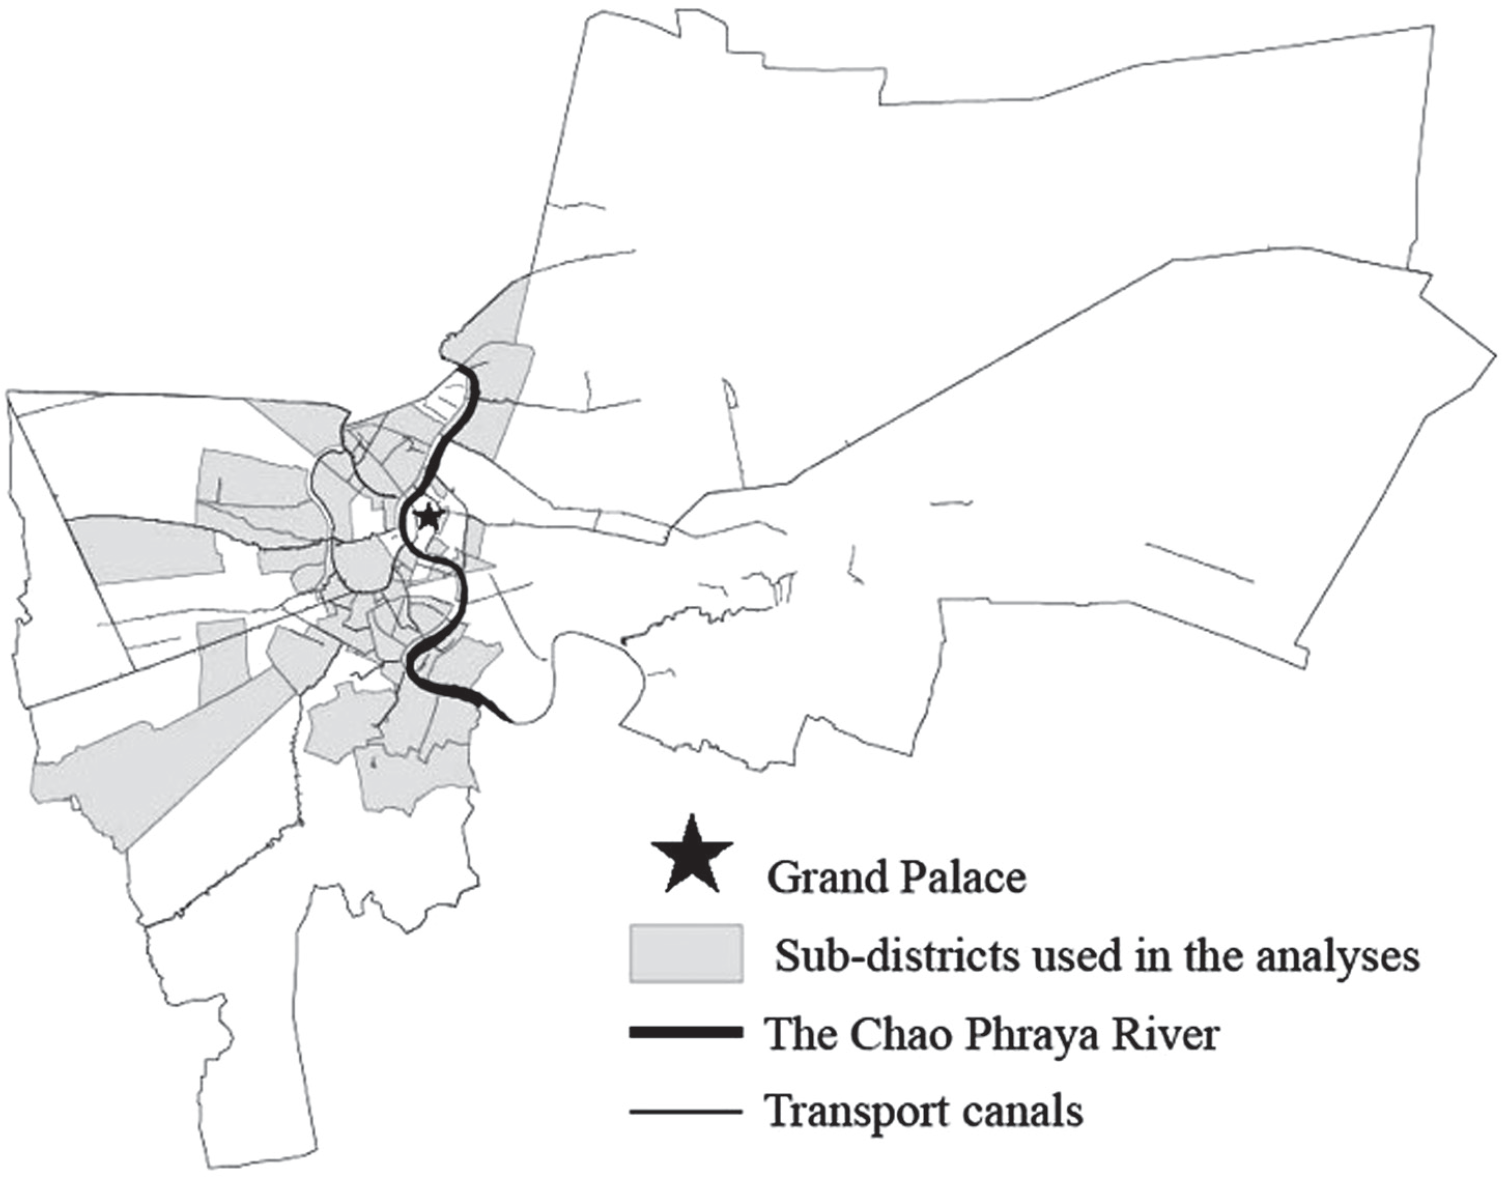
Lastly, new canals were dug to open frontier land for rice farming. The 1855 Bowring Treaty between Siam and Britain and similar subsequent treaties signed between Siam and other countries effectively opened Siam to international trade. Siam experienced unprecedented growth in rice exports in the decades following the conclusion of the Bowring Treaty. Rice exports grew from 1,830,000 to 2,580,000 piculs, and the value of rice exports increased from 3,510,000 to 6,520,000 baht between 1867 and 1870 (Bunnag, Nopkhun, and Thadaniti 1982).Footnote 3 To support the growing market, King Rama V ordered more canals to be dug in order to increase the amount of arable land for rice farming around Bangkok and the Chao Phraya River Delta. In other words, the canals were built for the purpose of flooding paddy fields (i.e., inundation or flooding canals) for rice cultivation. Examples of new canals of this type include Prem Prachakon (1870), which opened up old jungle area north of the city, and Taweewattana (1878) together with its branches, Bang Weak and Bang Phrom, which increased the frontier land on the western side of Thonburi. Figure 1 illustrates the extent of the canal network in Bangkok in the areas analyzed in this article.Footnote 4
BANGKOK SAMPLE COVERAGE AND CANAL NETWORK
Notes: The 57 historical sub-districts used in the empirical analysis are matched with 42 current sub-districts. Although the current sub-districts tend to cover an area larger than the historical ones, substantive historical sources, including historical maps, are used to ensure the validity of the mapping.
Source: Authors' compilation based on the Department of Lands Museum land deed collection.

Canals and Orchards
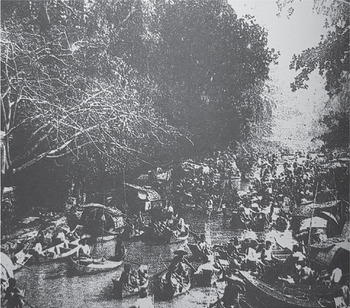
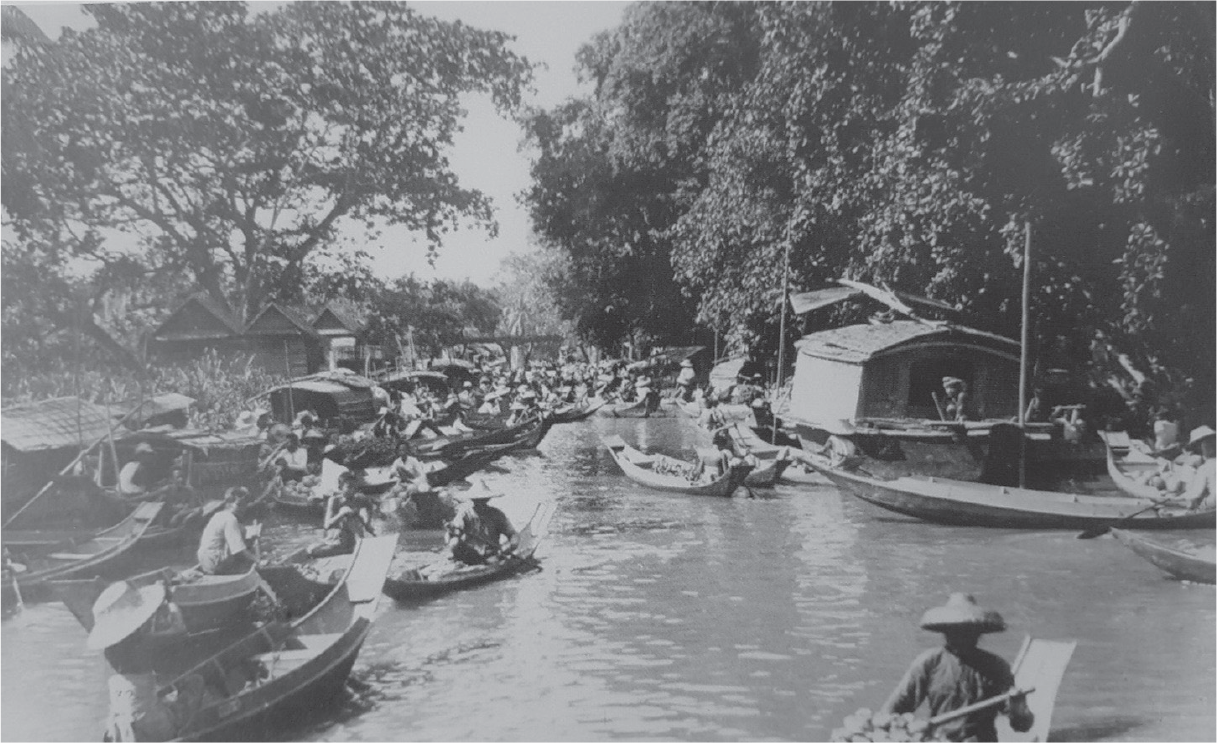
Although it appears from the historical background that the canal network was built for purposes exogenous to orchard cultivation, it is well documented that orchardists have exploited the network to transport their products to market even up to the mid-twentieth century. Most orchard cultivators marketed their production themselves by using their boats to transport the fruits along the canals to either the floating markets around their neighborhood or markets in urban areas (Bunnag, Nopkhun, and Thadaniti 1982, pp. 48–50). At the floating markets, fruits were purchased by both customers and retailers who then sold the products in more central urban markets. For instance, a memoir by Chullasapya recounted his childhood in his mother’s durian orchard along Bang Khunnon canal on the west side of Bangkok (Chullasapya Reference Chullasapya2011). Although it was in the 1910s, his experience epitomizes the nineteenth-century lives of orchardists living along the canals. During the weekends, the author rode a boat to the floating market with his mother to sell durians from their orchard. They travelled from their orchard on Bang Khunnon canal to the Bang Bamru floating market located at the junction where the Bangkok Noi canal meets the Bang Bamru canal, approximately 700 meters from their orchard. At the Bang Bamru floating market there were a number of boats selling durians and other fruits by the orchardists themselves. Retailers from the Bang Lampu and Ta Tian markets located near the Grand Palace on the east side of the River—an area with few orchards—would hire boats to buy durians from them at the floating market. The Bang Bamru floating market was the largest floating fruit market in Bangkok and operated every morning. Figures 2a and 2b show the atmosphere of historical floating markets around the Bangkok Noi and Mahanak canals.
A FLOATING MARKET ON BANGKOK NOI CANAL IN THE EARLY TWENTIETH CENTURY
Sources: Chullasapya (2011). Reprinted with permission by Muang Boran Journal.

A FLOATING MARKET AT THE JUNCTION OF MAHANAK CANAL DURING THE REIGN OF KING RAMA V
Source: National Archives of Thailand (2017).

Alternatively, in areas without bustling floating markets, orchard cultivators might choose to bring their produce over a longer distance along the canals to more urban land-based markets to sell their products directly to both customers and retailers. For example, orchardists around Wat Champa in the Bang Ramat area, which is also located on the west side of the river but much further inland than Bang Bamru, transported their goods either by foot or by boat to the neighborhood pier before taking them together by boat to Sala Namron Market by the Chao Phraya River (approximately seven kilometers by canal), Wat Mahathat Market on the east side of the Chao Phraya River (roughly eight kilometers by canal and river), and Pak Klong Talat Market—one of the largest fruit markets on the east side of the river (about 10.4 kilometers away by boat) (Wangchan Reference Wangchan2011). It was rare for the canals to be used by wholesalers to gain access to orchards compared to orchardists using the canals themselves to gain access to markets.Footnote 5
Canals and Transport Cost Savings: A Historical Estimation
The historical records noted previously give contextual information on how the orchardists used the canals and suggests the benefits of being situated on canal routes. In particular, such benefits could be formalized as transport cost savings. In the following, we attempt to approximate transport cost savings in terms of time and labor based on an example from the memoir of Chullasapya (Reference Chullasapya2011).
The Tourism Authority of Thailand states that modern long-tail rowboats operating in Damnoen Saduak Floating Market can transport a maximum of eight adult tourists. The historical photos in Figures 2a and 2b depict slightly smaller long-tail boats that likely had a maximum carrying capacity of about six persons. Based on an average weight of an adult human of 62 kilograms (Walpole et al. 2012), we assume that a long-tail rowboat historically used by orchardists could, thus, bear the weight of 6 people or 372 kilograms. If for each trip, there were two orchardists in the boat, at a maximum, the fruit weight that could be loaded would be about 248 kilograms, equivalent to roughly 83 durians per trip.Footnote 6 In Chullasapya (Reference Chullasapya2011), the author traveled along the Bang Khunnon canal, and then the Bangkok Noi canal to the floating market at the junction with the Bang Bamru canal. Since the Bangkok Noi canal is an old branch of the natural Chao Phraya River, we assume that it has always been there. Assume that Chullasapya’s orchard was situated at the midpoint of the Bang Khunnon canal (at present the Bang Khunnon Road), which historically ran parallel to the Bangkok Noi canal for most of its length. This point on the Bang Khunnon canal is situated about 500 meters on foot from the Bangkok Noi canal. Had there not been the manmade Bang Khunnon canal, he and his mother would have had to carry the durians on foot to the Bangkok Noi canal to load their products onto a boat.Footnote 7 An individual can comfortably shoulder and hand carry about 15 percent of their weight, and a highly fit man can carry around 23 percent of his weight.Footnote 8 Using the assumption that the average adult weighs 62 kilograms, for each trip, an orchardist would be able to carry about 9.3 to 14.26 kilograms or three to five durians. To be able to transport on foot all durians that could have been carried in a single boat trip (248 kilograms) from his orchard to the Bangkok Noi canal, approximately 17 to 27 roundtrips on foot were needed. With the assumption that the stretch of 500 meters takes five minutes to walk, this would take two persons roughly 85 to 135 minutes to complete 17 to 27 round trips together, which is, to our approximation, the amount of time that could be saved by being directly situated on the canal in this example.Footnote 9 Instead of setting out at 5:00 am to reach the Bang Bamru floating market by dawn as recorded in Chullasapya (Reference Chullasapya2011), he and his mother would have had to start their day at about 2:45 am at the earliest and about 3:35 am at the latest in order to bring the same amount of durians to market had they not had a transport canal running through their orchard.
Alternatively, we calculate the time cost savings in terms of the labor costs. Assume that a wage laborer (manual labor) earned 0.75 baht per day and a normal workday was ten hours long, meaning that the hourly wage is 0.075 baht.Footnote 10 To hire two laborers to carry the estimated 248 kilograms on foot for more than 85 to 135 minutes, the orchard owner would need to pay a total of 0.21 to 0.34 baht in wages, which is equivalent to 4.94 to 7.85 kilograms of rice, or 10.61 to 16.85 days of adult nutrition from rice.Footnote 11 On the other hand, assume that without the Bang Khunnon canal, the Chullasapya family privately invested in an irrigation canal linking their orchard to the Bangkok Noi canal. Since irrigation canals usually allow a small boat that can carry only two persons—including the rower—to pass through, only about 62 kilograms, or about 20 durians, could have been carried per trip. Assuming that rowing 500 meters takes five minutes, 35 minutes would have been needed for a single rowboat to carry 248 kilograms of durians to the Bangkok Noi canal. In the case of having access to irrigation canals, the time and labor costs are significantly smaller. However, the orchardist would have had to incur the cost of irrigation canal construction. It is estimated that a 500 meter irrigation channel would have cost 250 baht, which is the equivalent of paying for 333.33 full days of manual labor.Footnote 12
The previous example elucidates the extent to which having a transport canal abutting one’s orchard could save both time and labor costs. The cost savings were significant even for a mere stretch of 500 meters. This, in turn, potentially incentivized cultivators whose plots were crosscut by transport canals leading to better access to markets to plant more fruit trees and be more productive. In the subsequent sections, we empirically investigate this precise hypothesis.
DATA AND VARIABLES
To assess the impact of access to the canal transport network on household-level agricultural productivity, we use a unique household-level dataset constructed from Bangkok orchard land deeds/tax records (ton khūa chanōt sūan in Thai; also referred to as “garden title deeds” in English) issued in the 1880s.Footnote 13 The deeds, which functioned as both ownership and land tax documents, are part of the Department of Lands Museum document collection. They provide unique household-level information that was rarely recorded and difficult to find in developing countries’ historical records. We are interested in orchard outcomes since orchard cultivation was one of the most important economic activities among commoners in Bangkok during the period under review (Sternstein Reference Sternstein1966). We estimate from the 1883 Postal Census that 33 percent of Bangkok households enumerated in canal communities located primarily on the west side of the Chao Phraya River, and 16.4 percent of Bangkok households overall, engaged in orchard agriculture (Department of Post and Telegraph (Siam) 1883).Footnote 14 Learning about orchard productivity, as a consequence, can provide insights into the standard of living of a large and important group of economic agents in Bangkok during the late nineteenth century.
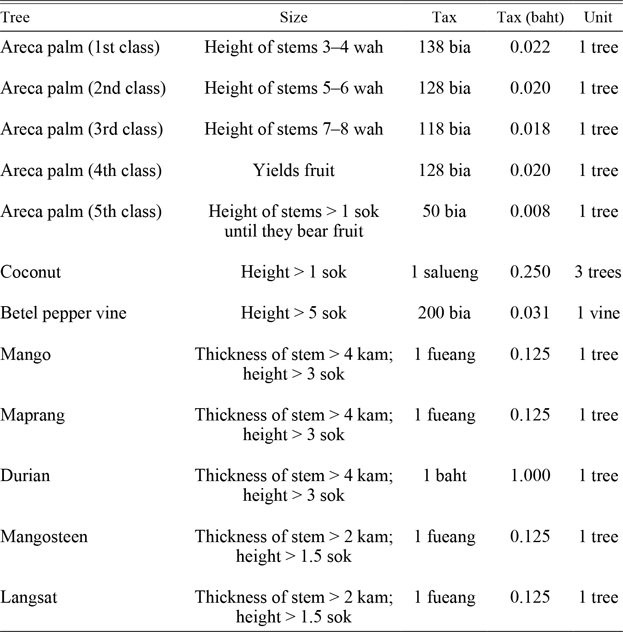
To measure orchard cultivation productivity, we make use of the tax assessments recorded on the 1880s garden title deeds. Garden title deeds played a dual role as both an ownership and a tax document for orchard lands in Siam’s Central Plain. The Siamese government granted ownership rights (technically, secure usufruct rights) to anyone who cleared the land, planted crops within the first three years, and paid annual land taxes. In the case of orchard lands, taxes were paid on a per tree basis, where the tax rate was set based on the value of each type of tree’s produce in the market. Orchard taxes were assessed on mature trees that produced cash crops, including five types of areca nuts, coconuts, betel leaf vines, mangos, durian, mangosteen, maprāng, and lāngsāt. The orchard tree tax rates used in the 1880s tax assessment are given in Table 1.
TAX SCHEDULE FOR PLANTATIONS CROSSED THROUGH BY DITCHES OR HIGHER LYING PLANTATIONS

Notes: All payments are expressed in grams of silver per day. The expression p(x) indicates the xth percentile below which our wages are used in the analysis.
Sources: The Fabbrica of St. Peter (see Online Appendix 1).
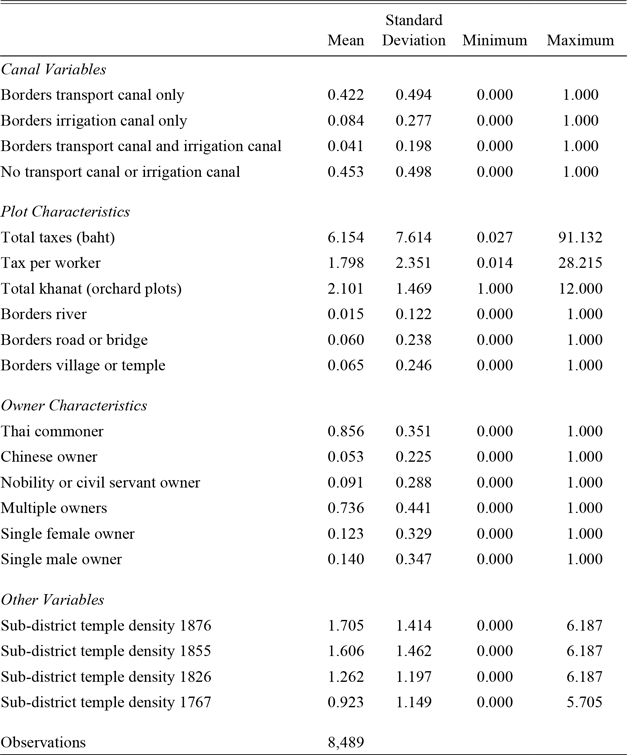
Since assessing taxes on orchard lands was a labor intensive and time-consuming process, orchard land taxes were assessed only once per reign (Nabarath Reference Nabarath2000, p. 74). The documents used in this study are copies of the garden title deeds issued during King Rama V’s land tax reassessment ordered in 1882 and executed between 1884 and 1889 (Directory for Bangkok and Siam, 1914 1914, pp. 40, 61–2). These copies made up the central registry of orchard lands overseen by the Ministry of Agriculture (krom nā) and were in use between 1884 and 1908.Footnote 15 Just under 50,000 orchard deeds were issued in the 1880s tax assessment in Bangkok and eight other provinces in central Siam. Over 33,000 of the deeds survive today, of which 10,158 were issued in Bangkok. The sample used in this study contains 8,489 orchard deeds covering 19 districts and 42 modern sub-districts in Bangkok.Footnote 16 The majority of the properties are of moderate size (0.68 hectares on average) located on the west side of the Chao Phraya River, across from the new Bangkok settlement.Footnote 17 Unlike the east side that is characterized as a floodplain, the west side of the Chao Phraya River is well-known as an area densely packed with various types of orchards since the Ayutthaya period (Skinner Reference Skinner1957; Sternstein Reference Sternstein1966). The geographical distribution of the sub-districts covered in the sample is depicted in Figure 1, and the summary statistics calculated from the land deeds is provided in Table 2.
SUMMARY STATISTICS

Source: Authors' calculations from the Department of Lands Museum land deed collection.
The portion of the deed document that was issued to the owners included an inventory of mature fruit trees and the total tax assessment based on the total number of trees enumerated. Although the Ministry of Agriculture’s deed copies used in this study list only the total tax assessment and do not include the detailed tree inventories, the total tax assessment is highly correlated with the total number of trees cultivated, and, thus, reflects orchard production.Footnote 18 Based on Table 2, the average total tax assessment in the sample is 6.15 baht, which is, according to the tax schedule in Table 1, equivalent to solely growing 308 class 2 areca nut trees or cultivating roughly 6 mature durian trees that could annually bear altogether around 600 durian fruits.
On the garden title deeds, the size of each property was recorded in khanat, a common orchard measure that roughly translates to “orchard plot.” A khanat, however, cannot be converted to the exact metric units, as it varied in size according to the crop cultivated (Nabarath Reference Nabarath2000).Footnote 19 Nevertheless, important to our analysis, a khanat is strongly related to the number of labor required to work the orchard (Jan 2008). According to an article in the Vachirayan Journal published in 1891, well-to-do orchard households generally hired labor to help in their orchards; however, most orchard households relied on their own household labor inputs (Jan 2008, pp. 31–32). It was not uncommon to find orchard households that were solely comprised of a husband and wife. In this case, they were the poorest in the strata, and with the labor of two persons, they could cultivate only one khanat of an orchard. The article then concludes that while a husband and wife could operate only one khanat, orchards could range from 2 to 20 khanat depending on the labor inputs of household members and hired workers.
Based on the historical account noted earlier that one khanat was generally operated by two people, we make the following assumption:
 $$\[orchard\,labor\,productivity\, = \frac{1}{2}\left( {\frac{{total\,output}}{{khanat}}} \right).\,{\rm{In}}\,{\rm{other}}\,{\rm{words}},\,2 \times \,khanat\]$$
is our proxy for the number of workers or the labor inputs utilized on each property. Although we cannot directly observe the exact number of workers, our assumption is well-grounded in the historical account. Of the 8,489 observations used in the following analysis, the number of orchard plots range from 1 to 12 khanat, and on average each property was 2.1 khanat. Based on the Vachirayan Journal account that a khanat was generally worked by two people, this means that on average the nineteenth-century orchard household in Bangkok had about 4.2 working-aged members. This matches very well with the information from other historical sources that the household size in the Central Plain was roughly 5–6 persons, which includes small children, the elderly, and possibly some household members who worked full-time outside of the orchard.Footnote 20 In addition, 4,051 properties were of one-khanat size. This is almost half of our sample and hence in line with the claim in the Vachirayan Journal that it was not uncommon to find orchard households with labor provided by just a husband and wife. Accordingly, in the following empirical analysis, the labor productivity of the orchard equals the total orchard output (proxied by the total tax assessment) normalized by the number of khanat listed in the garden title deed, divided by two.
The garden title deeds also contain information on the variable of interest: access to the canal transport network. In particular, the land deeds record whether each property directly bordered a transport canal (klong), an irrigation canal (lamkradōng), or both. We code each property as belonging to one of four mutually exclusive groups: properties that have access to transport canals only, properties that have access to irrigation channels only, properties that have access to both transport and irrigation canals, and properties that do not have access to either type of canal (excluded category). Since the main interest of the article is to investigate the impact of transport network access, such coding helps separate the effect of water transport from irrigation. More specifically, we make a distinction between canals (klong) built by the government or private investors mainly for transport purposes, and irrigation canals (lamkradōng) built by individual orchardists primarily for the purpose of water management.
Lamkradōng channeled water from the main waterways into the orchards. These irrigation canals also acted as gravity dams, which were used to control the amount of fresh water coming from the north, especially during the monsoon season, and sea water coming from the river mouth to get the right amount of brackish water that is conducive to each type of orchard crop. Unlike canals built specifically for transport purposes, irrigation canals were narrow, only allowing for small boats for two persons to pass through. It is important to note that while both klong and lamkradōng were used to provide water input for irrigation, klong could not be used for water management in the same way as purpose-built lamkradōng. Likewise, although the lamkradōng could be used for transport over short distances, they were not major routes and did not have the same transport and market functions as the klong. We maintain in the subsequent empirical analysis that the coefficient estimates for the canal variable mainly capture access to the transport network and markets, whereas the irrigation canal coefficient estimates primarily capture water management and other correlated land improvement investments by individual owners.
Table 2 indicates that 42.2 percent of properties abutted transport canals only, 8.4 percent were bordered by irrigation canals only, and 4.1 percent of properties were adjacent to both transport and irrigation canals. Our canal variables provide unique information rarely covered in the transport network access literature. Lacking individual household, firm, or plot-level data, much of the existing literature can only identify whether a locality encompassing the economic activity of interest was affected or crosscut by the transport network. Our analysis complements the existing studies by allowing for an investigation into the direct impact of access to transport infrastructure on economic actors situated directly on the routes.
The deeds are enriched with other information, including the property dimensions, location (province and historical sub-district), and the nature of neighboring properties or land features. The deeds also contain limited information about the plot owners, including sex, social class, and relationships between owners listed on the deeds. The variables created from this information are summarized in Table 2. From Table 2, orchard properties were largely owned by commoners, meaning that the nobility, civil servants, and the growing Chinese community held the minority of properties. In addition to canals and irrigation channels, 6 percent of properties bordered roads and 1.5 percent bordered the Chao Phraya River. The temple density variables are explained in the Robustness Check section.
EMPIRICAL STRATEGY AND RESULTS
In order to investigate the impact of gaining access to the transport network on agricultural productivity in nineteenth-century Bangkok, we employ the following empirical model.
 {y_i} = {\beta _0} + {\beta _1}transport\_cana{l_i} + {\beta _2}irrigatio{n_i} \\
+ {\beta _3}transport\_canal\_irrigatio{n_i} + X_i^'\gamma + \theta + {\varepsilon _i} \\
The dependent variable is orchard labor productivity, as outlined in the Data and Variables section, measured in logged value, labor productivity i
 $$\[ = \ln \left( {\frac{{total\,ta{x_i}}}{{khana{t_i}}}} \right) - \ln 2\]$$. The main variable of interest, transport_canal i, is a binary variable indicating whether landholding i borders a transport canal (klong) only. Crucial to our identification strategy, canals in nineteenth-century Bangkok can be taken as exogenous to orchard productivity. The purposes of construction and hence the locations where the canals were cut were independent of orchard production, as explained in the Historical Background. This is not dissimilar to the strategy used in Reference Brunt and CannonBrunt and Cannon (2014), where the canals, which were built for the transport of coal and manufacturing goods, are taken as an exogenous driving force for English wheat market integration. While we think this assumption is plausible and the setup is, thus, safe from reverse causality, it does not exclude the possibility of unobservable selection concerns, which will be further tested in the next section.
A vector of controls, X i, which includes whether the property borders the Chao Phraya River, roads or bridges, and villages or temples, is added to the model. We also control for the property size (total khanat) and owner characteristics (being a member of the nobility and/or civil service, first- or second-generation Chinese, single female owner, and single male owner). We also control for sub-district fixed effects, θ, which help capture sub-district characteristics such as soil quality and general economic development. The error term is ε i.
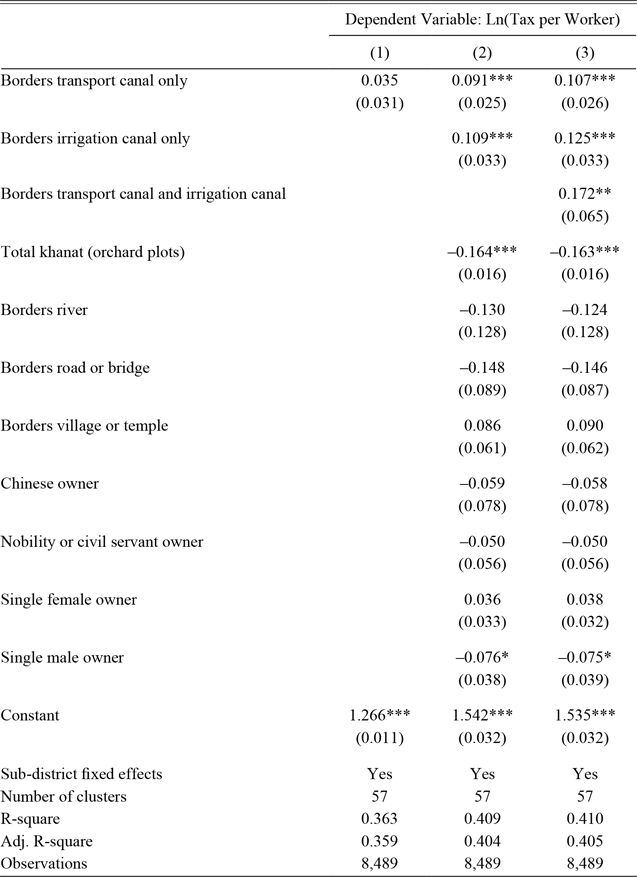
Table 3 reports the baseline regression results based on the empirical strategy in Equation (1). With reference to Column (1), properties that bordered transport canals were likely to pay about 3.5 percent higher taxes per worker. Based on our two-workers-per-khanat assumption, this implies that labor productivity of the properties located next to transport canals were 3.5 percent higher than those which were not. When controlling for other individual property characteristics in Column (2), bordering a canal is statistically significant and exerts an even larger contribution to labor productivity improvement at 9.1 percent. Our preferred specification in Column (3) separately identifies properties that have access to both transport and irrigation canals, which slightly increases the magnitude of the impact of having only canal access to 10.7 percent.
IMPACT OF CANAL ACCESS ON LABOR PRODUCTIVITY

Notes: ***p < 0.01, **p < 0.05, *p < 0.1. Standard errors clustered at the sub-district level are reported in parentheses.
Source: Authors' calculations from the Department of Lands Museum land deed collection.
Having access to both transport and irrigation canals contributes to a 17.2 percent orchard labor productivity improvement, which is greater than the individual effects of having access to a transport canal alone (10.7 percent) or only having access to an irrigation canal (12.5 percent). This confirms our maintained hypothesis that there exist distinct functions for each type of waterway. More specifically, while transport is mainly provided by transport canals, water management is likely to be exclusively facilitated by irrigation canals. Nevertheless, the impact of being connected to both types of the canals is smaller than the sum of the individual effects (23.2 percent). We interpret this as an indication that there must be some functions, for instance water input provision, that can be offered by both types of canals, and hence are substituted when plots were crisscrossed by both.Footnote 21
Even though roads provided an alternative mode of transport, it is found in Table 3 that being connected to roads does not have a statistically significant association with labor productivity. This is likely rooted in the fact that roads in nineteenth-century Bangkok were less relevant for transporting agricultural products. Roads were primarily located in government quarters, where orchard production was limited. In addition, in order to make use of the roads and bridges, cultivators needed carts. Carts were not as efficient as boats in terms of speed. This, as a result, could possibly explain why although some orchards were connected to roads and bridges, it was unlikely that orchard owners were able to exploit roads as transport channels in the late nineteenth century.
ROBUSTNESS CHECK: CONSIDERING UNOBSERVABLE SELECTION
The concern that orchardists may sort into plots adjacent to canals could call into question the validity of the results. In particular, highly productive cultivators might sort themselves to locate next to canals, leading to an upward bias on the canal coefficient. Alternatively, inexperienced cultivators could constitute a group that claimed newly opened land by new canals, leading to a downward bias of the productivity estimation. This is especially a concern in sparsely populated areas. Every time new canals were constructed, the probability of orchardists moving onto pieces of newly canal-connected land was higher in sparsely populated neighborhoods than in more populated areas where newly cut canals were more likely to crosscut already occupied land.
Ideally, plot-level panel data with measures of both pre- and post-canal construction orchard productivity would mitigate self-selection concerns. However, with limited historical data of a cross-sectional nature, this type of investigation is not possible. Alternatively, we address the self-selection issue by employing a methodology developed in Oster (Reference Oster2014, 2019) and used, for example, by Gonzalez and Miguel (Reference Gonzalez and Miguel2015), for evaluating the robustness of coefficient estimates to omitted variable bias under the assumption that the relationship between the treatment (bordering transport canals) and the unobservables (related to self-selection) can be recovered from the relationship between the treatment and the observables. In particular, in what follows, under a range of possible population R 2 values, we attempt to recover the values of the unobservables in relation to the observables that can drive the canal coefficient reported in Table 3, Column (3) down to zero. We then further investigate whether such values are probable. If such values are not possible, as is suggested by further empirical validation, we will conclude with some confidence that the results reported in Tables 3 are robust to omitted variable bias, including our self-selection concerns.
With reference to Oster (Reference Oster2014, 2019), let us define the proportional selection relationship as
 $$\[\delta \frac{{{\delta _{1canal}}}}{{\sigma _1^2}} = \frac{{{\sigma _{2canal}}}}{{\sigma _2^2}},\]$$
where δ is the coefficient of proportionality and subscript i ∈{1,2} denotes the observables and the unobservables in Equation (1), respectively, such that σ 1canal is the covariance between the observables and the canal variable, σ 12 is the variance of the observables, σ 2canal is the covariance between the unobservables and the canal variable, and σ 22 is the variance of the unobservables. In other words, the proportional selection relationship defines the relationship between (1) the correlation between the observables and the bordering canal variable and (2) the correlation between the unobservables and the bordering canal variable. We do not make any assumptions about δ. In fact, the main objective of the following exercise is to recover the values of δ.
Using a standard omitted variable formula, the consistent estimator of the effect of bordering a transport canal on orchard labor productivity, such that  $\[\beta *\mathop \to \limits^p \beta \]$, can be defined as
 $$\[\beta * \approx \hat \beta - \delta (\tilde \beta - \hat \beta )\left( {\frac{{{R_{\max }} - \hat R}}{{\hat R - \tilde R}}} \right),\]$$
where  $\mathop \beta \limits^ \wedge $ is the coefficient estimate of the canal variable, and
 $\mathop R\limits^ \wedge$ is the R 2 from the regression that includes observable covariates (Table 3, Column (3)). Let
 $\mathop \beta \limits^\tilde$ and
 $\mathop R\limits^\tilde $ be the coefficient and R 2 estimates from the uncontrolled regression (Table 3, Column (1)), respectively. R max is the hypothetical R 2 when a regression includes all observables and unobservables (Oster Reference Oster2014, 2019; Gonzalez and Miguel Reference Gonzalez and Miguel2015).
Our objective is to find the value of δ that produces a canal effect of zero ($\mathop \beta \limits^ \wedge$* = 0). For example, from Columns (1) and (3) of Table 3, we know that $\mathop \beta \limits^\tilde$ = 0.107, $\mathop R\limits^ \wedge$ =0.410, $\mathop \beta \limits^\tilde$ = 0.035, and $\mathop R\limits^\tilde$ = 0.363. Substituting the values previously noted and taking β * = 0, we can rewrite Equation (4) as the equation illustrating the relationship between
 $$\[\delta \approx \frac{{0.0698}}{{0.410 - {R_{\max }}}}\]$$
We know that R max ∈[$\mathop R\limits^ \wedge$, 1] and, thus, it is clear that δ in our case is negative (Gonzalez and Miguel Reference Gonzalez and Miguel2015).Footnote 22 However, when R max = $\mathop R\limits^ \wedge$, there are no omitted variables and δ is undefined. Using the most conservative assumption that R max= 1, we find that δ » –0.118. In order to fully “drive away” the canal impact (in other words, for β* = 0), the unobservables need to be at least 0.118 as large as the observables and also correlate to the canal variable in an opposite direction to the correlation between the observables and the canal variable. As R max falls, the absolute value of δ increases in a non-linear fashion. For instance, for the domain of R max ∈[0.411, 1], the range of δ is δ ∈[–69.8, –0.118].
This exercise shows that to produce zero impact of bordering a transport canal on labor productivity, δ needs to be negative, implying a positive correlation between the unobservables and the canal variable. This is because we find a larger estimated coefficient on the canal variable when observed controls are added to the regression, which suggests that in the uncontrolled regression, the canal estimator is biased downward. Such downward bias indicates an overall negative correlation between the observed controls and the canal variable. Following this, a negative proportional selection relationship (δ) implies a positive correlation between the unobservables and the canal variable. In other words, to be able to threaten the validity of a positive causal relationship between having access to transport canals and orchard labor productivity, the omitted variables have to be positively correlated to the canal variable. Putting this in economic terms, if the omitted variables that we are worried about are related to self-selection as explained earlier, the nature of the selection on average has to be in a way such that highly productive orchardists sort themselves to locate next to canals and their productive characteristics drive away the impact of canals in our estimation, thwarting a causal interpretation. In what follows, we call the selection process noted earlier positive sorting.
Next, using available information, we investigate whether positive sorting, as outlined earlier, is probable. If the data suggests that positive sorting is unlikely to be the case, we, to a certain extent, can safely claim a positive causal effect of gaining access to the canal transport network on orchard labor productivity. Although land sales were not uncommon, it was less prevalent in nineteenth-century Bangkok before the adoption of a Western land code in 1901 (Chankrajang and Vechbanyongratana Reference Chankrajang and Vechbanyongratana2017). Nabarath (Reference Nabarath2000, pp. 85, 88) suggests that extended families tended to stay together by leasing or buying adjacent plots, giving few opportunities for outsiders to move into already densely populated areas. Thus, we make an assumption that household movement and sorting into plots adjacent to transport canals was more likely to happen in less populated areas than in densely populated areas. Other things being equal, if more productive orchardists sort themselves to locate by newly dug transport canals, we should find that having access to transport canals has a marginal positive impact on productivity for the orchardists in less populated areas compared to those in more densely populated neighborhoods where occupying new properties is more difficult.
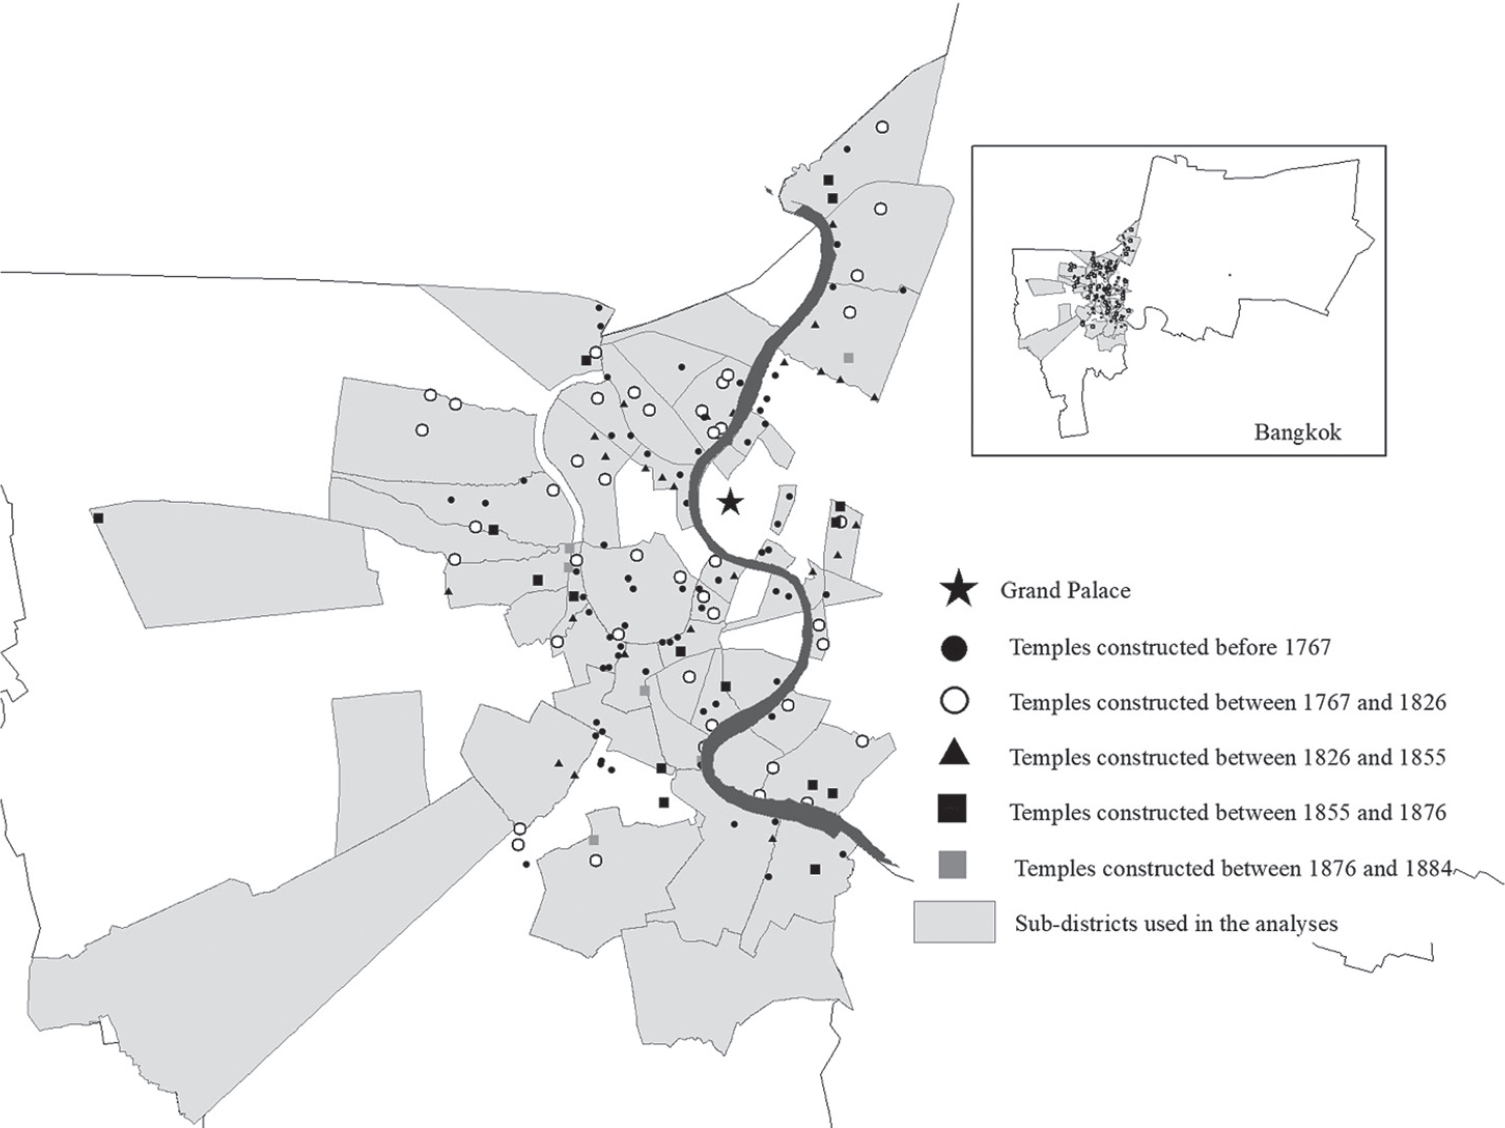
In order to test the hypothesis previously noted, we introduce a new variable to proxy for population density, temple density s, which is the number of temples per square kilometer in sub-district s at various points in time. We make use of the construction date for each temple listed in a temple inventory commissioned by the Department of Religious Affairs in 1982 in order to construct the number of temples existing in each area (Wuthijan and Thianthong Reference Wuthijan and Thianthong1982).Footnote 23 Lacking information on historical sub-district boundaries, we approximate historical sub-district areas by using current sub-district dimensions. The constructed temple density variable captures population density and economic development in sub-district s, based on historians’ and archeologists’ general interpretation that the presence of temples is evidence of settlement and population density (Chuwichian Reference Chuwichian2018). The summary statistics of temple density in various periods are provided in Table 2. Figure 3 illustrates the distribution of temples across the area of study.
DISTRIBUTION OF BANGKOK TEMPLES
Source: Compiled by the authors based on the data from Wuthijan and Thianthong (1982).

More densely populated areas with fewer open properties are more likely to have higher values of temple density s. With reference to Equation (5), if in less populated areas it was more likely for productive orchardists to sort themselves to gain access to transport canals than in more populated area, the estimated value of β3 is expected to be negative and statistically significant.
 $$ {y_i} = {\beta _0} + {\beta _1}transport\_cana{l_i} + {\beta _2}templedensit{y_s} \\
+ {\beta _3}transport\_cana{l_i}*templedensit{y_s} + X_i^'{\rm{\gamma }} + \phi + {\varepsilon _i} \\$$
In other words, if the earlier assumption on positive sorting holds, labor productivity of orchardists who operated by transport canals in sub-districts with fewer temples is expected to be higher than for properties next to transport canals in densely populated sub-districts where sorting cannot easily occur.
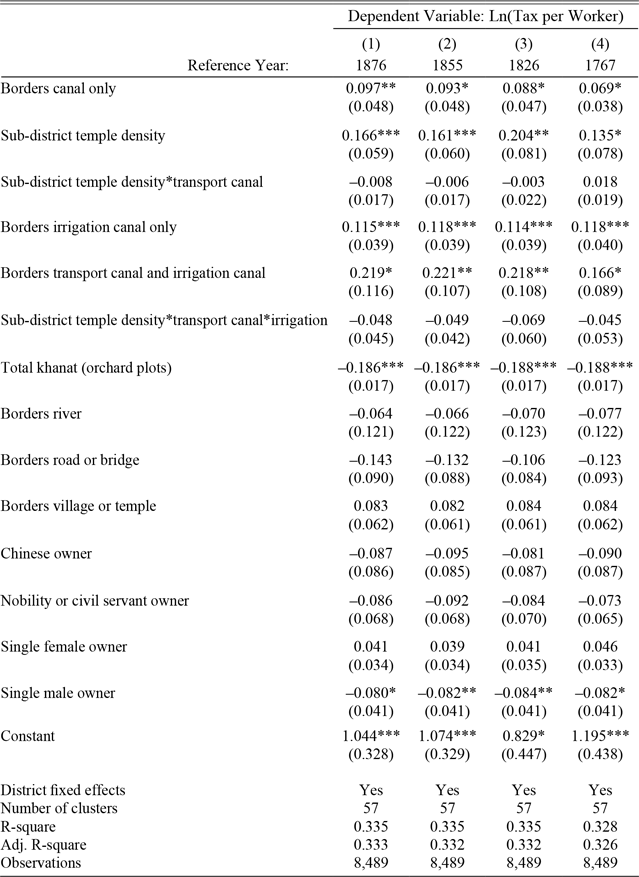
In the construction of temple density s, we vary the cutoff dates for enumerating the temples in each sub-district. In Table 4, Column (1), 1876 is chosen as the shortest time span such that fruit trees (e.g., durian and areca nut trees), would have enough time to mature prior to recording the garden title deeds starting in 1884.Footnote 24 This captures population density across Bangkok just before the time of the tax assessment and after a period of rapid growth following Siam’s opening up to international trade in 1855. A cutoff date of 1855 is chosen in Column (2) to correspond to the signing of the Bowring Treaty, which effectively abolished the government’s monopoly on international trade and hence is generally considered to be the date of Siam’s exposure to the force of international trade. This hence led to more canal construction to transport export commodities and the development of new communities and temples. In Column (3), a cutoff date of 1826 is picked as an alternative date of the opening of international trade due to the signing of the earlier but less successful Burney Treaty with Britain. In the last column, the year 1767 corresponds to the fall of Ayutthaya. This date is chosen to mark the difference in population densities between sub-districts that can be dated to Ayutthaya period from those that are new settlements. Finally, note that since temple s varies at the sub-district level, we can no longer control for sub-district fixed effects. To take neighborhood characteristics into account, we instead control for district fixed effects, φ. The results of regression specifications that correspond to Table 3 (Column (3)) are reported in Table 4.
ROBUSTNESS CHECK ON THE POSSIBILITY OF POSITIVE SORTING

Notes: ***p < 0.01, **p < 0.05, *p < 0.1. Standard errors clustered at the historical sub-district level in parentheses.
Sources: Authors' calculations from the Department of Lands Museum land deed collection and temple data compiled from Wuthijan and Thianthong (1982).
All regression results indicate that bordering a canal exerts a positive and statistically significant contribution to orchard labor productivity improvement. In addition, the results from all specifications imply that orchard productivity improves with greater temple density. As the temple density variable provides a proxy for population density and, to some extent, a proxy for sub-district economic activity, the results suggest that an improvement in the development of neighborhoods and local markets resulted in higher labor productivity.
Recall that our main objective in this section is to investigate whether we observe more productive orchardists sorting into properties on new canal construction in areas with more available land, in other words, sub-districts with lower population density proxied by lower temple density. In other words, we want to know whether the estimated coefficient β3 is negative and statistically significant. The estimated β3 in all specifications, regardless of which measure of population density used, is no different than zero, suggesting that there is no positive sorting to areas with open property next to canals. The interaction term between temple density and properties that border both transport canals and irrigation canals is also no different from zero for all date cut-offs, further bolstering our argument that positive sorting is not likely.
The empirical study previously noted, as a result, suggests that a negative δ is not likely to be the case. In fact, it demonstrates neither positive nor negative selection and that the presence of omitted variables in Table 3 is likely to be negligible. With a certain degree of confidence, based on the methodology for evaluating robustness to omitted variable bias developed by Oster (Reference Oster2014, 2019) and the historical support on the exogeneity of canal construction, we can interpret the effect of bordering transport canals on orchard labor productivity as positive and casual.
Welfare Implications
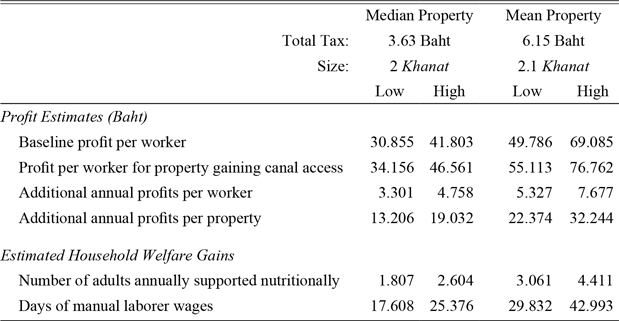
Due to data limitations, previous work on the economic impacts of transport infrastructure investments have only assessed economic outcomes at an aggregate level. The strength of this current project is that we can assess potential welfare gains of canal construction at a household level. In this section, we consider welfare implications by translating labor productivity gains to monetary values. In the following exercise, we estimate annual profits based on revenue and input cost assumptions from historical sources for the median and mean properties. We then calculate profit gains based on the coefficient estimates from Table 3, Column (3), which indicate that a property gaining direct access to a canal on average has a 10.7 percent increase in labor productivity. In order to provide context to the estimated profit gains, we then convert the estimates into measures of adult nutrition and days of manual labor wages.
Based on 195 surviving tree inventories from replacement garden title deeds issued between 1901 and 1906, we find that 89 percent of the trees assessed for taxes were areca nut, thus making up the overwhelming majority of taxable orchard produce. Although the taxes recorded in the deeds cover several types of cash crops, for simplicity we assume that orchard households in Bangkok engaged only in areca nut production. Areca nut is an addictive mild stimulant that is traditionally chewed with betel leaf. Betel chewing was ubiquitous among the inhabitants of Bangkok during this time period and was sold in the local markets, as was observed by Fournereau (Reference Fournereau1998) in his 1892 travel memoir. This section, as a result, uses an estimation based on areca nut trees to calculate the welfare implications of gaining access to the canal network.
We consider the median and mean properties in terms of the total tax assessment. The median property was assessed 3.63 baht in taxes per year and was 2 khanat in size, while the mean property was assessed 6.15 baht per year and 2.1 khanat. This means that the median and mean plots paid 0.91 and 1.46 baht in annual taxes per worker, respectively. Assume the tax rate per areca nut tree was 0.02 baht, which means that the median and mean plots grew 45.38 and 73.21 trees per worker.Footnote 25 Suppose that our representative orchards gained access to a canal. The coefficient estimate in Table 3, Column (3) suggests that worker productivity on average would have increased by 10.7 percent. Thus, the median and mean properties would increase output per worker by 4.86 and 7.83 trees, which translates to 19.42 and 32.90 additional trees for the median and mean properties, respectively.
We estimate annual profits for the representative properties as follows:
 $$\[\pi = revenue - input\,\cos ts - taxes\]$$
To estimate orchard profits, we make revenue and cost assumptions based on historical narratives about annual revenues, orchard maintenance costs, and taxes in the mid-1880s and early 1890s to coincide with the timing of the issuance of the orchard deeds. The article “About Orchards,” published in the Vachirayan Journal in 1891, estimates that one areca nut tree generated revenues of 1 baht per year (Jan 2008). As mentioned earlier, the article says that most orchards relied on their own family labor and did not hire workers (Jan 2008). Thus, we assume that there are no direct labor costs for normal upkeep and fruit picking on these modest properties. However, Nabarath (Reference Nabarath2000, p. 133) suggests that orchardists generally hired manual labor at a rate of 16 baht per khanat “every few years” to perform more physically demanding work, including re-cutting ditches, loosening the soil, and clearing flood water. Thus, we assume that on average an orchard owner spent 5.33 baht per khanat per year for heavy maintenance. Compared to more recent input cost estimates, Nabarath’s (Reference Nabarath2000) figures are low. Thus, we perform a second profit estimation assuming that annual costs are 30 percent of revenues based on historical estimates for Thailand from the 1930s in Zimmerman (Reference Zimmerman1931) and modern estimates from Imtip (Reference Imtip1991). These two cost assumptions give a high and low profit estimate. Finally, we assume the tax rate for the representative areca trees is 0.02 baht per tree. Given these parameters, gaining canal access would increase annual profits by 13.21 to 19.03 baht for the median property, and by 22.37 to 32.24 baht for the mean property.
In order to contextualize these increases in annual profits for the median and mean properties, we convert the estimates into two measures of welfare: (1) the number of adults who could be supported nutritionally annually, and (2) the number of days of an urban manual laborer’s wages. We calculate the number of adults who could be supported nutritionally by rice using Feeny’s (1982, p. 150) methodology and assumptions on historical nutritional needs for Thai adults. We use the following assumptions on rice prices, nutritional needs, and laborer wages: (1) the price of rice is the 1885–89 export price of 0.043 baht per kilogram (Manarungsan Reference Manarungsan1989, p. 215); (2) adults consumed 170 kilograms of rice annually, which made up 85 percent of nutritional requirements for subsistence (Feeny 1982, p. 150); and (3) an urban manual laborer earned 0.75 baht per day in 1889 (Feeny 1982, p. 132). The profit estimates, as well as the welfare estimates based on nutrition and days of wage work, are reported in Table 5.
ESTIMATED WELFARE GAINS FOR THE MEAN HOUSEHOLD LOCATED ADJACENT TO NEW CANAL INFRASTRUCTURE

Notes: We make the following assumptions: 170 kilograms of rice is needed for subsistance (Feeny 1982, p. 150); export rice price is 43 baht per metric ton between 1885 and 1889 (Manarungsan 1989, p. 215); and the urban laborer wage is 0.75 baht per day in 1889 (Feeny 1982, p. 132).
Sources: Authors’ calculations based on the Department of Lands Museum land deed collection and assumptions explained in the text.
The additional estimated profits from an orchard owner gaining access to the canal network translates into supporting annually an additional 1.81 to 2.60 adults nutritionally for the median property, and 3.06 to 4.41 adults for the mean property. Additionally, the increased agricultural profits translate into 17.61 and 25.38 days of manual worker wages for the median property and 29.83 and 42.99 days of manual worker wages for the mean property during the time period. The estimates suggest that orchard households that gained direct access to the canal network saw moderate welfare gains in nineteenth-century Siam.
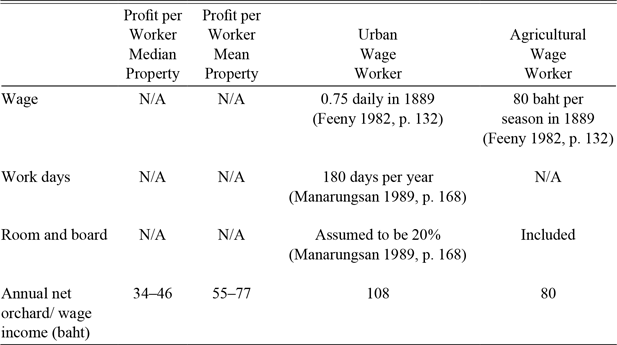
Finally, we address the issue of opportunity cost of adults working as unpaid family labor in orchard households. Our estimates suggest that annual per capita orchard profits for properties that gained canal access ranged from 34.16 to 46.56 baht for the median property and 55.11 to 76.76 baht for the mean property. Even the most conservative per capita profit estimate easily surpasses the amount needed to support an adult nutritionally with rice at prevailing 1889 export prices. How do these per capita profit estimates compare to urban manual laborer and agricultural laborer wages? Table 6 gives a comparison of per capita orchard profits with urban and agricultural wages in 1889.
COMPARISON OF PER CAPITA ORCHARD PROFITS, URBAN LABORER WAGES, AND AGRICULTURAL WORKER WAGES

Sources: Authors' calculations based on the Department of Lands Museum land deed collection. See table for wage rate assumptions.
Scholars have noted that wages in late-nineteenth century Bangkok were relatively high in the region, which partially explains the migration of Chinese laborers to Siam in the late-nineteenth century (Skinner Reference Skinner1957; Ingram Reference Ingram1971). In fact, from Table 6 it seems that urban wage workers earn significantly more than the value generated by each unpaid family orchard worker in the representative households. This begs the question of why orchard cultivation was a common activity and why we do not see significant movement of Thai agricultural workers into wage labor at the end of the nineteenth century. There are two points that must be considered. First, the profit estimates from the tax records represent a lower bound because the tax documents only capture taxable produce and do not capture the production of non-taxable crops for either home consumption or sale in the market, or any other supplemental economic activities. In fact, the article “About Orchards” from the Vachirayan Journal explicitly discusses how orchardists can maximize orchard production by suggesting the best trees and plants for intercropping. Thus, the estimated per worker value generated on these orchard properties may be much higher than is estimated here. Second, the majority of orchard deeds list women owners. Of the deeds in the sample, 83 percent list at least one woman owner with a full 12 percent of properties owned by single women. Thai women generally did not engage in manual urban wage labor; thus, the urban wage may not represent the opportunity cost of orchard production for the majority of orchardists.
CONCLUSIONS
In his report on his 1934/35 survey of rural Siam, Andrews (Reference Andrews1935, p. 108) noted the following:
In a commercialized agricultural community where the crops are raised primarily for sale, … communication becomes almost or fully as important as the fertility of the land. It is clear that a farmer who raises crops for sale cannot afford to farm in a region where there is no opportunity for sale of his crops.… In an industrial or commercial community, – in, for example, the cities and market centers of rural Siam, – the communication factor is far more important than fertility.
In addition to irrigation, access to canals afforded orchardists access to communication, traders, and, ultimately, local markets. Our estimation from a historical memoir of an orchardist shows significant time and labor cost savings of having direct access to transport canals. The empirical results support the view that canal access played a central role in individual household decision-making concerning orchard labor productivity. We have argued that canal infrastructure development during the nineteenth century was exogenous to orchard production. Combined with the robustness check that empirically suggests that the problem of positive self-selection into plots adjacent to the canals is unlikely, we can reasonably conclude with some degree of confidence that compared to inland properties, properties with direct access to canals had labor productivity gains of about 10.7 percent. These productivity increases are non-negligible and translate into real welfare gains for households with direct access to the canal network.
Our article contributes to the existing literature that evaluates the impacts of canals on various aspects of economic development and also provides micro-founded evidence for the existing findings in the literature and their implications. Taylor (Reference Taylor2015) points out that canals in the United States helped transform inland backwoods into agricultural centers. Our findings precisely provide empirical evidence supporting this claim and illustrate the micro-foundation of how such a transformation could come about. Hansen and Tourk (Reference Hansen and Tourk1978) and Shiue (Reference Shiue2002) suggest the construction of canals lowers cost of transport and travel time. Our results elucidate the implication of such savings on productivity and welfare improvements at the micro level.
Our results point to the critical role that the expansion of access to transport infrastructure can play in reducing transaction costs and hence incentivizing households to cultivate perishable crops more intensively. Also, the results suggest that much of the benefits of transport infrastructure accrue to those with direct access to the expanded network. Thus, it is possible that the positive average effects found in previous studies may be driven by productivity improvements of those who gain direct access to the network. This highlights the importance of the last-mile problem, which refers to an inability to connect infrastructure with the final users, which has gained increasing attention in development economics and policies in recent years (Ashraf, Glaeser, and Ponzetto Reference Ashraf, Glaeser and Ponzetto2016). The construction of infrastructure, such as transport networks, is virtually useless if it fails to provide access to those who stand to gain. Building transport hubs linking new localities may not be sufficient as a development policy, but expanding them in such a way that they can connect or lower the cost of connection to the final users is more likely to make their potential benefits realized.