Introduction
Groundnut is one of the major oilseed crops grown in India. It is a valuable source of edible oil and protein for humans and utilised as fodder for livestock. Groundnut seeds are used in confectionery products, seasoning blends, bakery mixes, frostings, fillings, cereal bars and nutritional bars. Phosphorus is one of the essential micronutrients for the growth and development of living organisms since it plays a vital role in virtually every plant process that involves energy transfer. The chemical name of phytic acid is myo-inositol 1,2,3,4,5,6-hexakisphosphate. It has a strong binding affinity to important minerals, such as calcium, magnesium (Hurrell et al., Reference Hurrell, Davidsson and Walczyk2004), iron (Hallberg et al., Reference Hallberg, Rossander and Skanberg1987) and zinc (Turnlund et al., Reference Turnlund, King, Keyes, Gong and Michel1984), resulting in the formation of insoluble precipitates, which are in turn non-absorbable in the intestines. This process can therefore cause mineral deficiencies in people whose diets rely on such foods for their mineral intake; thus, a serious diminution of phytic acid is recommended (Hurrell, Reference Hurrell2003).
In monogastric animals including humans, swine and poultry, phytate remains undigested and excreted as such, which in turn gets added to the food chain and leads to water pollution or eutrophication in the environment. Phytic acid reacts with proteins and carbohydrates to form complex products of varying composition, and it has been shown to have an inhibitory effect on the digestion of starch (Yoon et al., Reference Yoon, Thompson and Jenkins1983), soya glycinin and globulin, and gluten proteins (Hidvegi and Lasztity, Reference Hidvegi and Lasztity2002) and on the in vitro digestibility of pepsin and pancreatin (Chitra et al., Reference Chitra, Vimala, Singh and Geervani1995), lactalbumin, casein, serum albumin, and zein in fababean and pea (Carnovale et al., Reference Carnovale, Lugaro and Lombardi1988). Phytate consumption also poses a risk of osteoporosis in humans (López-González et al., Reference López-González, Grases, Roca, Mari, Vicente-Herrero and Costa-Bauzá2008). To overcome these problems, earlier breeding efforts have isolated several low-phytate mutants in crops such as barley (Larson et al., Reference Larson, Young, Cook, Blake and Raboy1998), wheat (Guttieri et al., Reference Guttieri, Bowen, Dorsch, Raboy and Souza2004), soybean (Hitz et al., Reference Hitz, Carlson, Kerr and Sebastian2002; Yuan et al., Reference Yuan, Zhao, Ren, Zhu, Fu and Shu2007) and common bean (Campion et al., Reference Campion, Sparvoli, Doria, Tagliabue, Galasso, Fileppi, Bollini and Nielsen2009). There are different methods available for the determination of phytic acid phosphorus (PAP) content, such as anion exchange column (AEC), high-performance liquid chromatography (HPLC), 31P nuclear magnetic resonance (NMR) and the modified colorimetric method using Wade reagent. Compared with HPLC, AEC and 31P NMR, the modified colorimetric method is simpler and less expensive for assaying a large number of samples, allowing its effective application in breeding and genetic studies of phytate phosphorus in crop plants (Gao et al., Reference Gao, Shang, Saghai Maroof, Biyashev, Grabau, Kwanyuen, Burton and Buss2007). So far, reports on PAP variability in groundnut are lacking. Hence, the present study was undertaken to study the genetic variability of PAP and inorganic phosphorus (InP) contents in cultivated groundnut genotypes developed through mutation and recombination breeding.
Materials and methods
Genotypes
A total of 40 cultivated groundnut genotypes were selected for the present study (Table S1, available online). Of these 40 genotypes, 23 were developed at the Bhabha Atomic Research Centre, Mumbai and the rest were grown at different State Agricultural Universities. These genotypes were grown in a randomized complete block design with two replications at the experimental station (Gauribidanur) during the rainy season (June to September) in 2010 and 2011. Groundnuts were harvested at maturity and dried in the sun. Groundnut seeds grown in the 2 years were used to estimate the PAP and InP contents.
Phytic acid estimation
Samples of five to ten random seeds from each genotype in each replication were ground to fine paste. Around 30 to 50 mg of the ground paste were thoroughly mixed with 1 ml of 2.4% HCl in 1.5 ml microcentrifuge tubes. The tubes containing the samples were shaken at 220 rpm for 16 h in a Lab-Line Incubator Shaker (Lab-Line Instruments Inc., Melrose Park, IL, USA) and centrifuged at 10,062 g in a table-top centrifuge (Eppendorf, Hamburg, Germany) at 25°C for 20 min. The supernatant was then collected for the determination of PAP using the colorimetric method as described by Latta and Eskin (Reference Latta and Eskin1980) and modified by Gao et al. (Reference Gao, Shang, Saghai Maroof, Biyashev, Grabau, Kwanyuen, Burton and Buss2007). Crude acid extracts were transferred to 1.5 ml microcentrifuge tubes containing 1 g NaCl. The contents were vortexed to dissolve the salt and incubated at − 20°C for 20 min to precipitate matrix components that could interfere with the colorimetric reaction. The mixtures were then centrifuged at 10,062 g for 20 min at 25°C to get a clear supernatant. The clear supernatant was diluted 25 times by adding deionized distilled water. Then, 750 μl of the diluted supernatant were mixed with 250 μl of the modified Wade reagent (0.03% FeCl3, 6H2O+0.3% sulfosalicylic acid). The content was thoroughly mixed by vortexing and then centrifuged at 10,062 g for 10 min at 25°C. A series of calibration standards containing 0, 0.5, 1.0, 1.5, 2.0, 3.0, 4.0, 5.0, 7.5, 10 and 12 μg PAP/ml were also prepared from the sodium salt of phytic acid (Sigma, St Louis, MO, USA) and treated in the same way as described above. The phosphorus content of sodium phytate was 18.38% (Gao et al., Reference Gao, Shang, Saghai Maroof, Biyashev, Grabau, Kwanyuen, Burton and Buss2007). The absorbance of colour reaction products for both samples and standards was measured at 500 nm on a UV/Vis spectrophotometer (Jasco, Cambridge, UK). The pink colour of the Wade reagent is due to the reaction between ferric ion and sulfosalicylic acid with absorbance maxima at 500 nm.
InP estimation
For determination of InP content, 400 μl of 12.5% trichloro acetic acid with 25 mM MgCl2 were added to 20 mg of the powdered seed sample in a 1.5 ml microcentrifuge tube and then vortexed. The suspension was kept overnight at room temperature (25 ± 1°C) for proper extraction, and then centrifuged at 10,062 g for 10 min. The supernatant was diluted with deionized distilled water (1:2). Thereafter, 100 μl of the diluted supernatant were then mixed with 900 μl of Chen's reagent (6 N H2SO4, 2.5% ammonium molybdate, 10% ascorbic acid and water, in a 1:1:1:2 proportion) and incubated in a water bath at 50°C for 1 h. A series of standards containing 0.15, 0.31, 0.46, 0.62, 0.77, 0.93, 1.08, 1.24, 1.39 and 1.55 μg InP/ml from sodium dihydrogen phosphate were also prepared and processed in the same way as described above. The absorbance of colour reaction products for both samples and standards was measured at 660 nm. Total InP was estimated by the modified method as described by Chen et al. (Reference Chen, Toribara and Warner1956).
The analysis of variance for assessing InP and phytic acid contents was conducted using CROPSTAT 7.2 software (IRRI, 2009). Genotypic variance and genotypic coefficient of variation were estimated as described by Singh and Chaudhary (Reference Singh and Chaudhary1979). Broad-sense heritability was estimated for both phytic acid and InP contents according to the method described by Falconer (Reference Falconer1989).
Results
A total of 40 cultivated groundnut genotypes were used to estimate the PAP and InP contents during the rainy season (June to September) for two consecutive years. The results indicated significant (P= 0.01) differences among the genotypes for both the traits and the years. These genotypes were more variable for PAP than for InP as reflected by the higher genotypic variability and genotypic coefficient of variance for PAP. Additionally, both the traits had a broad-sense heritability of around 50 to 60% (Table 1).
Mean, range, genotypic variance, genotypic coefficient variance and broad-sense heritability for phytic acid phosphorus, inorganic phosphorus and the ratio of inorganic phosphorus to phytic acid phosphorus in groundnut

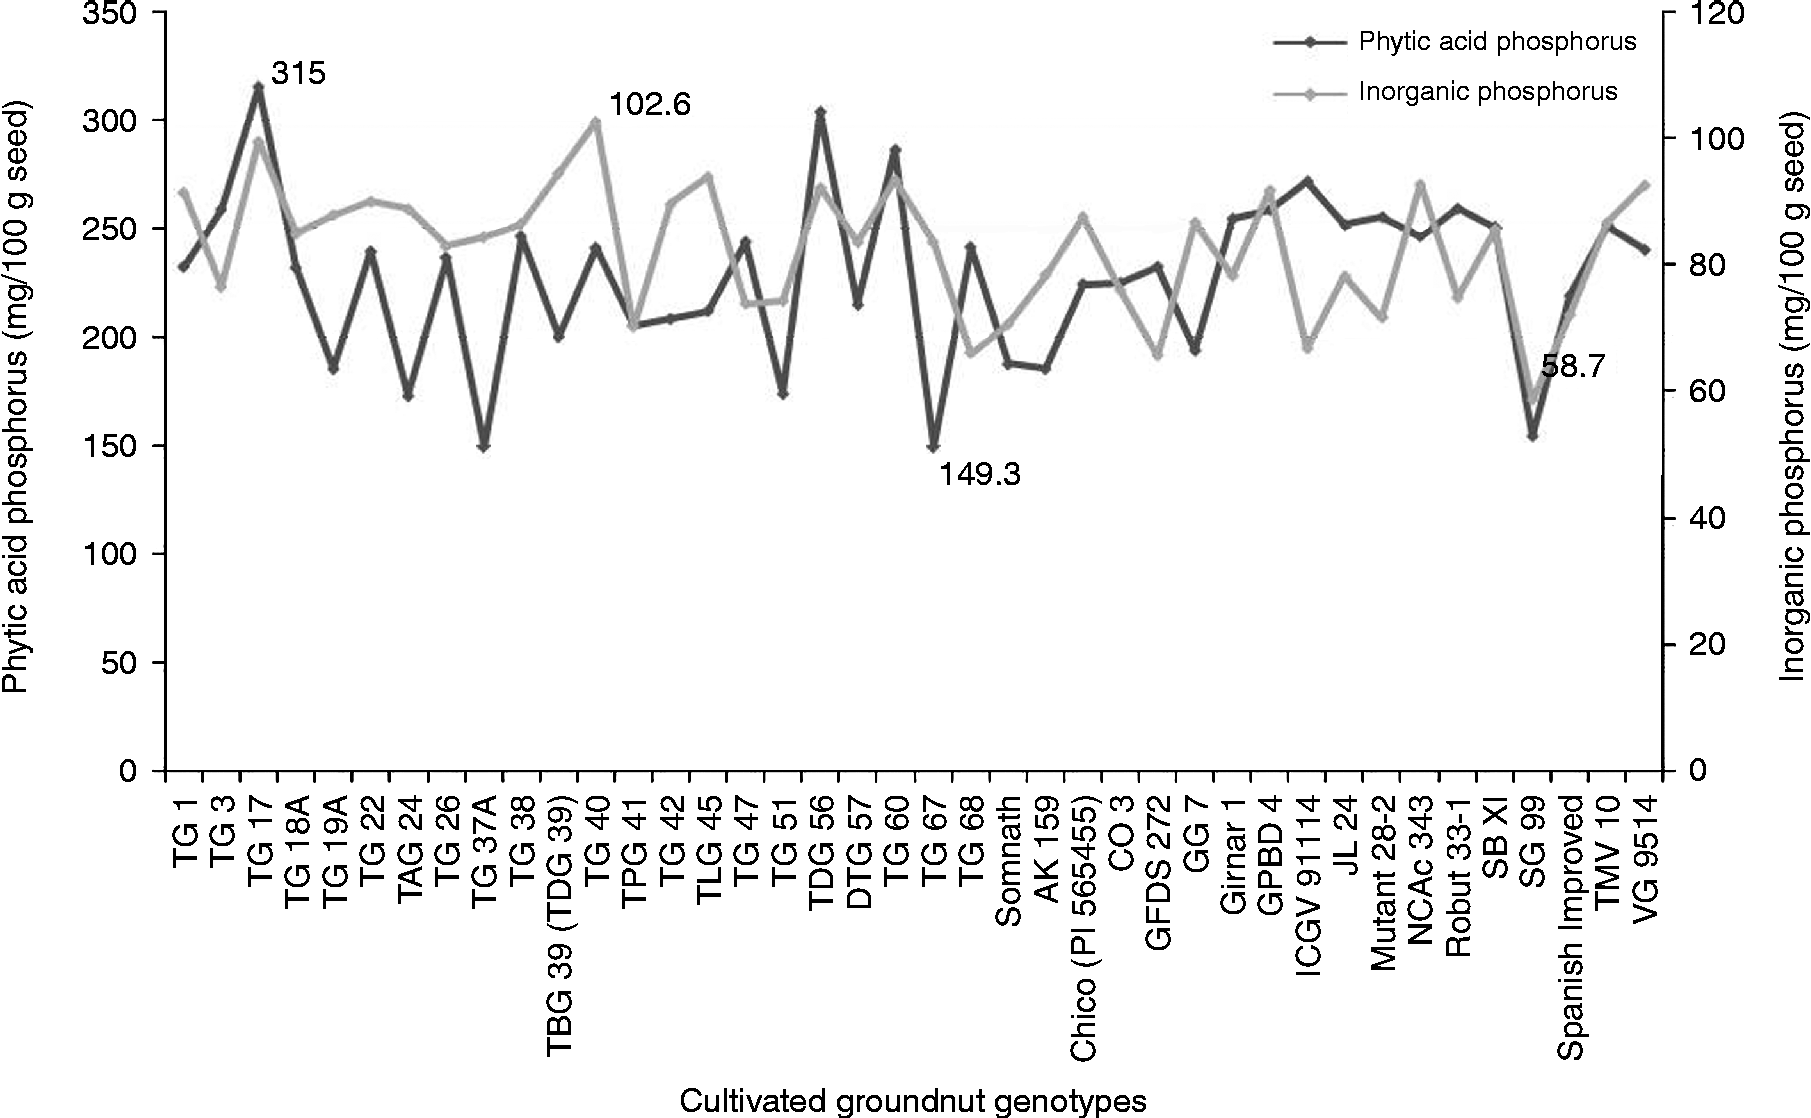
The PAP content varied significantly (P= 0.01) among the genotypes and ranged from 149.3 to 315.0 mg/100 g seed. The genotype TG 67 had the lowest PAP content (149.3 mg) while the genotype TG 17 had the highest PAP content (315 mg) based on the mean over the 2 years (Fig. 1). Among the other Trombay groundnut genotypes, the TAG 24, TG 37A and TBG 39 (TDG 39) genotypes also contained a lower content ( < 181 mg/100 g) and the TDG 56 and TG 60 genotypes contained a higher content (>267 mg/100 g) of PAP (Table S1, available online). The SG 99 and ICGV 91 114 genotypes had lower (154.5 mg/100 g) and higher (271.5 mg/100 g) PAP contents among the non-Trombay groundnut genotypes, respectively. The PAP content was influenced by the environment, as it was evident from a significant genotype × year interaction particularly in the TG 1, TG 17, TG 18A, TG 47, TG 51, TG 60, GG 7, Mutant 28-2, Girnar 1 and GPBD 4 genotypes (Table S1, available online). The InP content among the 40 cultivated groundnut genotypes ranged from 58.7 to 102.6 mg/100 g seed with a mean of 82.6 mg/100 g seed. The SG 99 genotype was found to have the lowest InP content (58.7 mg/100 g seed), whereas the TG 40 genotype had the highest InP content (103 mg/100 g seed) based on the mean over the 2 years (Fig. 1). For the InP content, a significant genotype × year interaction was also observed in most of the genotypes, except in the TG 1, TG 26, TG 37A, TG 38, TG 47, DTG 57, Chico, GFDS 272, ICGV 91, 114, Mutant 28-2 and Robut 33-1 genotypes (Table S1, available online).
Variation of phytic acid phosphorus and inorganic phosphorus in the 40 cultivated groundnut genotypes.
In order to reduce the undesirable effects of phytic acid and further phosphorus supplementation, it would be prudent to identify the genotypes containing reduced phytic acid and increased InP contents in their seeds. Accordingly, the ratio of InP to PAP (InP:PAP) was estimated among the genotypes. Based on the mean over the 2 years, the InP:PAP ratio among the 40 cultivated groundnut genotypes ranged from 0.24 to 0.56 (Table S1, available online). Among these, a higher mean ratio was found in the TAG 24, TG 37A, TG 51 and TG 67 genotypes by virtue of the reduced PAP content and also found in the TKG 19A, TBG 39 (TDG 39) and GG 7 genotypes due to the increased InP content.
Discussion
In groundnut seeds, most of the InP contents are converted into phytate phosphorus during storage. Thus, only a decreased InP content present in the seed is available for food and feed consumption, and although there is an increased phytate content in the seed, it is not digestible by monogastric animals. The present study revealed that the cultivated groundnut genotypes on an average contained 227.6 mg PAP/100 g seed (73.4% of total phosphorus) and 82.6 mg InP/100 g seed. Most of the crop species store a greater amount (60–90%) of phosphorus in the form of phytic acid in their seed (Raboy et al., 2000; Wilcox et al., Reference Wilcox, Premachandra, Young and Raboy2000). In this study, PAP was measured by the modified colorimetric method with Wade reagent. The principle of this assay relies on the decrement of the colour of iron-sulfosalicylic acid due to the binding of iron to the phosphate of phytic acid. Although we measured the PAP content in the assay, the data can be easily extrapolated to the phytic acid content in groundnut by multiplying a factor of 100/18.38 (as phytate content contains 18.38% of phosphorus) with the PAP value. According to this principle, the phytic acid content in the cultivated groundnut genotypes varied from 812.3 to 1713.8 mg/100 g seed (equivalent to 149.3–315.0 mg PAP/100 g seed). The phytic acid content in the cultivated groundnut genotypes was found to be higher than that in other cereals but almost equal to that in natural soybean genotypes. Among the cereals, the phytic acid content ranged from 720 mg/100 g seed in wheat to 1020 mg/100 g seed in maize, while in legumes, it ranged from 420 mg/100 g seed in cowpea to 1430 mg/100 g seed in soybean (Hidvegi and Lasztity, Reference Hidvegi and Lasztity2002). In barley, the content of phytic acid in their seed ranged from 49 mg/100 g in low-phytate barley mutants to 646 mg/100 g seed in wild types (Kvasnička et al., Reference Kvasnička, Čopíková, Ševčík, Václavíková, Synytsya, Vaculova and Voldrich2011). Similarly, a very low amount of InP (50 mg/100 g) was observed in wild or natural genotypes of soybean as against a higher amount (500 mg/100 g) in low-phytic acid mutants of soybean (Gao et al., Reference Gao, Shang, Saghai Maroof, Biyashev, Grabau, Kwanyuen, Burton and Buss2007). The present study revealed a moderate variation of InP among the cultivated groundnut genotypes, and this variation is in accordance with the InP content found in mungbean (Sompong et al., Reference Sompong, Kaewprasit, Nakasathien and Srinives2010). In the present study, a correlation between the PAP and InP contents was not found to be significant among the genotypes. Some of the earlier studies conducted in soybean and maize also did not find an association between the PAP and InP contents (Israel et al., Reference Israel, Kwanyuen and Burton2005; Chiangmai et al., Reference Chiangmai, Yodmingkhwan, Nilprapruck, Aekatasanawan and Kanjanamaneesathian2011). However, strong reciprocal relationships between the InP and PAP contents have been observed in parents and low-phytate mutants of maize, barley, rice, soybean and pea seeds (Ertl et al., Reference Ertl, Young and Raboy1998; Larson et al., Reference Larson, Young, Cook, Blake and Raboy1998, Reference Larson, Rutger, Young and Raboy2000; Wilcox et al., Reference Wilcox, Premachandra, Young and Raboy2000; Liu et al., Reference Liu, Xu, Ren, Fu, Wu and Shu2007; Warkentin et al., Reference Warkentin, Delgerjav, Arganosa, Rehman, Bett, Anbessa, Rossnagel and Raboy2012). The PAP content was reduced in those low-phytate mutants with an equivalent increase in InP content in their seed, which was attributed to mutations in the biosynthetic pathway of phytic acid leading to this association. Since reports on phytic acid and InP contents in groundnut are lacking, the present study facilitated to assess the genetic variability of phytic acid and InP contents in the seeds of cultivated groundnut genotypes. In general, groundnut contains a higher phytic acid content compared with wheat, maize and barley, and a lower InP content compared with pigeonpea, chickpea, urdbean and soybean. Mutation and other breeding efforts are needed to reduce the PAP content and to increase the availability of InP content in groundnut. Furthermore, this study would also open up the possibility of genetic study on phytic acid content and on breeding efforts for a high InP content in groundnut.
Supplementary material
To view supplementary material for this article, please visit http://dx.doi.org/10.1017/S1479262113000130
Acknowledgements
The authors thank Sujit Tota, T. Chalapathi and R. K. Sachan at the Nuclear Agriculture and Biotechnology Division for their technical assistance.