NOMENCLATURE
- D
-
dimple print diameter
- H
-
channel height
- k
-
turbulent kinetic energy
- L
-
dimpled domain length
- Nu
-
Nusselt number
- Pr
-
Prandtl number
- Re H
-
Reynolds number based on bulk velocity and channel height
- ReΠ
-
Reynolds number based on friction velocity and channel half height
-
 $u_{{}_\Pi }$
-
equivalent friction velocity
- W
-
dimpled domain width
- δ
-
dimple depth
- ε
-
turbulent kinetic energy dissipation rate
- ν
-
molecular viscosity
- b
-
bulk quantity
- EVM
-
linear Eddy viscosity model
- NLEVM
-
Non-Linear Eddy viscosity model
- RANS
-
Reynolds averaged Navier-Stokes
- RSM
-
Reynolds stress model

Greek Symbol
Subscripts
Acronyms/Abbreviations
1.0 INTRODUCTION
Gas turbines are widely used for power generation, aircraft propulsion and various other industrial applications. As the emissions regulations become more stringent, the need for optimised, highly efficient, gas turbine systems becomes more pressing.
The thermal efficiency of gas turbines can be improved by increasing the inlet-to-outlet temperature ratio over the turbine section. However, higher turbine inlet temperatures will also increase heat transfer to the blades and might severely reduce the blade material durability. In reality, turbines operate at temperatures far above those allowed by the blade metal. This has been made possible by using sophisticated cooling techniques to ensure that blade temperatures do not exceed the metal limits, while using as little coolant as possible. Many research efforts in blade cooling thus focus on refining these techniques to allow even higher turbine inlet temperatures(Reference Han, Dutta and Ekkad1).
In the context of these efforts, spherical concavities, or dimples, have received increased attention in the past decade as a way of providing a reasonable heat transfer enhancement for a relatively low pressure loss. Dimples enhance heat transfer by aiding large-scale mixing and breaking the boundary-layer development, due to flow separation and reattachment in the cavity and the formation of vortex cells within the dimple.
Using the naphthalene sublimation technique, Kwon et al(Reference Kwon, Hwang and Cho2) studied the heat/mass transfer over a single dimple in a channel with dimple depth to channel height ratio range of δ/H = 0.2–0.4 and for a range of Reynolds numbers, Re H = 500–5,000, covering the laminar, transitional and turbulent flow regimes. They used flow visualisation to analyse the flow structures present in the laminar regime, and reported that the main flow separates over the dimple upstream edge and then impinges on the rear rim of the cavity. Following the impingement, the flow splits into two parts, one of which continues moving downstream while the other recirculates upstream along the dimple curvature. The recirculating flow creates a pair of symmetric vortex cells that fill the dimple, which are periodically ejected and re-formed, producing an unsteady cycle of vortex formation, growth and shedding. In the turbulent regime, the authors reported that the heat transfer enhancement increased with dimple depth (δ).
In a series of studies, Isaev et al(Reference Isaev, Leontev and Baranov3-Reference Isaev, Leont’ev, Baranov and Pyshnyi7) performed Reynolds Averaged Navier-Stokes (RANS) based simulations of turbulent flow over a single dimple, reporting that heat transfer enhancement increased slowly, almost linearly with Reynolds number, and also increased with dimple depth. For dimple depths below δ/H = 0.62 (corresponding to δ/D ~ 0.2), they reported the existence of a steady double vortex cell structure within the dimple, although for deeper dimples the flow patterns deviated from this in favour of an asymmetric, mono-core vortex cell inclined by ±45° to the flow direction. The existence of asymmetric structures over deep dimples was also reported in a Large Eddy Simulation (LES) by Kornev et al(Reference Kornev, Turnow, Hassel, Isaev, Wurm, Deville, Lł and Sagaut8). They found, in a series of short-term time averaged flow field snapshots, that the vortex structure switched direction periodically between −45° and +45°. Thus, contrary to URANS of Isaev et al(Reference Isaev, Leont’ev, Baranov and Pyshnyi7), the long-term time averaged flow field was nearly symmetric. This conclusion was later confirmed in an experimental study by Voskoboinick et al(Reference Voskoboinick, Kornev and Turnow9).
For the case of a staggered array of dimples, Lin et al(Reference Lin, Shih and Chyu10) studied the flow structure using the RANS approach. They identified two ways for the two dimple vortices to convect downstream, a zig-zag flow pattern from one cavity to another over the surface, or a jet-like burst from the downstream part of the dimple. These flow patterns were also observed in the Direct Numerical Simulation (DNS) reported by Wang et al(Reference Wang, Yeo and Khoo11).
Mahmood et al(Reference Mahmood, Moon, Glezer, Hill, Nelson and Ligrani12) conducted an experiment to investigate the heat transfer characteristics over such surfaces for a range of Reynolds numbers. They found that the overall heat transfer enhancement level was fairly independent of Reynolds number. However, as Re increased, the separation area within the dimple decreased, thus shifting the local heat transfer minimum upstream.
Ligrani et al(Reference Ligrani, Harrison, Mahmmod and Hill13) found that with increasing Reynolds number, the secondary vortices, at the dimple span-wise edge, stretch farther away from the dimple edge, and thus, are convected to the neighbouring dimples on the diagonal just downstream.
The effect of channel height (H) on heat transfer was investigated by Mahmood and Ligrani(Reference Mahmood and Ligrani14). They argued that decreasing H leads to stronger vortices over the dimples which in turn enhances heat transfer augmentation. However, an earlier study by Moon et al(Reference Moon, O’Connell and Glezer15) found that the normalised Nusselt number and friction factors were relatively independent of channel height.
Burgess et al(Reference Burgess, Oliveira and Ligrani16) and Burgess and Ligrani(Reference Burgess and Ligrani17) reported, in experimental studies, that increasing dimple depth in an array also creates stronger and intensified vortices, leading to an enhancement in relative heat transfer (i.e. relative to that of a flat plate). However, the friction factor will also increase, creating more pressure losses. Won and Ligrani(Reference Won and Ligrani18) confirmed these conclusions in a RANS simulation.
The present study uses the RANS approach to model the flow and heat transfer over a single dimple and a staggered array of dimples. While the overwhelming majority of the previous RANS studies do not go beyond the linear eddy viscosity modelling approach, the current investigation uses three classes of low-Reynolds-number RANS models to represent the turbulence. The aim is to build on the previous knowledge through exploring to what extent each modelling approach can accurately reproduce the reported flow and heat transfer behaviours. Two cases have been considered in the present work. These include the study of a single dimple and a dimple array on one wall in a channel. A summary of the most important dimple and channel geometry factors is given in Table 1.
Summary of the non-dimensional geometry cases

2.0 CURRENT MODELLING APPROACH
The combination of flow features present in dimples makes for a challenging task, for any turbulence model, to accurately predict the dynamic and thermal fields in these flows. Thus, employing higher order turbulence closures could prove to be beneficial.
A systematic study of three modelling strategies within the RANS approach has been carried out. These include a linear Eddy Viscosity Model (EVM), a Non-Linear Model (NLEVM) and a Reynolds Stress transport Model (RSM).
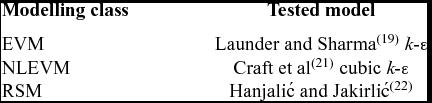
As a linear eddy viscosity model, the Launder and Sharma(Reference Launder and Sharma19) k-ε scheme, with the near-wall lengthscale correction term from Yap(Reference Yap20), has been used. The cubic non-linear EVM of Craft et al(Reference Craft, Launder and Suga21) has also been tested, as has the stress transport model of Hanjalić and Jakirlić(Reference Hanjalić, Jakirlić, Launder and Sandham22). The low-Reynolds number form of each model was exclusively used. Table 2 shows a summary of the tested models and the different modelling classes they belong to.
Tested models and their modelling classes

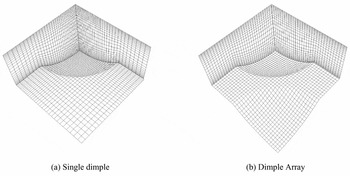
The simulations have been carried out using the finite-volume-based STREAM code(Reference Lien and Leschziner23), with the SIMPLE pressure correction algorithm. The second order accurate UMIST scheme of Lien and Leschziner(Reference Lien and Leschziner24) has been used to approximate the convection terms for the velocity and pressure correction equations, while the convection of turbulent quantities has been discretised using the first order accurate UPWIND scheme. The meshing strategy has been taken from Wang et al(Reference Wang, Yeo and Khoo11), where a simple structured grid was first created to fit the channel section and then stretched in the wall-normal direction to fill up the dimple volume. Figure 1 shows the computational grids used for the tested cases. As can be seen from the figure, the meshes have been refined near walls to ensure a value of y + less than unity. Grids of up to around two million cells have been used with 2.4 m cells used for the single dimple case and 1.8 m cells for the dimple array case. Tests have been carried out to ensure the mesh density was sufficient to fully resolve the flow field and achieve grid independent solutions.
The computational grid for both geometry cases.

3.0 FLOW OVER A SINGLE DIMPLE
The natural starting point for this investigation is to study the flow over a single dimple in a channel. This serves as a first step in exploring the best way to tackle more realistic and complex geometry configurations.
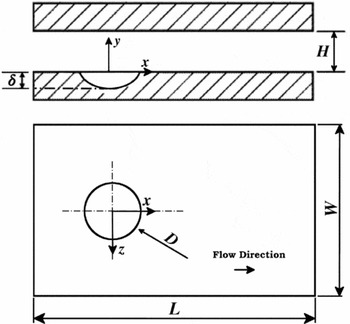
The case considered here is that studied experimentally by Kwon et al(Reference Kwon, Hwang and Cho2). The experimental data was reported at a Reynolds number, based on bulk velocity and channel height, of Re H = 5,000 with a dimple print diameter to channel height ratio of D/H = 2.0 and a ratio of dimple depth to channel height of δ/H = 0.4. The Prandtl number was taken to be Pr = 0.71. A schematic of the tested domain is shown in Fig. 2, with W/H = 8 and L/H = 16.
Schematic of the single dimple test channel.

At the inlet, fully-developed channel flow profiles have been provided for the dynamic field quantities, whilst a uniform temperature has been assigned. Zero gradient conditions have been applied to all variables except pressure at the outlet, with a bulk mass-correction algorithm employed to speed up convergence. The no-slip condition has been enforced on both walls, with two thermal boundary conditions tested. In the first, a uniform heat flux was imposed on the dimpled surface, while in the second, the dimpled wall was set at a constant temperature higher than that of the fluid. In both cases, the upper wall was treated as adiabatic. At the span-wise (z-direction) boundaries, periodic conditions have been applied. It is worth noting that the size of the domain is large enough for the boundary conditions not to have an effect on the dimple region.
The experiments reported that no dominant frequencies were found in the frequency spectrum which suggests that no large-scale unsteadiness was detected. Thus, the main simulations for this case have been conducted as steady state. To test the validity of this assumption, a time dependent simulation has been carried out using the Launder and Sharma(Reference Launder and Sharma19) k-ε model without the Yap(Reference Yap20) lengthscale correction term. The simulation resulted in a steady state solution, and thus the steady RANS approach has been deemed suitable for this case.
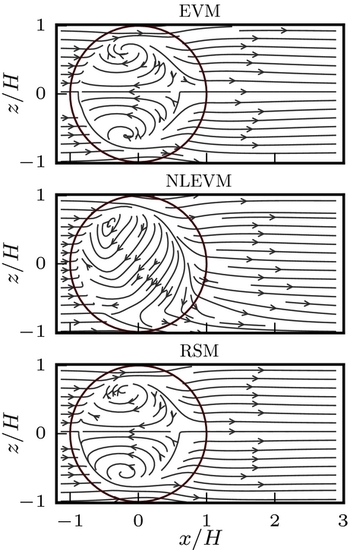
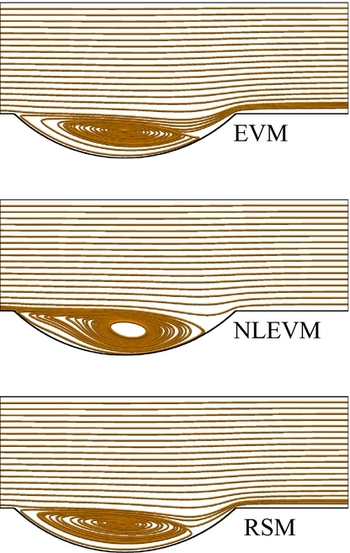
Figure 3 shows the near-wall streamlines predicted in the present study. It can be seen that all models successfully capture the formation of the dimple’s vortices, with the linear EVM and RSM predicting a pair of symmetric vortices. This vortex pair forms due to flow recirculation upstream along the dimple curve, following its impingement on the dimple downstream half. These structures tie in nicely with the flow patterns reported by Kwon et al(Reference Kwon, Hwang and Cho2) and Isaev et al(Reference Isaev, Leontev and Baranov3) in the laminar and turbulent flow regimes, respectively.
Stream traces on a curved surface close to the dimpled wall.

The NLEVM, on the other hand, predicts a single asymmetric vortex cell that is inclined to the flow direction by nearly 45°. This is similar to the features reported by Isaev et al(Reference Isaev, Leontiev, Kudryavtsev and Pyshnyi6), however, for much deeper dimple depths (δ/H > 0.628). To investigate this further, another simulation has been conducted using the NLEVM for a shallower dimple depth of δ/H = 0.2 with the other geometric factors being the same. In this case, the model does predict a symmetric pair of vortices, in line with other model predictions, which could lead to the conclusion that the non-linear model may have amplified the effect of dimple depth.
One can clearly see from Fig. 4 that all models return more or less the same position for the reattachment point within the dimple, with a slightly thicker recirculation region predicted by the NLEVM.
Stream traces across the centreline of the dimple at z = 0.0.

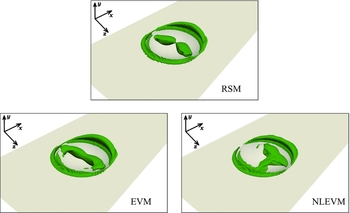
Figure 5 shows an iso-surface of the Q-criteria within the dimple. The figure emphasises the previous conclusion with both the EVM and RSM returning symmetric coherent structures within the dimple, while the NLEVM produces an asymmetric one.
Q-criteria iso-surface (Q = 0.2) for the single dimple case with δ/H = 0.4 and D/H = 2.0.

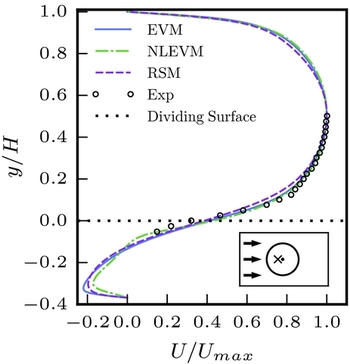
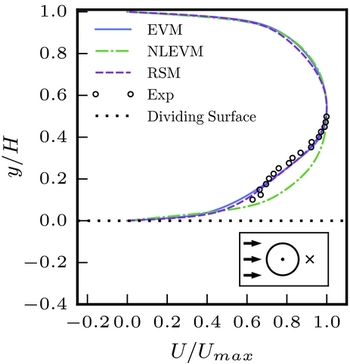
The velocity profiles, in Figs 6 and 7, are in general good agreement with the experimental data reported by Kwon et al(Reference Kwon, Hwang and Cho2). However, in Fig. 6, the measured data does not extend far into the dimple region where the model predictions start to deviate from each other. The figure shows that all models predict similar velocity profiles over the dimple until just under the dividing surface (between the channel section and the dimple, at y/H = 0.0) with a steep velocity gradient above and across the upper part of the dimple. Further in the dimple, the NLEVM shows slightly different behaviour, at least partly as a result of the different flow field (asymmetric vortex) predicted by the model. The differences in prediction between the models become more clear in the wake of the dimple, Fig. 7, where the NLEVM asymmetric flow pattern shifts the wake flow away from the dimple centreline and off the sampling point.
Profiles of the stream-wise velocity, U, at a point on the centreline in the upstream half of the dimple, (x, z) = (− 0.15D, 0.0), as indicated by the cross on the schematic, compared to the experimental data reported by Kwon et al(Reference Kwon, Hwang and Cho2).

Profiles of the stream-wise velocity, U, at a point on the centreline in the wake of the dimple, (x, z) = (0.85D, 0.0), as indicated by the cross on the schematic, compared to the experimental data reported by Kwon et al(Reference Kwon, Hwang and Cho2).

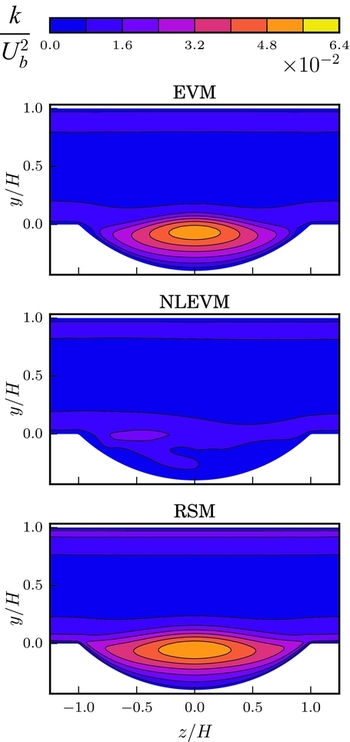
The contours of the turbulent kinetic energy over the dimple, in Figs 8 and 9, show that the peak levels of k occur in the shear layer and close to the impingement region around the dimple rear rim. The asymmetric flow pattern of the NLEVM model is clearly visible in the cross-stream plane and the model generally returns lower levels of k.
Contours of the turbulent kinetic energy across the dimple centreline at z = 0.0.

Contours of the turbulent kinetic energy in the cross-stream plane at x = 0.0.

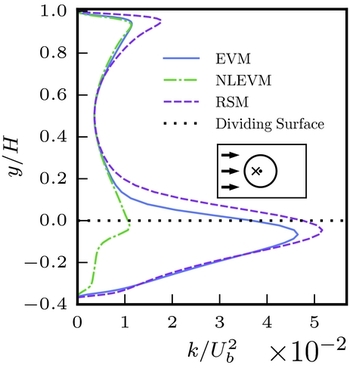
Furthermore, it can be seen from Fig. 10 that all models, apart from the NLEVM, predict a high peak k level to occur close to the dividing surface between the dimple and the channel, partly as a result of the steep velocity gradients occurring across the separated shear layer in this region. The lower levels of k predicted by the NLEVM are also clear in this figure.
Profiles of the turbulent kinetic energy k at a point on the centreline in the upstream half of the dimple, (x, z) = (− 0.15D, 0.0), as indicated by the cross on the schematic.

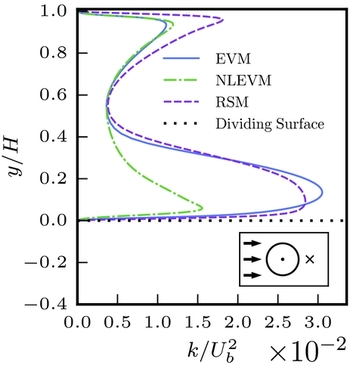
After the dimple, as shown in Fig. 11, the same pattern persists. Tests indicated that this difference in behaviour is mainly due to the form of the c μ coefficient used in the turbulent viscosity formulation of the NLEVM, rather than the non-linear terms appearing in its stress-strain relation. In this case, c μ is taken as a function of local strain rate and reduces significantly in regions of high strain (such as the separated shear layer), resulting in lower turbulent viscosity and turbulent kinetic energy levels.
Profiles of the turbulent kinetic energy k at a point on the centreline in the wake of the dimple, (x, z) = (0.85D, 0.0), as indicated by the cross on the schematic.

Reported u′ levels by Kwon et al(Reference Kwon, Hwang and Cho2) suggest that the NLEVM slightly under-predicts, and other models over-predict, k levels in the dimple, while all models under-predict k in the dimple wake region.
Finally, the Reynolds stress anisotropy does not seem to be a major factor in the flow field prediction in this case. Hence, the use of the linear stress-strain relation (Boussinesq approximation) did not hinder the performance of the EVM.
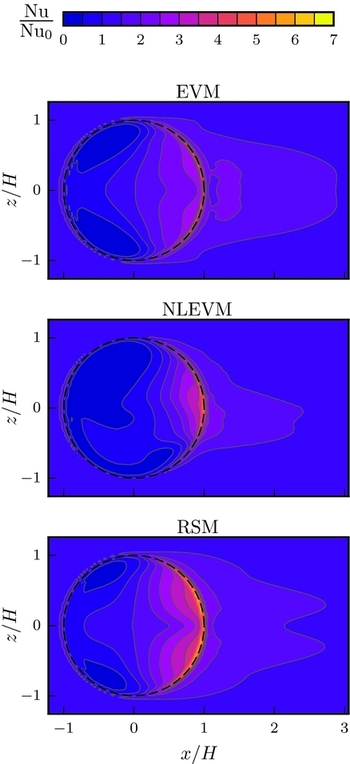
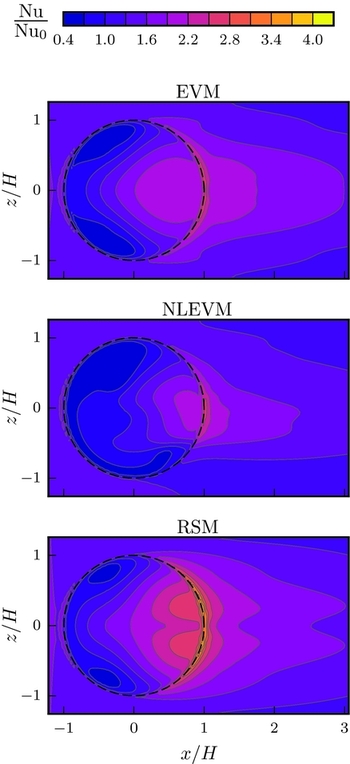
The disparity in flow structures predicted by the models is also reflected in the contours of the Nusselt number shown in Figs 12 and 13. These figures show that, for both wall boundary conditions, the symmetric flow field predicted when using the EVM and RSM leads, expectedly, to symmetric distribution of Nusselt number contours, with the highest levels of heat transfer enhancement being located in the dimple downstream half, where the flow impinges on the dimple surface. The NLEVM model, however, shows asymmetric contours of Nu with a peak location that does not coincide with the flow impingement zone. A reduction in heat transfer is also evident in the upstream part of the dimple.
Contours of the Nusselt number at the dimpled wall normalised by that of a plane channel, for the case of a constant temperature wall thermal boundary condition.

Contours of the Nusselt number at the dimpled wall normalised by that of a plane channel, for the case of a constant heat flux wall thermal boundary condition.

It is worth noting that for a constant temperature wall boundary condition, as shown in Fig. 12, the contour lines of the Nusselt number extend further in the lateral direction when compared to those of the constant heat flux case, as shown in Fig. 13. This is consistent with experimental findings reported by Kwon et al(Reference Kwon, Hwang and Cho2) (for the constant temperature BC case) and Mahmood et al(Reference Mahmood, Moon, Glezer, Hill, Nelson and Ligrani12) (for the constant heat flux case).
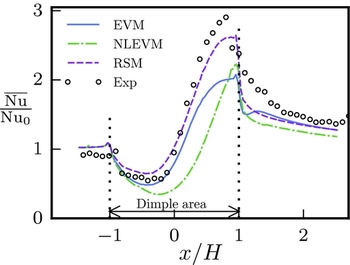
Figure 14 shows profiles of the span-wise averaged Nusselt number for the constant temperature case, with the averaging carried out over the area shown in the contour plot, Fig. 12, and the resulting averaged Nu normalised by that of a plane channel. The figure shows that the model predictions are generally in good qualitative agreement with the experimental data in the sense that all models reproduce the reduction in the upstream half of the dimple as well as the significant heat transfer enhancement in the downstream part. It can also be seen from Fig. 14 that the RSM outperforms the other two models as it provides a quantitative prediction of Nu, in the dimple area, that is more inline with the levels reported in the experiment.
The span-wise averaged Nusselt number, normalised by that of a plane channel, compared to the experimental data reported by Kwon et al(Reference Kwon, Hwang and Cho2).

4.0 FLOW OVER AN ARRAY OF DIMPLES
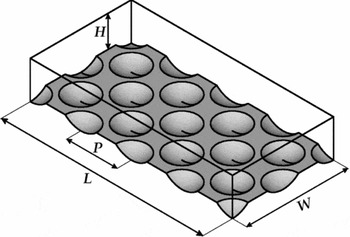
The case considered is based on the DNS performed by Wang et al(Reference Wang, Yeo and Khoo11). The geometry of the tested channel is shown in Fig. 15 where, in this case, W/H = π, L/H = 2π. The dimple surface geometry factors were taken as: P/H = π/2, D/H = 1.0 and δ/H = 0.2.
Schematic of the dimple array.

The flow was driven by a fixed stream-wise mean pressure gradient (Π). The Reynolds number,
 ${\rm Re}_{{}_\Pi } = {0.5 u_{{}_\Pi } \, H}/{\nu }$
, is taken as 180, to match the DNS data, where
 $u_{{}_\Pi }$
is a velocity scale defined as
 $u_{{}_\Pi }=\sqrt{{0.5 \Pi \, H}/{\rho }}$
, corresponding to the usual friction velocity in a plane channel case. The Prandtl number is taken as 0.71. Periodic boundary conditions were applied for all transported quantities in both the stream- and span-wise directions. On the walls, the no-slip condition was enforced with a uniform heat flux boundary condition applied on the dimpled surface, while the upper wall was considered adiabatic.
Unlike in the single dimple case, no information about the flow field statistical steadiness, or lack of, can be easily inferred from the study of Wang et al(Reference Wang, Yeo and Khoo11). Moreover, Ligrani et al(Reference Ligrani, Harrison, Mahmmod and Hill13) and Won et al(Reference Won, Zhang and Ligrani25) have reported, through flow visualisation in a similar set-up to the one described here, that the main vortex pair formed within the dimple is shed periodically from the cavity. This suggests that the presence of a large scale unsteadiness may be likely for this case. Thus, time-dependent simulations were conducted to investigate the flow in this case, with the timestep taken small enough to ensure CFL numbers less than unity. The EVM and the RSM converged to steady state solutions from which the results below are presented. As for the NLEVM, the predicted flow field remained unsteady, and thus, the long-term temporal averages are presented here.
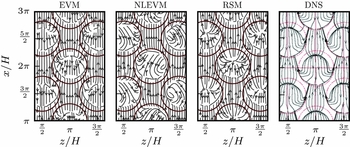
Figure 16 shows the near-wall streamlines, over a curved surface parallel to the dimpled wall. It can be seen (similarly to what was described in the single dimple case) that both the EVM and RSM still maintain the symmetric structures, similar to those of the DNS, in the dimples, while the NLEVM predicts an asymmetric, single vortex cell instead. However, it is worth noting that in the flow field predicted by the non-linear EVM, the inclination of these asymmetric vortices changes direction, from −45° to 45° and vice versa, from one row of dimples to the following. This alternating inclination of vortices is also clearly visible in the instantaneous flow field, forcing the flow out of the dimple to follow the side of the vortex inclination. This leads to the formation of neighbouring fast and slow flow lanes where the former appear on the sides of the dimples where shedding occurs and the latter lanes on the opposite sides.
Stream traces on a curved surface close to the dimple array. DNS data reported by Wang et al(Reference Wang, Yeo and Khoo11).

In Fig. 17, the profiles of
 $U^+=U/u_{{}_\Pi }$
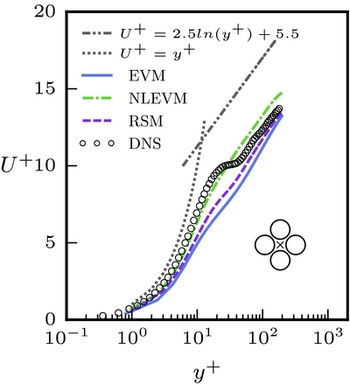
are shown at the symmetry point between the dimples. From the DNS data, one can clearly see that the viscous sub-layer and a log-law region (albeit below the usual log-law line) remain present near the dimpled wall. However, they are separated by a buffer region where the velocity gradient is sharply reduced. The RSM clearly reproduces all three regions in its profile, but significantly over-predicts the U
+ gradient in the buffer region. The NLEVM captures the general level of U
+ but fails to produce the buffer region. This could be due to the fact that, with the asymmetric shedding described previously, the sampling point plotted is no longer in the wake of the dimple shedding. The profiles predicted by the EVM show a slender buffer region, but it also significantly over-predicts the U
+ gradient in the buffer region and slightly under-predicts the U
+ level in the log-law region.
Profiles of the stream-wise velocity, U +, at the symmetry point between dimples, compared to DNS data reported by Wang et al(Reference Wang, Yeo and Khoo11).

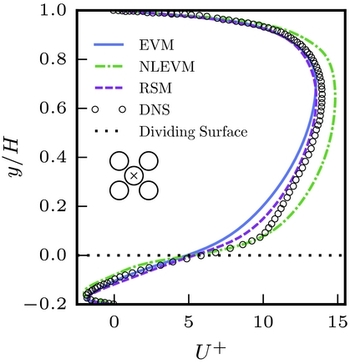
Through the dimple’s centre, as shown in Fig. 18, all model predictions are generally in good agreement with the DNS data, particularly in the recirculation region. The NLEVM extends this good agreement further across the shear layer, while the other two models better match the DNS in the remaining part of the channel.
Profiles of the mean stream-wise velocity, U +, through dimple centre, compared to DNS data reported by Wang et al(Reference Wang, Yeo and Khoo11).

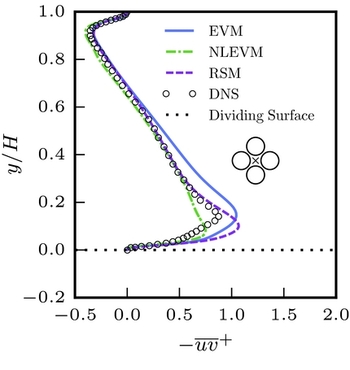
Figure 19 shows profiles of the turbulent shear stress,
 ${\overline{uv}}^+ = \overline{uv}/{u^2_{{}_\Pi }}$
, at the symmetry point between the dimples. Results from all the models show an increase in the value of
 ${\overline{uv}}^+$
near the dimpled wall compared to that of a plane channel. The EVM tends to over-predict the values of
 ${\overline{uv}}^+$
in this region, while the results from the NLEVM and RSM better match the levels reported by the DNS across most of the channel. However, near the wall, the NLEVM slightly under-predicts the peak
 ${\overline{uv}}^+$
magnitude, while the RSM overpredicts it.
Profiles of the turbulent shear stress,
 ${\overline{\hbox\textit{uv}}}^+$
, at the symmetry point between dimples, compared to DNS data reported by Wang et al(Reference Wang, Yeo and Khoo11).

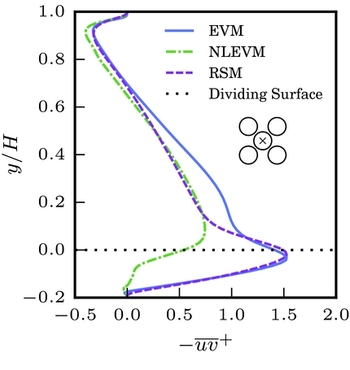
In Fig. 20, the profiles of the turbulent shear stress through a dimple centre are shown. It can be seen that the NLEVM returns significantly lower levels of turbulence within the dimple area and across the shear layer compared to the other two models. The EVM and RSM give similar peak levels of
 ${\overline{uv}}^+$
and, in general, predict increased turbulence levels within the dimple.
Profiles of the turbulent shear stress
 ${\overline{\hbox\textit{uv}}}^+$
through dimple centre.

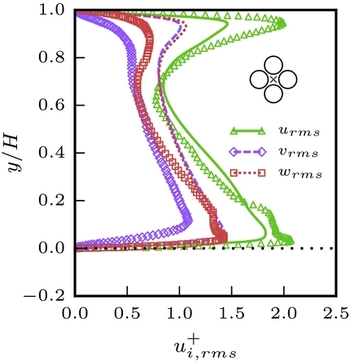
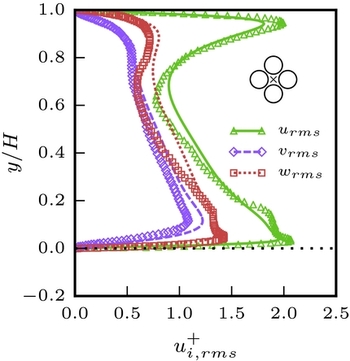
Figures 21 and 22 show the turbulent normal stresses at the symmetry point between dimples predicted by the NLEVM and the RSM, respectively. Both models return the correct stress distribution with the RSM, expectedly, outperforming the NLEVM when it comes to quantitative comparison with DNS. The EVM predictions were not included here since the model produces a nearly isotropic normal stress distribution in this case. This stems from a well-known deficiency in the Boussinesq approximation which underpins all linear eddy viscosity models.
Comparison between the NLEVM predicted turbulent normal stresses (lines) and DNS data (symbols) at the symmetry point between dimples. DNS data was taken from Wang et al(Reference Wang, Yeo and Khoo11).

Comparison between the RSM predicted turbulent normal stresses (lines) and DNS data (symbols) at the symmetry point between dimples. DNS data was taken from Wang et al(Reference Wang, Yeo and Khoo11).

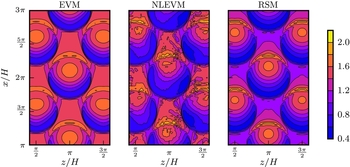
Contours of the Nusselt number over the dimpled wall, normalised by that of a plane surface at the same Reynolds number, are shown in Fig. 23. Similarly to the discussion in the single dimple case, the models predict increased values of the Nusselt number in the downstream half of the dimples, where the flow impinges on the dimpled wall. Moreover, all models show reduced levels of Nu in the upstream part of the dimple due to flow separation. Following their predicted flow fields, the EVM and RSM report a symmetric distribution of the Nusselt number on the dimple surface, while the NLEVM returns an asymmetric Nu distribution, due to the inclined vortex structure predicted in the dimple. On average, all models report an enhancement in Nusselt number levels, up to twice or more than that of a plane channel in parts of the dimpled wall. However, reduction in heat transfer over the upstream part of the dimples is also evident.
Contours of the Nusselt number across the dimple array normalised by that of a plane channel.

5.0 CONCLUSIONS
The RANS approach has been used to investigate the flow over a single dimple and an array of dimples. A number of RANS models have been tested spanning different closure approaches.
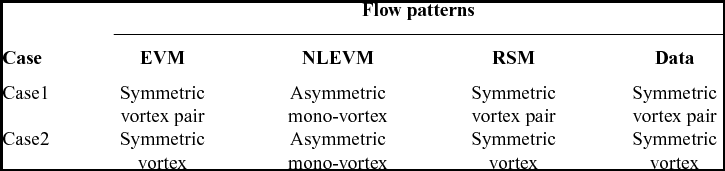
The EVM and RSM predicted the formation of symmetric vortex cells that fill the separation zone in the upstream part of the dimple, while the NLEVM showed a single, asymmetric, vortex in the separation area of the dimple with much lower levels of turbulence predicted in general. Table 3 gives a summary of flow patterns predicted by all models.
Flow characteristics as predicted by all models and data

Comparison with the experimental and DNS data shows that low-Re RANS models of three different types have been able to reproduce the main features of the flow over dimpled surfaces. Nevertheless, from the presented analysis, one can conclude that using a relatively advanced RSM, such as the Hanjalić and Jakirlić(Reference Hanjalić, Jakirlić, Launder and Sandham22) model, results in the most reliable predictions. This, however, comes at the price of an increased computational cost as well as a deterioration in the numerical stability of the simulation since RSM’s can be more difficult to converge, compared to eddy viscosity models.
On the other hand, using an eddy viscosity model, in either the linear or non-linear variety, may seem to yield a reasonable compromise between accuracy, stability and computational cost. However, with EVM’s, there will always be a risk of the simulation arriving at a flow pattern other than the one physically expected (e.g. established through an experiment or a high fidelity simulation) as is the case with the NLEVM predictions in the present work. The NLEVM predictions (the asymmetric flow patterns), while they deviate from those reported in the literature for the tested configurations, they do remain a viable physical and numerical solution to the dimple flow problem, and have been reported by Tay et al(Reference Tay, Chew, Khoo and Zhao26) in a flow visualisation study. Moreover, other RANS-based studies (e.g. Isaev et al(Reference Isaev, Leontiev, Kudryavtsev and Pyshnyi6) with the k-ω SST linear EVM) have also reported asymmetric dimple vortices in dimple configurations where they are not expected. This is particularly interesting since both the chosen NLEVM (Craft et al(Reference Craft, Launder and Suga21) cubic k-ε) and the k-ω SST EVM are formulated to reduce the turbulent viscosity at regions of high strain rates(Reference Craft, Iacovides and Yoon27,Reference Menter28) . Thus, both models tend to reduce the turbulent diffusion in the dimple region, where high strain rates are prevalent, and the computed flows are more likely to become unstable and give rise to the asymmetric dimple vortices.
All models tested were able to reproduce the general heat transfer characteristics associated with the flow over dimples, namely, the reduction in heat transfer in the upstream half of the dimple and the significant heat transfer enhancement in the downstream part.
Further explorations are required to fully understand the flow patterns predicted by the models and how these models would react to changes in the geometrical factors, such as the dimple depth and channel height, as well as how they would perform in more complex cases (e.g. arrays of dimples on both walls with rotation).