Taken as a whole, the depictions of Native American life are arguably the most distorted and contradictory of any large ethnic group in American history. Several centuries ago, accounts of early explorers and missionaries merged with the primitivistic tradition of Western civilization to create an image of the noble savage, who inhabited an ideal landscape and lived in harmony with nature and reason.Footnote 1 During the westward movement of the mid-nineteenth century, whites commonly viewed the Plains tribes as bad Indians—warlike savages who terrorized settlers, stole horses, and practiced barbaric rituals. Near the end of the century, these natives morphed into entertainers who parodied their former lives in Buffalo Bill Cody's Wild West shows. Early in the twentieth century, stories in the Saturday Evening Post and later, western movies, caricatured their habits, customs, and superstitions.Footnote 2 Beginning in the 1960s a wave of publications viewed Native Americans sympathetically, as victims whose peaceful civilizations were decimated by Euro-American aggression and disease. With the rise of the environmental movement, some researchers proclaimed that natives were ecologically sensitive caretakers of their surroundings, and therefore models to emulate for our time.
Faced with these diverse images and meager evidence, how can one discern the truth? How did these Native Americans actually conduct their lives and what was their standard of living? Three recent papers probe the latter issue for the equestrian tribes of the Great Plains using height data originally collected by Boas near the end of the nineteenth century.Footnote 3 Using data on individuals born primarily between 1830 and 1872, these papers establish that the equestrian nomads were taller than any national population living in the mid-nineteenth century—exceeding by roughly one centimeter the next tallest groups, which were European descendents living in America or Australia. Explanations center on a protein-rich diet based on bison, abundant micronutrients from various plant sources and from trade with agricultural tribes, relative equality in access to resources within tribes, and low population density accompanied by frequent movements that reduced exposure to parasites and pathogens.
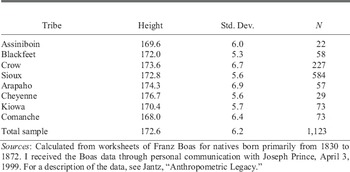
These papers noted but did not attempt to explain large height differences across the tribes. Table 1 shows that Cheyenne men reached 176.7 centimeters, about one centimeter below modern American height standards and nearly 9 centimeters more than the shortest tribe, the Comanche. A difference of this magnitude is large and functionally important, exceeding the increase in average height of native-born American men from the early 1700s to the present.Footnote 4
MEAN HEIGHT IN CENTIMETERS OF ADULT MEN

Sources:
Calculated from worksheets of Franz Boas for natives born primarily from 1830 to 1872. I received the Boas data through personal communication with Joseph Prince, April 3, 1999. For a description of the data, see Jantz, “Anthropometric Legacy.”
Table 1 organizes the tribes by latitude, ranging from the Assiniboin who lived in southern Saskatchewan and in the northern portions of North Dakota and eastern Montana, to the Comanche who were centered in Oklahoma and northern Texas. The tallest tribes (the Arapahoe and Cheyenne) lived near the middle of the Great Plains, in the latitude of Wyoming and Colorado. Because the Plains Indians had similar technologies and life ways, the factors that explain their height advantage over whites contribute little to understanding tribal differences. Study of these large differences sheds light on the biological living standards of a misperceived group in American history and provides insight into ecological and socioeconomic determinants of health and nutrition in both past and present populations.
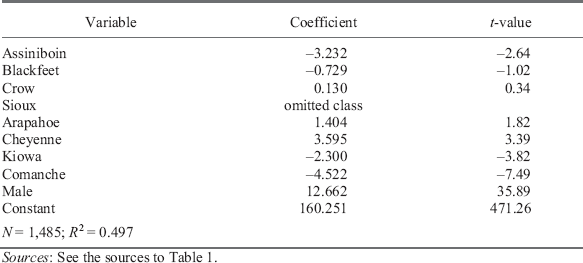
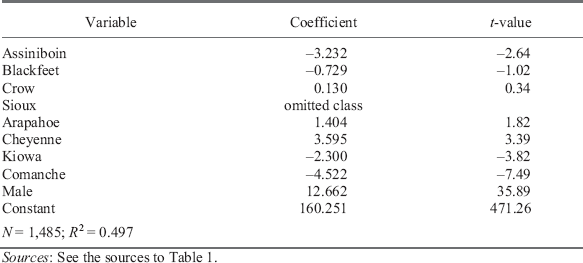
The first task is to determine which tribal differences were statistically significant. Table 2 explains individual heights using sex and dummy variables for tribe, where the Sioux are the omitted class. The Cheyenne were systematically taller (3.6 centimeters), whereas the tribes of the extreme north and south were systematically shorter: the Assiniboin by 3.2 centimeters, the Kiowa by 2.3 centimeters, and the Comanche by 4.5 centimeters. Based on the tribal regression coefficients, the difference between the extremes (Cheyenne versus Comanche) amounted to 8.1 centimeters, which approximately equals the differences in average adult male height between the tallest (Norway) and the shortest (Italy) countries in Europe during the middle of the nineteenth century.Footnote 5 A major task of this article is to determine how much of the systematic tribal differences in stature can be explained by measurable ecological and socioeconomic conditions.
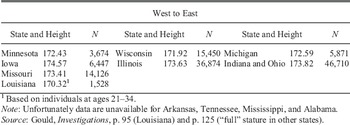
Interestingly, Union Army troops who were born in states east of the Great Plains also displayed a similar, but less pronounced height pattern when arranged by latitude. Unfortunately, data do not exist for some southern states, but the available measures (in Table 3) show that average adult (“full”) stature in the block of states just west or bisected by the Mississippi River followed an inverted U, with the greatest height near the middle. Recruits from Iowa, who occupied about the same latitude as the Arapahoe and the Cheyenne, were tallest at 174.57 centimeters, while troops from Minnesota (172.43) and especially Louisiana (170.32) were the shortest. States to the east of this block are less well organized geographically by latitude and longitude, but segments of the inverted U pattern are discernable. Soldiers from Illinois exceeded those from Wisconsin by 1.71 centimeters, and recruits from Kentucky were about a centimeter taller than those from Indiana and Ohio, who in turn were about 1.2 centimeters taller than those born in Michigan. These differences were considerably less than those found for the Plains tribes, but still functionally important. Economic historians have expended considerable effort to explain a 4 centimeter height decline of the mid-nineteenth century (the “antebellum puzzle”), which is approximately the same magnitude as the north-south height differences across states along the Mississippi. The pattern for whites is not the focus of this article but the concluding section considers some possible explanations and potential avenues for study.
AVERAGE FULL STATURE OF NATIVE-BORN WHITE UNION ARMY MEN BY LATITUDE AND LONGITUDE OF STATE OF BIRTH

1Based on individuals at ages 21–34.
Note:
Unfortunately data are unavailable for Arkansas, Tennessee, Mississippi, and Alabama.
Source:
Gould, Investigations, p. 95 (Louisiana) and p. 125 (“full” stature in other states).
Because the tribes were primarily hunter-gatherers, this article develops proxies for effort prices in obtaining food and defending territory. Rainfall, geographic area, and biomass (density of green vegetation) as well as Euro-American encroachment and the transition to reservations substantially affected the growth of various cohorts of the Plains tribes.Footnote 6 Surprisingly, the reservations were, on net, beneficial for growth, at least in the early years of their existence.
DATA AND METHODS
Other papers review the methodology of anthropometric research, which show that average height measures a population's history of net nutrition, or gross nutrition (diet) minus claims made by basal metabolism, disease, and work.Footnote 7 Although genes are important determinants of individual heights, genetic differences within groups tend to cancel such that averages reflect environmental influences.Footnote 8 Thus I seek explanations in terms of measurable variables that plausibly affected net nutrition, i.e., proxies for diet, disease, and work.
Importantly, Boas and his coworkers recorded the birth year for each individual in the database, which allows one to exploit annual variation in conditions during critical phases of childhood growth. This section motivates the explanatory variables.
Effort Prices
In studying the behavior of hunter-gatherers, Vernon Smith employed the concept of effort prices, which refers to the opportunity costs of various subsistence activities.Footnote 9 Following Richard B. Lee's study of 58 hunter-gatherer societies, Smith notes that subsistence strategies were aligned with relative effort.Footnote 10 The lush biomass of tropical conditions, for example, led to a strategy of gathering food. In the Arctic, where biomass was meager, the diet featured meat from land and sea mammals. These societies lacked conventional markets and monetary prices, but opportunity costs nevertheless shaped human choices. It is reasonable to argue that effort prices shaped the subsistence strategies of the Plains tribes.
Diet
The equestrian tribes were hunter-gatherers and pastoralists who expended energy to obtain food, and the amount of work varied with the abundance of dietary sources in the areas they occupied. Here I develop two proxies for the relative price of food in terms of effort: biomass and oscillations in rainfall. Biomass is a measure of the density of green vegetation that could serve as food for humans and their horses, and for animals they hunted. The number of bison per square mile that a habitat could support, for example, was a function of the biomass.
Direct measures of biomass are unavailable for the nineteenth century but I develop a modern proxy, which approximates conditions prior to European settlement.Footnote 11 Biomass calculated from satellite images of large surviving plots of natural vegetation, owned by The Nature Conservancy, closely tracks that found in the surrounding landscape subject to farming and grazing.Footnote 12 This follows because conditions of soil, elevation, temperature, and rainfall that affected richness of vegetation persisted over a long period of time.
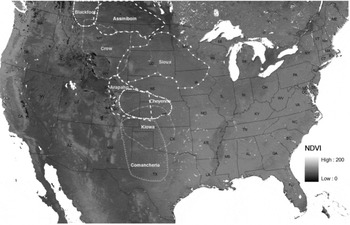
The measure of biomass is the Normalized Difference Vegetation Index (NDVI), which is calculated from the visible and near-infrared light reflected by vegetation.Footnote 13 Green plants absorb most of the visible light (VIS) but reflect much of the near-infrared light (NIR). The opposite is true for unhealthy or sparse vegetation and more so for water and bare soil. The index is defined as NDVI = (NIR - VIS)/(NIR + VIS), where the components measure the proportion of light reflected. Here the measure is scaled from 0 (barren) to 200 (lush). In the empirical work, the biomass measure for each tribe is an average of averages. The raw data are the average weekly composites of NDVI values from satellite images taken from January 1989 to December 2005 at a resolution of one kilometer grid squares.Footnote 14 The biomass for each tribe is calculated as the average value for the grid squares within the territories they occupied.Footnote 15Figure 1 provides a rough idea of these NDVI values.
NDVI BY TRIBAL REGIONS

The Great Plains are generally dry and persistent winds and warm temperatures during the growing season contribute to rapid evaporation. The amount of rainfall that reaches the roots heavily influences plant growth. Moreover, rainfall tends to be episodic on the Plains, with sequences of wet and dry years associated with El Niño and La Niña. The most famous episode of dry years in the twentieth century occurred during the Dust Bowl of the 1930s.
Some instrument readings on rainfall exist for the nineteenth century but there are few for the areas occupied by the tribes—certainly not enough to construct annual measures that could be used for empirical analysis. Tree rings, however, provide a good proxy for effective moisture. Specialists in the area have used cores from old but living trees or from timbers preserved in various ways to reconstruct an annual index of net rainfall for 155 grid rectangles across the United States over the past several hundred years.Footnote 16 The procedure relies upon a statistical model estimated from modern data on rainfall and tree-ring width, controlling for the tree species and other factors that affect growth such as age of the tree when the rings were produced, soil, elevation, and slope. The result is the Palmer Drought Severity Index (PDSI), which researchers scale from −6 (equivalent to the Dust Bowl conditions of the 1930s) to ∓6, a growing season of extraordinarily heavy rainfall.Footnote 17 A value in the middle (0) refers to normal conditions. Because the index is based on tree rings, it gauges net wetness (rainfall adjusted for temperature, humidity, and wind conditions), which is the appropriate concept for measuring annual variations in plant growth. Depending upon the sizes and locations of the areas occupied by the tribes, I used between one and ten grid rectangles to calculate the PDSI values used in the empirical analysis.
It is well-known that both extreme drought and flood can be damaging for plant growth, and on these grounds one might argue that the regressions should include the Palmer Index in a quadratic form. The Great Plains were quite dry on average, however, and additional moisture was beneficial for plant growth over a wide range of positive values. In experiments with functional form, the quadratic but not the linear term is statistically insignificant.
Sources of Socioeconomic Data
The Smithsonian published the most comprehensive source of socioeconomic information on Native American tribes as a 20 volume set entitled the Handbook of North American Indians. Volume 13 discusses histories of the Plains tribes in 67 chapters, and is the source used here for population, the transition to reservations, opening of trails, and maps of tribal areas.Footnote 18
Population and Geographic Area
Tribes expended energy and resources to defend the territories used for hunting and foraging. There may have been economies of scale in defense—other things equal, it may have been easier for larger tribes to patrol their land and assemble forces to defend it. On the other hand, population may have been spread too thin to be optimally effective. If land itself provided utility tribes may have been willing to sacrifice some health for a larger land area. Starting with population estimates for specific years from volume 13 of the Handbook of North American Indians, I interpolated estimates of population for each tribe for the remaining years based on regressions of population on time for that tribe where the population figures were taken from the appropriate tribal chapters in volume 13 of the Handbook of North American Indians.Footnote 19 In principle, one could estimate the tradeoff between area and population on stature, but in practice the measured geographic areas and estimated populations are so highly correlated (0.86) that one cannot obtain precise estimates of each effect. The regressions include only land area as an explanatory variable. It seems that competition for land on the Plains forced each tribe to balance area and population. It should be emphasized, however, that the tribes were nomadic and the areas occupied were fluid. Moreover, the tribes lived in areas that were remote from census takers and population estimates are crudely based on observations of travelers, trappers, traders, and the military.
Trails, Missions, and Settlement
As they moved West, Euro-Americans brought diseases and consumed plants and animals. The major pathways were the Santa Fe Trail, which opened in 1821, and the Oregon Trail, which opened in 1842. The first linked Kansas City with Santa Fe, New Mexico and mainly carried freight on lands inhabited by the Kiowa and the Comanche, diagonally crossing central Kansas to the Arkansas River in the western part of the state, and from there into northwest New Mexico. Most freight followed a more southerly route in western Kansas, known as the Cimarron River cutoff, which was shorter and where the terrain was easier to traverse but less water was available than found in the more northern route though southeastern Colorado. The Oregon Trail opened later but saw more human traffic across land occupied by the Arapahoe, following the Platte River in central Nebraska and the North Platte in western Nebraska and eastern Wyoming, to the South Pass at the continental divide in west-central Wyoming. At one time, the Cheyenne bordered or overlapped the routes but most of the tribe retreated a safe distance north or south away from them to avoid the environmental devastation and loss of game on and near these trails created by the high volume of traffic. Various forts and trading posts were located along these trails, which acted as foci for the spread of disease.Footnote 20
Diaries of travelers on these trails provide insights into the consequences for Native Americans who lived in the region. Extensive grazing of draft animals, trampling of vegetation, depletion of firewood, and hunting all reduced the dietary potential to natives. More important for health, however, was the constant importation of communicable diseases, which spread devastation beyond the environs of the trails themselves. Elliott West suggests that the overland trails were like “gigantic linear petri dishes” well suited to the cultivation and transmission of diseases.Footnote 21 A typical emigrant party interacted with hundreds of persons, drank the same water, and ate and slept close to one another's garbage, offal, and excrement. Corpses were often buried in shallow graves that were dug up by wolves, exposing and scattering infected body parts. One diarist writing about the Oregon Trail in 1849 called the plains “this boundless city of the dead.”Footnote 22
The Santa Fe Trail had less traffic but was a major supply route for the northern boundary lands of Spanish territory in the Southwest. The Spanish established hundreds of missions to assimilate and govern Native Americans and to convert them to Christianity.Footnote 23 The Santa Fe Trail served dozens of missions, which housed communities of natives, numbering from the hundreds to the thousands, who interacted regularly with tribe members outside the mission circle, thereby spreading contagious diseases.Footnote 24
Shortly after the Santa Fe Trail opened, the region south and east of the route faced additional competition for land resources and new imports of disease. The cotton economy of the American South boomed during the 1820s and early 1830s, and the competition for land eventually led to government action. Between 1818 and 1836 the Creeks, Cherokees, Choctaws, Chickasaws, and Seminoles were removed west of the Mississippi, thereby introducing new diseases and increasing the demand for food in areas occupied by the Kiowa and the Comanche in Texas and Oklahoma. White settlers soon added to the competition for land and grazing resources in the region when the Mexican government encouraged emigration from the United States in 1821. Texas became a republic in 1836 and a state in 1845. It would be another 16 years before a state in the longitude of Texas would enter the Union. Kansas entered in 1861, followed by Nebraska in 1867 and the Dakotas in 1889. Thus the plains were settled by whites from south to north, with the exception of Oklahoma, which remained Indian Territory until 1890.Footnote 25
For the tribes whose territories were bisected by these trails, I define the explanatory variable as the number of years during the period of growth (birth to age 18) that an individual lived with the tribe while white settlers used the trail.
Epidemics
Numerous accounts describe recurring epidemics, especially of smallpox but also measles, whooping cough, cholera, and influenza that swept the Plains.Footnote 26 From the appropriate tribal chapters in volume 13 of the Handbook of North American Indians, I tabulated by year and disease reports of 48 epidemics that infected the Plains tribes in the sample. As expected, the number of occurrences was related to the degree of isolation, with the Crow, who lived on the eastern edge of the Montana Rockies, having the least (3) and the Kiowa the most (9), followed by the Comanche and Sioux with 8 each. The information was originally collected by Indian agents, travelers, trappers, traders, and the military, but little is known about the intensity of the epidemics in terms of number of people infected and the death or morbidity rates that followed.
It is plausible to believe these episodes could have affected physical growth of children, either by disrupting tribal patterns of food production and distribution or via the diseases themselves. On the other hand, the tribes also learned coping mechanisms. At the first sign of smallpox, for example, the equestrian tribes learned to disperse into small groups until the danger period had passed.Footnote 27 If the losses were substantial, the depleted bands could quickly regroup with others to retain their economic efficiency. Because the epidemics were relatively short-lived, individuals whose growth was interrupted may have regained lost height through catch-up.
The measure I use as an explanatory variable is the number of epidemics that struck the tribe during the years of physical growth of an individual.
Reservations
Over a period of about two decades, all Plains tribes moved to reservations. The Sioux were the first to move, between 1856 and 1879. The last group was the Crow, who moved between 1870 and 1883. Much has been written about poor health on Indian reservations where tuberculosis, trachoma, small pox, and other diseases flourished.Footnote 28 The situation was so bad in the early twentieth century that the Meriam Commission was formed in 1926 to evaluate conditions and recommend reforms.
The health problems flowed in part from unsuccessful attempts to promote assimilation by turning Indians into farmers.Footnote 29 The General Allotment Act (Dawes Act) of 1887 gave up to 160 acres of tribal land to individuals, and property left over was sold to whites to pay for Indian education. Much of the land was unsuitable for farming, however, and the plots were too small to support livestock given the habitats of the reservations. Moreover, much of the land fell into the hands of whites such that acreage owned by Indians declined substantially after the turn of the century.Footnote 30
The measure I use as an explanatory variable is the number of growing years an individual in a particular tribe spent on a reservation from the beginning of the transition.Footnote 31
Results
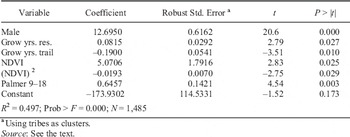
Table 4 shows the regression of individual height on ecological and socioeconomic variables that were systematically related to height. Most of the coefficients of the variables discussed in the second section are statistically significant and have the anticipated signs. The coefficients of land area and epidemics were the only two to fail the statistical significance test. Other things equal, heights improved with more moisture, with additional green vegetation, and with time on the reservation, but declined with more growing years spent near a trail. NDVI is included in a quadratic functional form on the grounds that diminishing marginal returns to green vegetation were likely. NDVI varied by about 17 points between the least green (Assiniboin) and the greenest (Kiowa) tribal areas. Given the size of the regression coefficients, vegetation was important for tribal differences in stature, a point pursued below.
EXPLAINING HEIGHT

aUsing tribes as clusters.
Source:
See the text.
The coefficient on the Palmer Index was significant for ages 9–18 but not for the young children (specification not shown), possibly because tribes prioritized food to protect the young from dietary stress, and the young had more growing years available to recover from deprivation. If nutritional conditions were bad during the adolescent growth spurt, however, the older children had fewer options to recover lost growth. The average standard deviation of the Palmer Index within tribal areas was 1.58 during the century from 1792 to the 1892. Given the regression coefficient of 0.65, a two-standard-deviation difference in the index, say from moderate wetness (1.58) to moderate dryness (−1.58), decreased average height by 2.1 centimeters.
Living near a trail had a noticeably negative impact on growth. The regression coefficient of −0.19 implies that someone who lived from birth to adulthood near a major land route for westward migration (18 years) was 3.42 centimeters shorter than a person who spent their growing years removed from this environment.
Surprisingly, reservations were beneficial for growth, at least for those people born no later than 1872 and measured by 1892. In absolute value, the regression coefficient is considerably smaller than for living near a trail (0.082 versus 0.19) but the impact is nonetheless nontrivial. Someone who spent all their growing years on a reservation was about 1.5 centimeters taller that a person who never lived in this environment. The reservations may have been beneficial for health in reducing conflict with whites and limiting migration that spread diseases. Major health penalties from the reservation system arrived later.
Epidemics in childhood and geographic area were not systematically related to stature (results with these specifications are omitted). One interpretation is that the variables are poorly measured. Measured epidemics may reflect mainly disease activity along major trade routes frequented by whites, rather than the interior where most natives actually lived. Alternatively, if the evidence on epidemics is reasonably accurate, the tribes may have been able to cope or to reorganize in ways that had little long-term consequence for height. The geographic fluidity of the tribes is well known and given the information available it may be impossible to construct this variable accurately.
NET EFFECTS
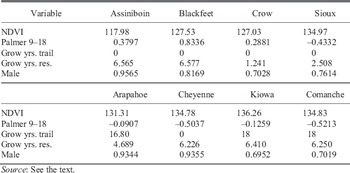
The final exercise is to assess how much of the systematic difference in average height across the tribes is explained by environmental and socioeconomic conditions. Table 5 presents the sample means of the explanatory variables for each tribe. One can see, for example, that the territories occupied by the Assiniboin had the least green vegetation due to long winters and heavy snow cover (NDVI = 117.98), whereas the score for the Sioux was 16.99 points higher, or 134.97. Therefore the Assinibion paid an NDVI penalty, in terms of physical growth, relative to the Sioux.
SAMPLE MEANS

Source:
See the text.
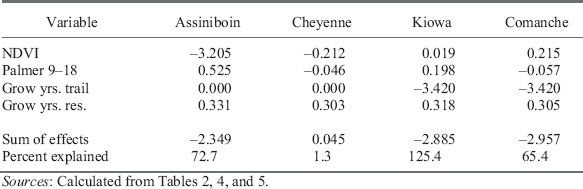
The penalty, ΔHeight, equals the predicted difference in stature implied by the differences in NDVI, which can be calculated by substituting into the following equation:

where NDVI refers to the corresponding regression coefficient in Table 5, S stands for the average NDVI value for the Sioux and A the average NDVI value for the Assiniboin. Making substitutions:

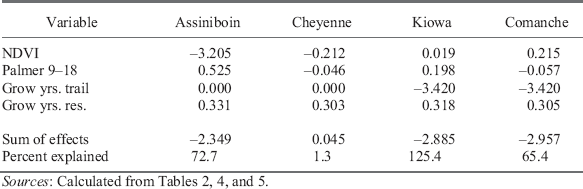
This and similar calculations, which are linear rather than quadratic for variables other than NDVI, are given in the first four rows of Table 6, and provide a measure of the absolute importance of ecological and socioeconomic conditions on physical growth. The low value of NDVI on the far northern Plains was a major factor that explains why the Assiniboin were so much smaller than the Sioux, and variations in growing years lived on the trail were important for height differences across the tribes.Footnote 32 Although important for physical growth of particular birth cohorts, the Palmer Index and growing years on reservations were relatively unimportant when the birth cohorts are aggregated across tribes. Chronological differences in the transition to reservations were small and affected only a few birth cohorts differentially. Although there were large annual fluctuations in moisture, over the course of the nineteenth century these differences tended to cancel across tribal areas, although it should be noted that above average Palmer values were beneficial for the Blackfeet and the Assiniboin and below average Palmer values penalized the Cheyenne and the Comanche.
EFFECTS OF CONDITIONS ON TRIBAL HEIGHT RELATIVE TO THE SIOUX
Sources:
Calculated from Tables 2, 4, and 5.
The second to last row of Table 6 gives the net effects of the differences in the values of explanatory variables divided by the tribal regression coefficients presented in Table 2. The environmental variables of the Assiniboin, for example, explain 72.7 percent (2.349/3.232) of the height gap with the Sioux. The assembled environmental and socioeconomic variables explain a considerable majority of the short stature of the Assiniboin and the Comanche, but overexplain, by approximately 25 percent, the short stature of the Kiowa (according to the model, they should have been shorter than observed).
CHEYENNE EXCEPTIONALISM
The model fails to explain the tall stature of the Cheyenne relative to the Sioux. Some unmeasured factor must have been important for their nutritional success and here I offer clues gleaned from experts who have studied the Plains tribes. In a remarkable study that is similar to but much smaller than the WPA slave narratives conducted in the 1930s, John Ewers interviewed elderly members of the Plains tribes in the early 1940s, principally the Blackfeet, who lived in the mid- to late nineteenth century.Footnote 33 He provides comparative information distilled from various sources on the number of horses owned per family, and in Table 2 reports George Catlin's claim made in 1832 that the Cheyenne were “the richest in horses of any tribe on the continent.” The figures reported in the table vary widely across tribes and dates and sometimes other tribes, particularly on the southern Plains, surpass the Cheyenne. We are unlikely to learn the precise numbers, but it seems clear that the Cheyenne were reasonably well-endowed with horses.
Joseph Jablow and John Moore, experts on the Cheyenne, take the point further in exploring the environmental and socioeconomic roots of their success.Footnote 34 Both argue that trade was the key, stemming from their geographic position on the central Plains and their multiple contacts with other tribes. Pushed out of Minnesota and Wisconsin in the early eighteenth century, the Cheyenne gradually moved across South Dakota and by the early nineteenth century concentrated further south and west, in eastern Colorado, western Nebraska, and western Kansas. Moore suggests that this move was possible in part because the Cheyenne were among the first, if not the first, tribe on the northern Plains to assemble enough animals to move regularly over long distances, a feat that required about three to six horses per family.Footnote 35 This transformation, which occurred by the second half of the eighteenth century, offered both economic and military advantages. Through regular travel, the Cheyenne acquired knowledge of terrain and trade routes, and had opportunities to cultivate contacts with potential buyers and sellers. The ability to move on short notice enabled them to avoid disadvantageous conflicts.
It is well-known that the Cheyenne and other Plains tribes were bison hunters, but Moore maintains that the nomadic tribes spent most of their time as pastoralists, who moved often to obtain forage for their horses and wood for their fires. With enough horses, bison hunting was easy and required only a few weeks of effort per year. In the short-grass prairies of the western Plains, food for horses, and also firewood for camp, were major constraints. Cutting down the trees destroyed an important resource and lessened the value of the site in future years; instead they preferred to burn a renewable resource, the dead wood. Similarly, within a few weeks the horses would consume all the good grass near camp and begin to wander out of sight and into danger of animal predation or theft by other tribes. These environmental conditions limited the optimal size of the bands to roughly 50 to 150 individuals, but even groups this small regularly broke camp.
In the early to mid-nineteenth century, horses, guns, furs, buffalo robes, and manufactured goods were the most prominent items of trade. Maps show that as occupants of the central plains, the Cheyenne were well positioned in the markets for these products.Footnote 36 Horses were the most mobile trade item and prices varied enormously by location. According to Moore, a horse was worth perhaps ten times more in southern Canada than in Texas.Footnote 37 The southern plains with reasonably warm climate and adequate vegetation offered the best location for raising horses; therefore, the Cheyenne exported horses, which they raised or purchased, to the north, and buffalo robes obtained through hunting, to the east, in exchange for manufactured goods and garden produce such as corn and beans grown by the agricultural tribes.
CONCLUDING REMARKS
As a group, the equestrian nomads were remarkably successful in the dimension of net nutrition. Some tribes flourished more than others. The tallest were the tribes living in the mid-latitudes of the Great Plains and their heights approached modern American height standards despite living through an era of epidemics and encroachment of their lands by whites. The conditions that determined this remarkable achievement offer many insights that have contributed to differences in nutrition for many groups in many periods throughout history.
The research measures the importance of local conditions for health of a population that was substantially self-sufficient. The regression analysis shows that variations in green vegetation and encroachment were important for the differential health of the equestrian Plains tribes. In a nutshell, the southern tribes suffered heavily from diseases connected with settlement, and northern tribes were short despite isolation from whites because they had less green vegetation as food for themselves, their horses, and the animals they hunted. The Cheyenne leveraged their central location and knowledge of horses into good nutrition as intermediaries of the Plains.
The health of whites also adapted to ecological conditions, or at least to geography in an inverted U-pattern, but explanations may require modification or adjustment. Plausibly, the northern tier of states had relatively less biomass, raising the effort price of food, as was the situation for the Assiniboin. A relative lack of biomass cannot explain short stature in the southern states but this region was considerably more humid than the plains, allowing insect vectors and pathogens to flourish. Quite possibly, an explanation focusing on exposure to disease may help to understand both the southern Plains tribes and Americans in southern states, but the nature of the diseases was quite different. The southern Plains tribes received heavy doses of pathogens, such as smallpox and measles, whereas Louisianans lived with malaria and gastrointestinal diseases.
Researchers can expand the type of analysis of the impact of climate here by investigating the roles of biomass and rainfall in the health of American whites. The project is probably best undertaken at the level of the county or clusters of counties. Union Army muster roles provide heights, and additional data on health are available from the census manuscript schedules of mortality for the mid-nineteenth century. Information on NDVI is available at the one kilometer level for the entire country, and the Palmer Drought Severity Index has been calculated for 155 evenly distributed grid squares for the United States. Notably, these environmental data also exist for other countries, including Canada and Mexico and so there is considerable opportunity to expand this type of research.