Consensus Decisions despite Majority Rule
The Council's formal decision-making rules have regularly been a major point of contestation in negotiations leading to reforms of the European Union's (EU) constitutional rules.Footnote 1 The extension of qualified-majority voting to new policy areas, the precise voting threshold, and the individual voting weights of member states have frequently been subject to heated debates in the intergovernmental conferences concerned with amending the EU's treaties. Most recently, disagreement over member states’ future voting weights almost derailed negotiations leading up to the Lisbon Treaty; and despite the further extension of qualified majority voting, some member states still insisted on retaining the unanimity rule in areas like taxation and social security, which are subject to particular national sensitivities. At the same time, the relevance of the voting rule in day-to-day legislative decision making of the Council seems rather limited. Decision making in most major policy areas under EU jurisdiction has long been subject to qualified majority rule, yet unanimous decisions are still the norm rather than the exception in the Council of the EU.Footnote 2
The lack of voting in the Council is even more puzzling in the light of recent accessions to the EU, which almost doubled the number of member states from fifteen to twenty-seven. These enlargements included mostly countries from Central and Eastern Europe, which had very different levels of economic development, as well as cultural and political histories. Based on standard collective decision-making theories, many observers consequently predicted a rise in policy stability resulting from an increase in the heterogeneity of member states’ policy positions.Footnote 3 If a larger set of member states with more heterogeneous preferences makes it harder to reach agreements, then we would also expect to see more reliance on qualified majority voting rather than consensus decision making in the Council. However, as further described below, the empirical record not only shows that voting is relatively rare in the Council, but also that this tendency was not affected in any way by the recent ‘big-bang’ enlargement of the EU to include states from Central and Eastern Europe.
In this article, I present a theoretical model that can account for both puzzling observations. Consensus decision making is defined as the adoption of a collective decision without contesting votes.Footnote 4 I argue that consensus emerges more or less coincidentally from the coalition-building process itself. If the formal rules allow for qualified majority decision making in the Council, then member states have an incentive to co-ordinate their behaviour and their negotiation positions with other like-minded states. Otherwise, they run the risk of becoming marginalized and their positions ignored in the negotiation process. Negotiations in the Council are usually complex, involving a multitude of issues and actors. In the light of such complexity, boundedly rational actors are likely to follow simple heuristics to guide their behaviour.Footnote 5 A plausible heuristic for government representatives is to band together with negotiators from other states with similar positions until their coalition is large enough to formally block a decision. Being part of a blocking minority ensures that the member state's views cannot be ignored. At the same time, joining other states that have negotiation positions close to its own limits the policy concessions the state has to make. Successively joining up with states or coalitions of states in this manner, member states form larger and larger coalitions until they reach the necessary numbers to constitute a blocking minority. If, at the end of this process, all member states are organized in blocking minority coalitions, then no policy can be adopted without unanimous consent. Thus, consensus emerges endogenously as an unintended by-product of the coalition-building behaviour of negotiators who seek to form blocking minority coalitions.
The remainder of this article develops an agent-based model to formalize this argument and explores the model's empirical plausibility and theoretical implications.Footnote 6 In the next section, I present data on consensus decision making in the Council of the EU and discuss several candidate explanations. Following the discussion of available data and theories, I present a brief case study of Council decision making. The case description illustrates the type of coalition-building dynamics that the computational model aims to capture. It also demonstrates the plausibility of the assumptions made about member states’ behaviour. Subsequently, I present the agent-based computational model and illustrate its dynamics through the description of a typical simulation run. Next, the model's predictions of the aggregate consensus rate for different membership sizes are compared to the observed consensus rates in the Council of the EU. Despite the model's simplicity, it is not only able to reproduce the qualitative features of the data – that the rate of consensus decisions is relatively high and that the rate is insensitive to changes in the number of member states – but it also yields rather accurate quantitative predictions. Given these encouraging results, the last part of the analysis consists of a computational experiment to investigate the effects of the voting threshold and the number of member states on the size of the typical winning coalition in more detail. The experiment shows that membership size does not have a discernible influence on winning coalition size, whereas the voting threshold displays a strong positive association. Finally, in the conclusion, I summarize the results and discuss the potential of competitive theory tests to rule out alternative explanations in future research. I also elaborate on the scope conditions of the theory to gauge the extent to which it is transferable to other collective decision-making contexts.
Legislative Decision-Making in the Council of the EUROPEAN UNION
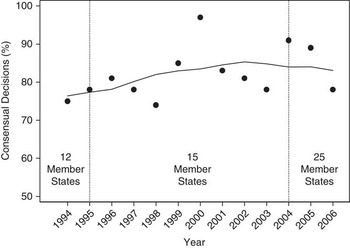
The constitutional rules of the EU allow the Council to adopt legislative decisions by a qualified majority of member states’ votes, but explicit voting in general, and negative votes or abstentions in particular, are relatively rare.Footnote 7 Despite successive enlargements and re-definitions of individual voting weights, the qualified majority threshold has remained remarkably constant over time, varying only between 71 and 74 per cent.Footnote 8Figure 1 presents data on the proportion of legislative Council acts adopted by consensus between 1994 and 2006.Footnote 9 The time period covers three different membership sizes. In 1994, the EU consisted of twelve member states. Sweden, Finland and Austria joined on 1 January 1995, increasing the number of member states to fifteen. Eight formerly communist countries from Central and Eastern Europe and two Mediterranean island states became members on 1 May 2004, further raising the number of member states to twenty-five.Footnote 10 Over this period of time, on average 82 per cent of all legislative acts enacted during a particular year were adopted by consensus. Based on standard collective decision-making theories, we would expect to see fewer consensus decisions after increases in membership size, given that more member states with heterogeneous preferences need to be accommodated to reach unanimous agreement.Footnote 11 Yet the observed rate of consensus decisions clearly contradicts this expectation, as it seems to be largely unaffected by changes in membership size.Footnote 12
Consensus decision making in the Council has long been a puzzle and several explanations have been advanced to account for the lack of voting. First, the institutionalist explanation stresses the foresight of the Commission, its powers as the agenda setter in EU decision making, and the configuration of member-state preferences relative to the status quo. A peculiar feature of the EU is that the Commission has the exclusive right to initiate legislation. Anticipating the positions of member states, the Commission might only introduce a proposal when a sufficient majority of member states exists to support the new policy.Footnote 13 As a result, only proposals with a relatively high chance of being adopted are actually discussed in the Council. The selection effect posited by this theory is in line with empirical evidence about the very low rejection rates of Commission proposals.Footnote 14
Consensus decision making in the Council of the European Union, 1994–2006
Note: The figure plots the percentage of consensual legislative decisions of the Council per year from 1994 to 2006. The curve was produced by a locally weighted regression (Lowess) smoother. The two vertical dotted lines indicate the enlargements of the EU in 1995 and 2004, respectively.
Sources: Years 1994–2002 from Heisenberg, ‘The Institution of “Consensus” in the European Union’, years 2003–2006 from Hagemann and De Clerck-Sachsse, ‘Old Rules, New Game’, see text for further details.

Although the Commission's role as agenda setter and its strategic foresight might be able to account for why we see few rejected proposals, these elements of the theory are not sufficient to explain the relatively low number of negative votes on proposals that are actually adopted. Taking the preferences of governments into account, the Commission should be able to formulate a proposal that is just about acceptable to a minimum winning coalition of member states.Footnote 15 In this scenario, oversized winning coalitions are only expected to occur if the disagreement between member states about the precise formulation of the new policy is small compared to their shared negative assessment of the existing status quo.Footnote 16 Consensus decisions reflect a true agreement among member states about the undesirability of the status quo and the direction of policy change. In such a situation, the formal decision-making rule really does not matter; the same agreement could have been reached under unanimity.Footnote 17
The second type of explanation highlights compliance concerns as possible explanation for consensus decision making. The EU depends largely on member-state governments and administrations for the transposition, implementation and enforcement of European law. Member states that have been outvoted when the act was adopted might oppose ‘through the backdoor’ by delaying the act's implementation or by implementing it incorrectly.Footnote 18 According to this view, laws are adopted by consensus at the European level to avoid compliance problems when those laws have to be put into force at the national level.Footnote 19
The third type of explanation stresses the possibility of log-rolling between member states.Footnote 20 If member states vary in the salience they attribute to different policy issues, then opportunities for vote-trading exist. For example, Issue 1 might be extremely important to member state A, while Issue 2 is important to member state B. Then member state A can trade its consent on Issue 2 for member state B's consent on Issue 1. Oversized coalitions can result as a side-effect of such vote trades.
Finally, the fourth type of explanation stresses internalized norms and rules of behaviour to account for the absence of voting in the Council.Footnote 21 Following this cultural argument, negotiators developed a consensus reflex as a result of years of Council negotiations under the so-called Luxembourg compromise.Footnote 22 The Luxembourg compromise stipulated that unanimous agreement had to be reached, even in areas where qualified majority voting was formally allowed, if a member state felt that the decision affected important national interests. New entrants to Council negotiations are supposedly quickly initiated to this culture of compromise and internalize it. Thus, according to this perspective, the lack of voting is due to internalized consensus norms.
While all these theories provide more or less plausible explanations for consensus decision making, they all have trouble with the observation that the consensus rate remains largely constant despite a considerable increase in the number of member states in recent years. According to the institutionalist perspective, more member states are likely to introduce more heterogeneous preferences. The increased disagreement should result in more negative votes and, therefore, a lower consensus rate. The larger number of member states and increased preference heterogeneity through enlargement is also problematic for the compliance argument. The marginal returns for the majority of member states to accommodate yet another recalcitrant government arguably decrease with increases in the number of member states. An ambitious policy that is implemented imperfectly only in a small number of member states might be preferable to a completely watered down version, even if that version was uniformly applied across the Union. Regarding the logrolling explanation, the demands of vote trading on the cognitive abilities of negotiators increase exponentially with the number of member states. Vote trading amongst twenty-five member states is disproportionally harder and hence disproportionally less likely to be successful than vote trading amongst fifteen member states. The expected outcome should again be a decrease in the consensus rate.Footnote 23 Finally, informal norms are more difficult to sustain in larger groups and newcomers are less likely to be socialized into those norms when they enter the group in large numbers. Thus, at least the enlargement from fifteen to twenty-five member states in 2004 should have affected the consensus culture in a negative way, resulting in a lower rate of consensus decisions. As Figure 1 shows, the empirical data clearly contradict these expectations. In contrast, the output of the computational model developed below is consistent with the observed pattern.Footnote 24
Real-World Coalition Building: A Motivating Example
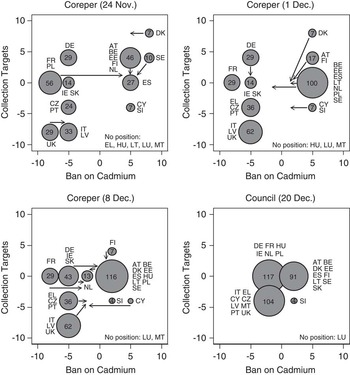
The model of coalition building developed here aims to capture salient features of empirically observed behaviour of member states in Council decision making under qualified majority rule. To illustrate these kinds of coalition-building dynamics, Figure 2 displays the initial negotiation position of member states and subsequent changes in those positions on two salient issues during the negotiations on the Council's common position on the batteries directive.Footnote 25 Each panel presents a snapshot of negotiation positions at a certain point in time. The horizontal axis indicates positions on the extent and timing of a ban on cadmium in batteries. The vertical axis indicates member states’ positions on the size of battery collection targets and the deadline for reaching them.Footnote 26 The size of the plot symbols is proportional to the combined voting weights of the member states holding that negotiation position. The voting weights for individual states range from 3 for small countries like Luxembourg or Malta to 29 for large countries like France or Germany.Footnote 27 The arrows indicate changes in member state positions between snapshots.
Real-world coalition-building dynamics in the Council of the European Union
Note: The figure provides snapshots of the coalition-building dynamics of Council negotiations between June and December 2004, leading to the adoption of a common position on the batteries directive. Member states’ positions are measured on an ordinal scale and the numerical axis values should be interpreted accordingly. The arrows indicate changes in positions between two snapshots. The size of the plotting symbol is proportional to the combined voting weight of states holding a certain position, which is also indicated by the number inside the circle. Country abbreviations and voting weights (Hayes-Renshaw and Wallace, The Council of Ministers, p. 265): AT = Austria (10), BE = Belgium (12), CY = Cyprus (3), CZ = Czech Republic (12), DE = Germany (29), DK = Denmark (7), EL = Greece (12), EE = Estonia (4), ES = Spain (27), FI = Finland (7), FR = France (29), HU = Hungary (12), IE = Ireland (7), IT = Italy (29), LT = Lithuania (7), LU = Luxembourg (3), LV = Latvia (4), MT = Malta (3), NL = Netherlands (13), PL = Poland (27), PT = Portugal (12), SE = Sweden (10), SI = Slovenia (4), SK = Slovakia (7), UK = United Kingdom (27).

The Commission submitted its proposal for the batteries directive in November 2003, but negotiations in the Council did not start before June 2004.Footnote 28 During one of its last meetings under the Irish presidency, the Council's environment working party had a first reading of the proposal.Footnote 29 The working party is composed of officials from national environment ministries and deals with all matters related to the environment. The Dutch government, who took over the Council presidency in July 2004, made the proposal a priority.Footnote 30 The environment working party discussed the proposal at seven occasions in July, October and November, before asking the Committee of Permanent Representatives (Coreper) for further guidance. Subsequently, the proposal shuttled back and forth four times between the working party and Coreper. Neither the officials in the environment working party, nor the deputy ambassadors in Coreper were able to reach an agreement. Eventually, Environment ministers struck a compromise at their meeting on 20 December 2004.
The top left panel of Figure 2 shows the positions of member states before the first Coreper meeting on 24 November, after the environment working party had discussed the proposal and its policy implications in detail.Footnote 31 Most member states agreed that a general ban on cadmium in batteries was a more practical solution than the closed-loop collection and recycling system proposed by the Commission. Conflict centred on a possible exception for batteries in handheld power-tools. The proponents of such an exception, mostly member states with a significant battery producing industry, argued that no alternative technology was yet available for such applications. The opponents of an exception disagreed with this assessment. Fearing the loss of hundreds of jobs in a large domestic battery factory, France most emphatically rejected any form of ban.Footnote 32 Early in the negotiations, Poland and the United Kingdom also showed scepticism whether the environmental benefits would outweigh the economic and social costs of a ban (this position is coded as −8 on the horizontal axis of the panels in Figure 2). Germany, Italy, Ireland and a number of small and medium-sized member states from Eastern Europe agreed to a ban in general, but demanded an exemption for handheld power-tools or at least a much longer transition period than the four years suggested by the Council Presidency (coded as −5). Most of the remaining countries, including Spain and many Central and Northern European member states, could accept the Presidency's proposal of a complete ban after a transition period of four years (coded as +5). Only Sweden and Denmark originally demanded a complete and immediate ban of those types of batteries (coded as +8).
The second major disagreement revolved around the size of the binding collection targets. Many countries, including Germany and a number of Central and Northern European member states, supported the Presidency's proposal of a collection target of 60 per cent of sold batteries to be reached after ten years through linear yearly increases in the proportion of collected batteries (coded as +4 on the vertical axis of the panels in Figure 2). Denmark, one of the forerunners in terms of environmental standards, asked for an even more ambitious target (coded as +8). In contrast, Italy, the United Kingdom and Latvia asked for a lower, more feasible target of 40 per cent to be reached after ten years (coded as −8). The remaining countries, including France, Poland and Spain, took an intermediate position, either favouring a nonlinear increase to a target value of up to 40 per cent after seven years (coded as −4), or a nonlinear increase to a target value of up to 60 per cent after ten years (coded as 0). Under both options, the nonlinear increase meant that the progress towards the target value could be smaller during the first few years after implementation of the new policy.
The top right panel of Figure 2 shows the state of play of negotiations at the start of the second Coreper meeting on 1 December.Footnote 33 The arrows in the top left panel indicate the changes in positions of member states that occurred during the Coreper meeting on 24 November and a subsequent meeting of the Environment working party on 25 November. The figure clearly shows that a number of member states moderated their positions, joining states with other, more centrist positions. The bottom left panel displays negotiation positions at the start of the third Coreper meeting on 8 December.Footnote 34 During the previous week, the environment working party had met again twice. The changes from the top right to the bottom left panel reveal a further increase and consolidation of member states’ positions along both issue dimensions. It is noteworthy that almost all member states originally favouring a complete cadmium ban after a four year transition period now conceded the inclusion of a review clause to allow for a possible extension of the exemption (coded as +2). As a new compromise proposal to reconcile the proponents and opponents of a cadmium ban, the Dutch presidency suggested including an unlimited exemption for batteries for cordless power-tools in the directive, but with the possibility of including those types of batteries in the ban after a Commission review four years later (coded as −2). Finally, the lower right panel of Figure 2 shows the positions of member states before environment ministers continued negotiations at their Council meeting on 20 December, following another working party meeting on 9 December and another Coreper meeting on 13 December. Along the cadmium ban dimension, most opponents of a ban of cadmium batteries in cordless power tools were able to support the Presidency's new compromise proposal of a review of the exemption after four years. Amongst the countries favouring a ban, Cyprus, Hungary and Poland also embraced the Presidency's compromise proposal. Along the collection target dimension, Italy, Latvia and the United Kingdom abandoned their call for a very low target rate in favour of the somewhat more ambitious goal of a nonlinear increase to 40 per cent after seven years.
As the lower right panel indicates, the end result of this process was three distinct, very similarly sized coalitions. As ninety votes are sufficient to block a Council decision, the consent of all three coalitions was required to adopt a decision. Therefore, the classic compromise outcome negotiated by ministers is not very surprising. In the end, member states agreed on an exemption of cordless power tools from the ban with a review of the exemption after four years. To make this solution acceptable to the proponents of a more encompassing ban, the Council's common position explicitly stated that the review should be conducted ‘with a view to the prohibition of cadmium in batteries’.Footnote 35 Only Belgium and Ireland could not support this compromise and abstained from a vote. Belgium considered the partial cadmium ban not strict enough, while Ireland objected to the ‘closed’ nature of the review of the exemption. The collection target was eventually set to 45 per cent after ten years, a value located between the 40 and 60 per cent originally demanded by the two groups of countries. Although the final outcome was closer to the position of its own coalition than to the position of the opposing coalition, Italy and Greece still considered these collection targets to be too high and abstained from the vote.Footnote 36
The case points to several salient features of Council decision making. First, the presidency of the Council plays a crucial role in facilitating the negotiation process by sounding out positions and offering compromise proposals. Secondly, the positions of member states tend to become more moderate during the course of negotiations. Finally, member states merge into larger and larger coalitions as the negotiation process progresses. While all these aspects are worth consideration, the model focuses on the last feature. The coalition formation process is most relevant for explaining consensus decision making. Starting with often ill-defined and idiosyncratic negotiation positions, member states adapt their positions over time to form larger and larger groups. As a result of this process, groups of countries with similar negotiation positions form, each of them large enough to formally block a majority decision. Although it did not prevent negative votes in this particular case, the need to take the positions of all groups into account when negotiating a compromise will often be sufficient to ensure unanimous support.
A Computational Model of Coalition Building Dynamics
The agent-based computational model is designed to resemble the general dynamics of real-world coalition building as illustrated by the example of the batteries directive.Footnote 37 I model coalition formation computationally for two reasons: first, formal models of coalition formation quickly become intractable when more than a very limited number of actors are considered.Footnote 38 Secondly and more importantly, the theoretical argument stresses the central role of the process of coalition formation itself for the causal explanation of coalition patterns. Mathematical models face difficulties representing and exploring the consequences of such adaptive, history-dependent processes.
At the core of the agent-based model lies a simple but empirically plausible assumption about individuals’ behaviour. Negotiators are conceptualized as boundedly rational actors.Footnote 39 Such actors are still goal oriented; yet navigating in complex and uncertain environments, they rely on simple heuristics to pursue their goals rather than on complicated assessments of the consequences of different courses of action.Footnote 40 At the start of Council negotiations, negotiators will find it hard to identify a generally acceptable policy outcome in a multidimensional policy space when the number of member states is large, let alone calculate favourable vote exchanges between various pairs of countries with different salience levels to generate a satisfactory logroll. However, negotiators are usually well able to identify the current positions of other negotiators. Negotiators also know that a decision will not be made under qualified majority voting without their consent if they are able to muster a blocking minority. Given the complexity of multilateral multi-issue negotiations, pursuing the formation of a blocking minority is a simple but effective way for negotiators to ensure that their views are reflected in the final negotiation outcome. At the same time, the reduction in the effective number of actors as a result of the aggregation of individual negotiation positions into joint positions of multi-actor coalitions enhances the chances of successful compromise proposals and logrolls at the end of the coalition-formation process.
The assumption of negotiators as blocking minority seekers is not only theoretically plausible; it also receives considerable direct and indirect empirical support. In terms of indirect support, the importance of blocking minorities in Council decision making is underlined by the Commission's efforts to break up such coalitions by changing states’ preferences and fall-back options.Footnote 41 Also, lobby groups that aim to prevent European regulation in a certain policy area focus their efforts on supporting and stabilizing blocking minorities.Footnote 42 Finally, Council presidencies use their scheduling prerogatives to ‘buy time’ to build blocking coalitions.Footnote 43 Regarding the more direct support, interviews with national representatives indicate that they continuously assess whether a blocking minority exists when they negotiate in the Council.Footnote 44 They also consider coalition building to be one of their most important negotiation tactics.Footnote 45 This impression is also supported by insider accounts of practitioners: Westlake and Galloway explain that under qualified majority voting delegations need to construct blocking minorities to extract concessions from their negotiation partners.Footnote 46
The goal of the computational model is to explore the macro-consequences, especially with respect to the observed level of voting, resulting from the micro-behaviour of individual negotiators motivated by the desire to form a blocking minority. The model has only two changeable parameters, the number of member states and the voting threshold. This simplicity is necessary for understanding how the model generates its output. When computational models serve as theoretical tools rather than forecasting instruments, their complexity needs to be limited so that unambiguous predictions can be derived through computational experiments.Footnote 47 Otherwise these models become just as unintelligible as the real world processes and phenomena they are supposed to explain. From a substantive point of view, the number of member states, the voting threshold, and their interaction are important variables for enlargement policy and institutional design, not only in the case of the EU, but international organizations in general.
For current purposes, the model ignores differences in voting weights of member states. From a scientific point of view, incorporating voting weights is problematic in at least two respects. First, the theory would be tailored to a specific voting system with a particular number of member states and a particular distribution of voting weights. Although the development of the model is motivated by the puzzling absence of voting in the Council of the EU, consensus decision making is a salient feature of many international decision-making bodies. Thus, formulating the theory in abstract ways ensures its applicability to similar contexts beyond the EU, thereby increasing its utility.Footnote 48 Secondly, the incorporation of voting weights makes it impossible to distinguish between the individual effects on consensus decision making of changes in membership size and changes in the distribution of voting weights, respectively. As the distribution of voting weights changes automatically and simultaneously with any change in the number of member states, we cannot determine experimentally to what extent any predicted change in the consensus rate is due to changes in the voting weights, changes in the number of member states, or the interaction of the changes in those two variables. A theoretical model that does not allow us to identify cause–effect relationships between its component variables unambiguously is of limited use for understanding the real world.Footnote 49
In the model, member states’ ideal points are located in a two dimensional policy space, represented on a 21 × 21 square lattice. To make sure that simulation results do not depend on specific preference constellations, the integer co-ordinates for governments’ ideal points are randomly drawn from a uniform distribution ranging from −10 to +10 at the beginning of the simulation run. The initial negotiation position corresponds to the ideal point of the government. Each government representative then determines how large the coalition is to which the representative belongs. Technically, the representative counts the number of other governments occupying the same position. If the coalition is large enough to block a decision, the representative sticks to the current negotiation position. If the coalition is not large enough to block a decision, the representative compares the size of the current coalition to the size of the closest neighbouring coalition. Euclidean distances are calculated for these comparisons. If several coalitions are equally far away from the representative's coalition, the size of the current coalition is compared to the size of the largest of those coalitions. If the neighbouring coalition identified through this procedure is as large as or larger than the current coalition, then the representative joins the neighbouring coalition. If the neighbouring coalition is smaller than the current coalition, the representative does not change position, anticipating that the members of the neighbouring coalition will subsequently join his or her coalition.Footnote 50 Each government representative decides about adapting his or her negotiation position in turn. The order of moves of governments is determined randomly in each round of the simulation run.Footnote 51 The negotiators’ knowledge about their own and others’ negotiation positions and coalition statuses is updated after each negotiator's move. Thus, government representatives are modelled as moving consecutively rather than concurrently. This modelling strategy corresponds to real world dynamics, in which negotiations take place in continuous time and negotiators do not all change their negotiation positions simultaneously.
The simulation run can end in one of two ways. First, the simulation run ends if one of the coalitions is large enough to adopt a Council decision by qualified majority vote. Obviously, this outcome represents the case of a contested decision. Secondly, the simulation run ends if all negotiators have reached their intermediate goal of forming a blocking minority. If all member states are part of blocking coalitions, a Council decision can only be reached by accommodating all views. Thus, this outcome represents a broad compromise of all member states; in other words, it represents a consensus decision.Footnote 52 Note that the simulation ends only at the end of the current negotiation round, after each member state had its turn. Each round can be thought of as a meeting of the relevant Council body, in which a formal decision is only made after each negotiator had the opportunity to state his or her position. While negotiators take into account what their counterparts have said before them, they still get the opportunity to adjust their position even if the stated positions of previous speakers already indicate a winning majority. The model assumes that the presidency allows all representatives to express their opinions before calling for a vote.
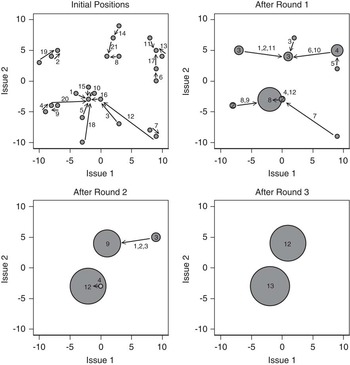
Figure 3 presents the dynamics of a typical simulation run with twenty-five member states and a qualified majority voting threshold of 72 per cent. These settings mirror the situation in the batteries directive case discussed above. I ran the simulation 1,000 times; each time with a different, randomly generated initial preference configuration. The plotted run is typical in the sense that it is characterized by typical values on a number of variables calculated from those simulations. The run exemplifies the median number of rounds until run completion, the median number of coalitions at the end of the run, and the median number of member states in the largest coalition at the end of the run. Finally, conditional on these characteristics, the run exhibits the median distance between member states’ negotiation positions at the start of the simulation.
Coalition-building dynamics: A typical model run
Note: The figure shows the coalition-building dynamics of a typical model run for a membership size of twenty-five states and a voting threshold of 72 per cent. The model run is typical in that it exhibits the median values for the number of rounds until run completion, for the number of coalitions at the end of the run, for the number of member states in the largest coalition at the end of the run, and conditional on these characteristics, for the median distance between member states’ initial positions. The upper left panel shows the initial positions of member states. Subsequent changes and their sequence are indicated by arrows and numbers, respectively. The upper right, lower left, and lower right panels show the positions of member states after the first, second and third round of adaptations. The diameter of the plot symbols increases with the size of the coalition and the number inside the circles indicates the number of member states occupying this position.

The top left panel of Figure 3 gives the initial positions of government representatives. The other panels show snapshots of the state of coalition building after each full round of adaptations. The arrows indicate movements of government positions between the snapshots; accompanying numbers show the sequence of those moves. The size of the marker symbol is increasing with the size of the coalition and the number of member states occupying a certain position is given inside the circle. The top left panel shows the distribution of ideal points of member state governments. By assumption, the ideal points are equivalent to governments’ initial negotiation positions. At least in the case of Council negotiations, these initial positions will be hard to observe systematically, as the documentary record often only starts once member states have formed somewhat consolidated coalitions. The snapshot in the top right panel of Figure 3 more closely resembles the real-world configurations of negotiation positions as shown in Figure 2. After the first round of adaptations, coalitions of varying sizes have already formed. The lower left and lower right panel of Figure 3 show how these coalitions merge until each member state is part of a blocking minority.
The example run illustrates an important feature of the computational model. The stopping rules discussed above imply that the simulation does not stop until all member states are part of a blocking coalition, even when two or more already existing blocking coalitions are large enough to muster the required majority to adopt a decision by vote. The lower panels in Figure 3 illustrate this situation. The lower left panel depicts two large blocking coalitions, one with twelve and one with nine member states. In addition, two smaller coalitions consisting of one and three member states exist. If the two blocking coalitions agreed on a compromise, they could easily outvote the other member states. Only eighteen votes are required for a winning majority. However, the model assumes that the coalition building continues until all member states are part of a blocking minority. Consequently, the states of the two smaller coalitions are still able to join the blocking coalitions; only then does the simulation stop.
At first sight, the implicit assumption that blocking coalitions ‘wait’ for the remaining states to become members of a blocking coalition before they negotiate a compromise amongst themselves seems to be inconsistent with the rational goal-orientation of actors. However, if the final compromise negotiated between blocking coalitions is at least somewhat affected by the coalition's respective sizes, drawing out the negotiation process to allow ‘lonely’ member states to join one's coalition is a very rational strategy. In the lower left panel of Figure 3, the members of the blocking coalition closer to the three-member coalition have a clear incentive to prolong the negotiation process to allow the members of the smaller coalition to join them. Striking a bargain requires the consent of all negotiation parties, thus the refusal of one blocking coalition is sufficient to extent the negotiation process. As depicted in the lower right panel, the delay in accepting a compromise has increased the coalition size from nine to twelve member states. Although the size of the larger blocking coalition has also increased by one member state during that time, the relatively stronger increase in the number of members of the smaller blocking coalition brought its size almost up to par and promises more leverage for extracting concessions. As the focus of this study is on coalition formation and voting, the determination of the substantive negotiation outcome is not explicitly modelled. However, existing empirical research indicates that models based on weighted averages of member states’ policy positions perform best in predicting actual decision-making outcomes in the Council.Footnote 53 Thus, the assumption that larger coalitions are better able to tilt the negotiation outcome in their favour is empirically supported. If negotiators are aware of this advantage, they have every reason to delay an agreement until their coalition has reached the largest possible size. In this sense, negotiators not only seek a coalition that is able to block legislation but, once this aim has been achieved, also a coalition that is as large as possible to exert a maximum degree of influence on negotiation outcomes.
An Empirical Evaluation of Aggregate Model Output
The previous section described the setup of the computational model and the rules according to which actors are supposed to behave. The illustrative simulation run showed the similarities of the resulting model dynamics with real-world coalition-building processes. Thus, the micro-behavioural rules provide an empirically plausible causal mechanism. This section assesses to what extent these micro-behavioural rules are also able to generate the empirically observed rate of consensus decision making at the macro-level. Any plausible model should be able to reproduce the two qualitative features of the aggregate voting data presented in Figure 1. First, the model should generate a generally high consensus rate: given the wide variation in consensus rates around the mean of 82 per cent, a predicted rate between 74 and 90 per cent would surely be acceptable. Secondly, the model's prediction should be relatively insensitive to the number of member states. Thus, the predicted consensus rate should not change considerably with variations in membership size. While the model design explicitly aimed at reproducing the high consensus rate, the comparison across membership sizes constitutes a first independent test of the theoretical model. None of the assumptions that entered the model formulation would lead us to expect insensitivity of consensus rates to changes in membership size.
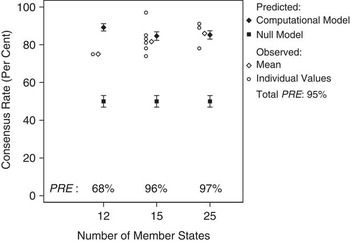
Figure 4 compares the predictions of the computational model with the observed data. The figure plots the observed yearly consensus rates between 1994 and 2006, the time averages of those rates for each membership size, as well as the predicted rates generated by the computational model for each membership size.Footnote 54 Each predicted rate is the proportion of consensus outcomes generated by 1,000 simulated negotiation processes with different, randomly generated initial policy positions and a constant voting threshold of 72 per cent.Footnote 55 The simulated results of the computational model are compared to the rate expected by chance. The chance prediction of the null-model and the associated standard error are based on the expected value of a binomial distribution with a probability of success of 0.5 and 1,000 trials. Comparing the null-model predictions with the predictions of the computational model, a measure of the proportional reduction in error (PRE) analogous to the familiar R 2 measure in linear regression analysis can be calculated. The main difference of this PRE-measure to R 2 is that it uses the prediction of the null-model rather than the mean of the observed data as the baseline for calculating the reduction in error. The predictions of the computational model are generated without taking into account any empirical information about the observed consensus rates. Hence, using the mean of the actually observed consensus rates as a baseline for comparisons with the purely theoretical predictions of the computational model would be inappropriate.
Observed versus predicted consensus rates
Note: The figure compares the observed consensus rates with the rate expected based on simulation results (Computational Model) and with the rate expected by chance (Null Model). The proportional reduction in error is calculated as PRE = (SSE null-SSE model)/SSE null, where SSE stands for sum of squared errors. The voting threshold was set to 72 per cent across all membership sizes. For each membership size, the figure shows the mean consensus rate and 95 per cent confidence intervals of 1,000 simulation runs. The corresponding results for the Null Model are based on the expected value and the standard deviation of a binomial distribution, where the number of trials is 1,000 and the probability of success is 0.5.

The predicted consensus rates of the computational model are remarkably close to the observed consensus rates. During the nine years in which the EU consisted of fifteen member states, the consensus rate varied between 74 and 97 per cent. The computational model predicts a consensus rate of 85 per cent, very similar to the observed time-average of 82 per cent. Compared to the prediction of the null model of 50 per cent, the prediction of the computational model reduces the prediction error by 96 per cent. During the three years in which the EU consisted of twenty-five member states, the consensus rate varied between 78 and 91 per cent. Again, the computational model's predicted consensus rate of 85 per cent is very close to the mean of the actually observed, yearly consensus rates of 86 per cent. Compared to the null-model prediction, the prediction of the computational model reduces the prediction error by 97 per cent. Only the computational model's prediction for twelve member states is relatively far off from the observed data. The only available data point for twelve member states indicates a consensus rate of 75 per cent in the year 1994, while the computational model predicts a consensus rate of 89 per cent. Given the generally high variability of the consensus rate over time, the source for this lack of correspondence is not clear. The model might do a worse job in predicting the consensus rate when the number of member states is rather small, or the observed year might have had an unusually low consensus rate. Either way, even this worst prediction decreases the prediction error of the null-model by 68 per cent. In total over the entire period, the model reduces the prediction error by 95 per cent.Footnote 56
The Predicted Effects of Voting Threshold and Membership Size
The strong correspondence of the simulated coalition-building dynamics and consensus rates with their real world equivalents warrant a further examination of the computational model. This section presents the results of a computational experiment. The goal of the experiment is to identify the consequences of changes in the voting threshold and the membership size on consensus decision making. The dependent variable in this analysis is the size of the winning coalition as a percentage of member states, measured at the end of the simulation run. By systematically varying the voting threshold and the number of member states, the independent and interactive effects of these two independent variables on the size of the winning coalition can be discerned.
The number of member states was varied in the experiment from six to thirty, resembling the actually observed range of the number of past, current and potential future member states of the EU. The voting threshold has been varied from 51 to 90 per cent.Footnote 57 For each combination of values of the independent variables, the simulation is run 1,000 times. For a given membership size, the use of an identical list of 1,000 random seeds to initiate the simulation ensures that the initial distribution of member states’ ideal points is exactly the same for all voting thresholds. However, when membership size is varied, the distribution of member states’ initial preferences cannot be the same, regardless of whether or not we keep the voting threshold constant. Still, the large number of replications with randomly distributed ideal points ensures that the distribution of initial preferences of member states do not systematically affect those simulation results.
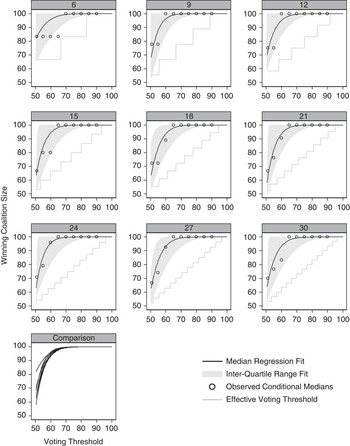
Figure 5 summarizes the simulated data and describes the relationship between voting threshold and winning coalition size. The figure presents the results of a nonlinear quantile regression analysis.Footnote 58 Each individual panel shows the differences in winning coalition size predicted from changes in the voting threshold, keeping the membership size constant. The data points in the panels represent the conditional medians of the simulated winning coalition sizes for different values of the voting threshold. The black curve indicates the nonlinear median fit. The conditional distributions of winning coalition size are often strongly skewed and include outliers. Thus, median regression is a more appropriate technique to identify the typical value of winning coalition size for a certain voting threshold than mean regression. The shaded areas in Figure 5 represent the predicted inter-quartile ranges of the conditional distributions. They provide information about the effect of the voting threshold on the shape rather than the location of the winning coalition size distribution.Footnote 59 The figure shows that for low voting thresholds, winning coalition size varies over almost the entire theoretically possible range of values. However, this variability decreases rapidly with increases in the voting threshold. The figure also indicates the size of the effective voting threshold, which is the minimum number of member states required to satisfy the formal threshold, expressed as a proportion of the total number of member states. The effective voting threshold is shown by the grey line taking the form of a step-function.
Effect of voting threshold on winning coalition size by membership size
Note: This figure shows the nonlinear relationship between voting threshold and winning coalition size for different membership sizes. The data points indicate the conditional medians of the simulated winning coalition sizes for different values of the voting threshold. The black curve represents the predicted median value and the grey area represents the predicted interquartile range, both estimated by nonlinear quantile regression. Each regression analysis is based on N = 9,000. The grey line shows the effective voting threshold as a function of the formal voting threshold. The bottom left panel compares the prediction curves across different membership sizes.

Figure 5 demonstrates that the nonlinear power function describes the relationship between voting threshold and median winning coalition size rather well. The non-zero intercepts of the curves indicate that the winning coalitions are somewhat oversized, even when the formal voting threshold requires only a simple majority. Because the difference between the effective and the formal voting threshold is larger when the number of member states is smaller, the intercept of the curve tends to be larger as well. The predicted winning coalition size increases relatively quickly with increases in the voting threshold until it reaches its conceptual maximum of 100 per cent. This limit is usually reached at around a voting threshold of 65 to 70 per cent, regardless of membership size, and remains constant for higher values of the voting threshold. The panel at the bottom left of the figure indicates that the curves estimated for different membership sizes are very similar, indicating a relatively small effect of changes in the number of members states, and that those changes only affect winning coalition size when the voting threshold is relatively low.
The analysis above suggests that membership size has little effect on consensus decision making, but that higher voting thresholds increase the likelihood that acts are adopted without contesting votes. To illustrate this effect, the consequences of future changes in the EU's voting threshold on the predicted consensus rate can be considered. In 2014, the new voting system introduced by the Lisbon Treaty will come into force, reducing the primary voting threshold in the Council from 74 to 65 per cent. According to the model, this 9 percentage point decrease in the voting threshold will result in a disproportionally large reduction in the rate of consensual decisions of 25 percentage points. While the predicted consensus rate for the current Nice Treaty rules is 88 per cent, the rate under the new Lisbon Treaty rules is expected to decline to 63 per cent, implying a considerable increase in the occurrence of explicit voting in the Council.Footnote 60
Conclusion
This article presents an agent-based model of coalition-building to explain consensus decision making in the Council of the EU. Negotiators are modelled as adaptive blocking-minority seekers. Relying purely on current information about member states’ publicly stated negotiation positions, negotiators join larger and larger groups of other member states with similar policy positions until they are part of a group that is able to block a decision by vote. If all member states become part of a blocking minority before a winning coalition forms, a Council decision can only be reached through a compromise agreement of all coalitions. Thus, consensus emerges endogenously as an unintended by-product of the coalition-building process. As illustrated through a case study of the adoption of the Council's common position on the batteries directive, the model generates coalition building dynamics that resemble those in real-world cases, providing an empirically plausible causal mechanism for the generation of consensus decisions. Furthermore, the model's aggregate quantitative predictions for the rate of consensus decisions also correspond well with the empirically observed rates. Importantly, the model is able to reproduce the observation of a largely constant consensus rate despite large increases in membership size during the study period. The model does not include any assumptions specifically incorporated to reproduce this feature of the observed rate, so this finding constitutes an important independent test of the theory.
The predictive success of the model increases confidence in its usefulness and justified further investigations of its properties. A computational experiment of the effects of the voting threshold on the typical winning coalition size demonstrates a positive relationship between the two variables, which is largely unaffected by variation in membership size. The higher the voting threshold, the easier it is for member states to construct a blocking minority before others have formed a winning majority. Of course, the converse holds as well. Thus, if the model captures the essentials of coalition building in the Council, the envisaged reduction of the voting threshold under the Lisbon Treaty will greatly reduce the number of decisions adopted by consensus. In contrast, further extensions of membership through enlargements are not expected to have any discernible effect on consensus decision making.
The primary purpose of this article is to present a new theory and to establish its plausibility by demonstrating that its assumptions about micro-behaviour and its predictions about macro-outcomes are consistent with empirical evidence. Although existing theories seem to have difficulties accounting for the non-sensitivity of the observed consensus rate to changes in membership size over time, rigorously evaluating this proposition would require a systematic comparative test. While such a test is beyond the scope of the current study, it presents a promising avenue for future research. Besides comparing the predictive power of entirely different types of explanations, like logrolling, compliance or socialization theories, to the predictive power of the coalition-building model, another fruitful endeavour would be to assess the relative performance of different micro-behavioural rules for coalition-building within the same agent-based modelling framework. In the current model, negotiators are modelled as pure policy seekers who join larger coalitions that occupy positions close-by in policy space. However, empirical research on co-operation and communication networks in the Council suggests that larger member states are approached with higher frequency than smaller ones.Footnote 61 Similarly, cultural homophily or general ideological closeness of governments might play a role in the choice of coalition partners.Footnote 62 These alternative assumptions about member states’ motivations and decision heuristics could be substituted in the agent-based model to evaluate their relative merit.
We might be able to exclude some of these alternative theories purely on the ground that they are unable to generate the high consensus rates observed in the Council. For other alternative theories, a comparison of their predictions with the observed data on consensus rates might not provide a decisive empirical test. Yet, even if theories make observationally equivalent predictions about aggregate decision-making outcomes, other observable implications about the posited process or causal mechanism supposedly producing those outcomes can be evaluated. For example, if the logrolling perspective was correct, then we would expect to see more or less simultaneous moves of pairs of member states or coalitions to a position in policy space that is not currently occupied by either of them: Coalition A joins the position of coalition B on Issue 1 and coalition B joins the position of coalition A on Issue 2 in return. In contrast, according to the coalition-building model, coalitions do not merge by agreeing to move to a new location in policy space, but by the smaller coalition joining the current location of the larger one. Also, while logrolling can involve sudden changes in negotiation positions spanning the entire policy space, the coalition-building model expects incremental changes with coalitions only joining other coalitions that occupy positions that are close-by in policy space. An advantage of agent-based models is that they produce a wealth of predictions not only about the outcome of decision making, but also about various aspects of the process. In order to exploit fully this feature of agent-based models for competitive empirical theory tests, future research should endeavour to collect detailed individual-level data on how negotiation positions of member states change over time, on who forms coalitions with whom and on how a compromise agreement is eventually reached.
The development of the model presented in this article was mainly motivated by the puzzling absence of voting in legislative decision making of the Council of the EU. However, nothing in the model is tailored specifically to this context. Indeed, the model is potentially applicable to any decision-making situation that involves a group of actors making decisions by majority vote in the absence of hierarchical co-ordination or control of their voting behaviour. The latter condition implies that the model is not applicable to legislatures with strong party discipline. In such situations, the individual members of a party form a quasi-permanent coalition, they do not engage in independent coalition building behaviour themselves and their voting behaviour is largely determined by the instructions of their party leadership. Thus, decision making in many legislative institutions, especially those directly representing citizens, is beyond the scope of this theory. However, to the extent that party control is less prevalent in territorially based legislative chambers like the US Senate or the German Bundesrat, the theory might be able to shed some light on decision making in such bodies. More clearly, the theory should be applicable to multilateral negotiations in international organizations and other international forums that formally use a form of majority rule to adopt decisions. Examples include the General Assembly of the United Nations, the World Trade Organization, World Bank, International Monetary Fund, and decision-making bodies set up by multilateral environmental agreements. A priori, applying the theory to those contexts seems promising, as all of those organizations are known for regularly producing consensus decisions as well.Footnote 63
Appendix Simplified NetLogo Code for Computational Model
;; NEGOTIATOR BEHAVIOUR
to update-coalition-status
set my-coalition-size sum [my-voting-weight] of member-states-here
set blocking-minority? my-coalition-size >= blocking-size-threshold
set winning-majority? my-coalition-size >= winning-size-threshold
end
to choose-coalition
if not blocking-minority? [
survey-other-positions
if my-coalition-size <= alternative-coalition-size [
join-other-coalition
]
]
end
to survey-other-positions
let other-positions other member-states with [distance myself > 0.01]
let closest-positions other-positions with-min [distance myself]
set alternative-coalition max-one-of closest-positions [my-coalition-size]
set alternative-coalition-size [my-coalition-size] of alternative-coalition
end
to join-other-coalition
let move-distance distance alternative-coalition
set heading towards alternative-coalition
forward move-distance
end
;; SYSTEM
to setup
create-member-states number-of-member-states
ask member-states [setxy random-pxcor random-pycor]
ask member-states [update-coalition-status]
end
to go
if all? member-states [blocking-minority?] [stop]
if any? member-states with [winning-majority?] [stop]
ask member-states [
update-coalition-status
choose-coalition
update-coalition-status ]
tick
ask member-states [update-coalition-status]
end