Proteolysis in milk is brought about either by bacterial or native proteinases naturally found in milk (Nielsen, Reference Nielsen2002). Plasmin (EC 3.4.21.7) is part of a complex system consisting of plasminogen (PG), plasminogen activators (PA), plasminogen activator inhibitors (PAI), plasmin (PL) and plasmin inhibitors (PI) (Crudden & Kelly, Reference Crudden and Kelly2003). It is an alkaline serine proteinase with an optimum pH of 7·5 at 37°C, which readily hydrolyses β-casein, αs2-casein and (more slowly) αs1-casein (Bastian & Brown, Reference Bastian and Brown1996). It causes breakdown of milk proteins in a variety of dairy products, which results in changes in texture and flavour of these products (Ma & Barbano, Reference Ma and Barbano2003). It plays a positive role in cheese ripening for many varieties of cheese such as Swiss, Gouda and Romano (Borda et al. Reference Borda, Loey, Smout and Hendrickx2004). The negative effects of plasmin include involvement in age-gelation in UHT milk (Datta & Deeth, Reference Datta and Deeth2001), bitterness and other off-flavours in dairy products (Ma & Barbano, Reference Ma and Barbano2003) and reduction in coagulation of milk and cheese (Mara et al. Reference Mara, Roupie, Duffy and Kelly1998). Plasmin is highly resistant to heat treatment and is also able to reactivate during storage, thereby reducing shelf life of milk and milk products (Bastian & Brown, Reference Bastian and Brown1996). It survives pasteurisation and many UHT processes. The inhibitors present in fresh milk are heat labile whereas the activators are known to be heat stable (Richardson, Reference Richardson1983). Hence further activation of plasminogen may occur during storage. A further complication is autolysis of plasmin during storage. Plasmin activity cannot be totally eliminated by thermal processing without rendering the milk unpalatable. The best approach to minimizing the impact of proteolysis is to ensure a high quality raw milk.
Due to economic constraints in developing countries, the sensitive methods that are currently used to monitor proteolysis are too expensive for routine analysis in dairy laboratories. Even in developed countries, there is no routine test that is recommended for quality assurance to be able to identify raw milk with high proteolytic activity, in order to prevent it being used for products where it might cause problems such as UHT milk and milk powders. Therefore there is a great need to assess the current methods and recommend a method to be used for such purposes.
The objective of the present study was thus to assess the four commonly used methods in the detection of proteolysis (TNBS, fluorescamine, RP-HPLC and gel electrophoresis) in terms of sensitivity, reliability and accuracy.
Materials and Methods
Commercial UHT skim milk was supplied by Dairy Crest, Shropshire, UK, and utilised within 2 weeks of production. Sodium azide 0·05% (w/v; Sigma-Aldrich, Gillingham, UK) was added to milk samples before incubation to inhibit bacterial activity. Unless otherwise stated, all experiments were carried out at the natural pH of the milk. All reagents were from Fisher Scientific UK Ltd (Leicestershire, UK) unless stated otherwise.
Human plasmin (6·4 units/mg protein; Sigma-Aldrich, St Louis, USA) was added to commercial UHT skim milk at 8·71×10−3, 26·1×10−3 and 261×10−3 units/l to study its effect on proteolysis. Richardson, (Reference Richardson1983) found that the levels of plasmin in raw milk were between 0·15–0·37 mg/l. Thus, the lower levels (8·71 x10−3, 26·1 x10−3 units/l) used in this study correspond to 0·1 and 0·3 mg/l which is similar to the levels found in milk. The upper level however (261×10−3 units) was ten times the levels found in milk, and was particularly chosen so as to predict or observe the behaviour of plasmin at such high levels. One unit of plasmin enzyme will produce one μmol of p-Nitroanilide from D-Val-Leu-Lys-p-Nitroanilide per min at pH 7·5 at 37°C. Samples were incubated at 37°C for 7 days. They were taken at 0, 3 and 7 days for analysis of proteolysis by the four selected methods.
Clarification procedures were carried out after incubation for all milks studied. Prior to clarification, milk samples were heated and held in a water bath (Grant Instrument Cambridge Ltd, Cambridge, UK) at 100°C for 10 min to denature the whey proteins. The 6% trichloroacetic acid (TCA) soluble extracts were obtained by mixing equal volumes (5 ml) of 12% (w/v) TCA and milk, and standing for 1 h before filtration through Whatman no. 41 filter paper, washing and making up to 10 ml. For isoelectric precipitation at pH 4·6, 50 ml warm water (40°C) was added to 5 ml milk followed by 0·5 ml 10% (w/v) acetic acid. After standing for 10 min, 0·5 ml 1 m-sodium acetate was added and placed in cold water for 10 min before filtration through Whatman no. 41 filter paper and washing and making up to 100 ml. The clear extracts obtained for both methods were further filtered by 0·2 μm Millipore filter before being subjected to the TNBS, fluorescamine and RP-HPLC methods. It should be noted that the TCA soluble extracts involved a 2-fold dilution of the original milk, whereas the pH 4·6 soluble extracts were diluted 20-fold.
For gel electrophoresis, the urea-PAGE protocol (Bio-Rad Labs, Richmond, California, USA) was used in which 100 μl non-filtered plasmin added samples were mixed with 400 μl reducing sample buffer. These were left to stand in warm water 45°C for 5 min and allowed to cool to 25°C before they were loaded onto 12% gels. Staining was done by adding Coomasie brilliant blue G 250 mixed with methanol and acetic acid whereas destaining was accomplished by mixing methanol and acetic acid.
Analysis by RP-HPLC was performed on Dionex chromeleon equipment consisting of a P580 pump (Dionex Corporation, Munich, Germany) with a photodiode array detector (Dionex PDA-100), an automated sample injector and a C18, 5 μm, 80 Å, 150×4 mm STH 585 version 2.5 HPLC column compartment with reverse phase column (SGE 150 GL4-C-P-8/5, Melbourne, Australia) at 40°C. Data analysis was computed by the Chromeleon Datasystem software v. 6.50 SP4 Build 1000. The flow rate was 0·75 ml/min and detection was by a UV detector at 210 nm. Solvent A was 0·1% (v/v) trifluoroacetic acid (TFA) in HPLC grade water whereas Solvent B was 0·1% (v/v) TFA in HPLC-grade acetonitrile. The volume injected was 50 μl. During the first 25 min, solvent B was increased from 15 to 35%. After 5 min, it was increased to 100% solvent B and held for 10 min. The column was then equilibrated at 15% solvent B for 10 min in readiness for the next sample injection. The peptides were quantified by integration of peak areas, and expressed as the sum of peak areas.
The TNBS method was carried out as described by McKellar (Reference Mckellar1981). Duplicate samples of pH 4·6 and 6% TCA soluble extracts (0·2 ml) were mixed with 2 ml 1 m-potassium borate buffer (pH 9·2) and 0·8 ml 5 mm-TNBS(Sigma-Aldrich, Gillingham, UK). After 30 min incubation in the dark at 25°C, 0·8 ml freshly prepared 2 m-monobasic Na2PO4 [containing 18 mm-Na2SO3] and 5 ml distilled water were added. Absorbance was read at 420 nm by spectrophotometer (Cecil CE 1021 1000 series Cambridge, England).
The micro-method for fluorescamine (Castel et al. Reference Castel, Cervere and Marco1979) was adopted in this study, as small quantities of reagents were required. Duplicates of pH 4·6 and 6% TCA soluble extracts (0·1 ml) were placed in a sterilin bottle, followed by the addition of 0·1 ml potassium borate buffer (pH 8·5) and finally 0·1 ml fluorescamine (0·03% in acetone). The reaction was instantaneous and after 1 min, 3·5 ml potassium borate buffer (pH 8·5) was added. Fluorescence was determined with a spectrofluorimeter (Perkin Elmer LS-5 Luminescence spectrometer, Beaconsfield, Bucks, UK) after excitation at 390 nm and emission at 475 nm. The fluorescamine method was slightly modified due to off-scale readings on the spectrofluorimeter. This was done by diluting the samples (×10) with potassium borate buffer to provide on-scale readings.
Statistical analysis was carried out by using Statistical Package for Social Sciences (SPSS version 14). General Linear Model of analysis of variance (ANOVA) was used to determine statistical differences between means. LSD (Least Square Differences) and Duncan's multiple range tests were used to determine values that were statistically different (P <0·05).
All analyses were carried out in triplicate, and results are expressed as mean±standard deviation (sd).
Results
TNBS analysis
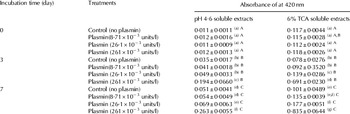
Proteolysis as a function of incubation time was evaluated by monitoring absorbance at 420 nm for 7 days at 37°C (Table 1). It should be noted that the 6% TCA soluble extracts gave much higher readings throughout as they had been diluted 10 times less than the pH 4·6 samples. No significant differences in proteolysis were observed on day 0 for either pH 4·6 or 6% TCA soluble extracts with added plasmin.
Absorbance of pH 4·6 and 6% TCA soluble extracts of UHT skim milk incubated with or without added plasmin at 37°C for 7 days as analysed by the TNBS method at 420 nm

Different letters (lower case) on the same column show significant differences (P <0·05) per treatment per day; Different upper case letters on the same column show significant differences (P <0·05) for same treatment on different days; The experiment was repeated 3 times; * upper detection limit of the instrument
The TCA soluble extracts were diluted (×2), but pH 4·6 soluble extracts were diluted (×20)
For the pH 4·6 extracts, the increase in absorbance from day 0 to 3 was 3 times for the control, rising to 16 times with 261×10−3 units/l of added plasmin. It is clear that rate of activity increased roughly proportionally with the concentration of added enzyme. The 6% TCA soluble extracts gave lower proportional increases in absorbance, but clear increases in proteolysis with added enzyme can be seen after 3 days, with an approximate 6-fold increase at the highest enzyme addition. The trend continued between days 3 and 7 for both extracts, with significantly increased absorbance in controls, and proportionate increases with added plasmin. Absorbance results for the two soluble extracts were strongly correlated (R2 = 0·95).
Analysis by Fluorescamine
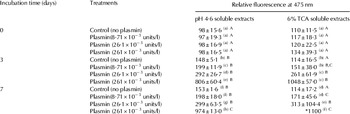
Proteolysis was monitored by measuring relative fluorescence produced in the two respective soluble extracts as shown on Table 2. The corresponding correlation (R2) between pH 4·6 and 6% TCA soluble extracts was 0·98. As expected, there were no significant differences in proteolysis between samples on day 0 for both pH 4·6 and 6% TCA soluble extracts which was similar to the observations by the TNBS method (Table 1). For the control samples (Table 2) significant increases in fluorescence were observed on days 3 and 7 compared with day 0 for the pH 4·6 soluble extracts, again presumably due to indigenous enzyme. However, no significant increases were observed for the TCA soluble extracts.
Relative fluorescence of pH 4·6 and 6% TCA soluble extracts of UHT skim milk incubated at 37°C for 7 days as analysed by the fluorescamine method at 475 nm

Different letters (lower case) on the same column show significant differences (P <0·05) per treatment per day; Different upper case letters on the same column show significant differences (P <0·05) for same treatment on different days; The experiment was repeated 3 times; * upper detection limit of the instrument
Both the TCA soluble extracts and the pH 4·6 soluble extracts were diluted ×20
The addition of plasmin at all levels gave rise to significant increases in fluorescence in both extracts, roughly in line with the concentrations of added enzyme, after 3 and 7 days. However, the changes between 3 and 7 days were less pronounced than those observed with TNBS. This could be due to sample dilution (20 × for both soluble extracts).
Analysis by RP-HPLC
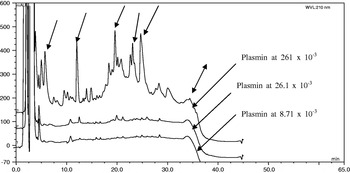
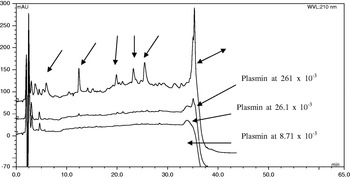
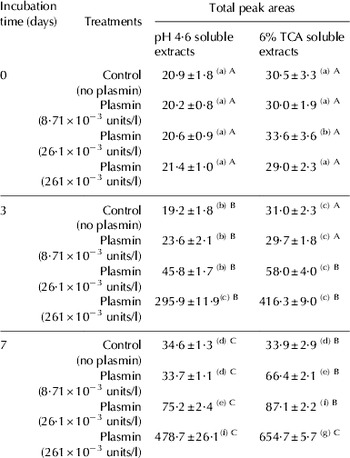
To examine the breakdown products of proteolysis in milk by added plasmin during storage, pH 4·6 and 6% TCA soluble extracts were analysed by RP-HPLC. Figures 1 & 2 show increasing peptide peaks as plasmin levels were increased in both extracts on day 7. It should be noted that peak heights were higher for 6% TCA than pH 4·6 extracts due to the different dilution factors. The peak areas from the two lower levels of added plasmin samples however, were very low in both extracts compared with those with 261×10−3 units/l added plasmin. This is further indicated with data in Table 3 which gives total peak areas on days 0, 3 and 7. In both Figs 1 & 2, five similar prominent peaks were observed at 261×10−3 units added plasmin (see single sided arrows). However, the peptide eluted at 35 min in pH 4·6 soluble extract was absent in 6% TCA (double-sided arrow) indicating precipitation by the TCA. For pH 4·6 soluble extracts, peptide increase in control and at 8·71×10−3 units/l added plasmin between days 0 and 3 was within the same range indicating low proteolytic activity in these samples. However, significant increases in proteolytic activities on these samples on day 7 indicate that significant activities were present after incubation for one week. At 26·1×10−3 and 261×10−3 units/l added plasmin, the peptide peak areas increased by two-fold and more than ten-fold respectively on day 3, and it had increased by almost a further two-fold by day 7 (Table 3). Very similar trends were observed for the 6% TCA soluble extracts and hence a strong correlation (R2 = 0·928) between peptide peak areas in the pH 4·6 and 6% TCA soluble extracts was found. As noted earlier, the 6% TCA extracts gave higher values than pH 4·6 extracts, mainly due to higher sample dilution of the latter.
RP-HPLC chromatogram of 6% TCA extracts of added plasmin at 8·71×10−3, 26·1×10−3 and 261×10−3 units/l after 7 days of incubation at 37°C detected at 210 nm.

RP-HPLC chromatogram of pH 4·6 soluble extracts of plasmin added at 8·71×10−3, 26·1×10−3 and 261×10−3 units/l after 7 days of incubation at 37°C detected at 210 nm.

Total peak areas of pH 4·6 and 6%TCA soluble extracts of UHT skim milk with or without added plasmin incubated at 37°C for 7days as analysed by the RP-HPLC method

Different letters (lower case) on the same column show significant differences (P <0·05) per treatment per day; Different uppercase letters on the same column show significant differences (P <0·05) for same treatment on different days; The experiment was repeated 3 times; * upper detection limit of the instrument
The TCA soluble extracts were diluted (×2), but pH 4·6 soluble extracts were diluted (×20)
Analysis by gel electrophoresis
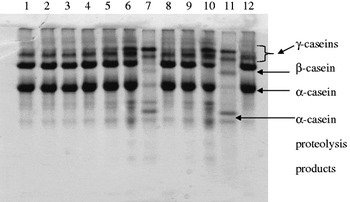
Proteolysis was also monitored by using gel electrophoresis to qualitatively indicate the disappearance of intact milk proteins and large polypeptides and also observe some newly formed proteolysis products. This technique was used to identify breakdown products of proteolysis after incubation with added plasmin at 37°C for 7 days (Fig 3). The bands on lanes 1–3 were all similar to the control (lane 4), demonstrating that no significant casein breakdown occurred on day 0. On the third day, however, gradual breakdown of caseins resulted in the formation of new bands (γ-caseins) on lanes 5 and 6, above β-casein. Samples with 261×10−3 units/l added plasmin showed a faster rate of breakdown of both α- and β-casein bands (which had almost disappeared) with the concomitant formation of γ-caseins. The three faint bands below the α-casein, which also appeared on lanes 5 and 6 are α-casein proteolysis products. Although these bands had low intensity on day 0 (lanes 1–4), they became denser with time (lanes 6 and 7; lanes 10 and 12). On day 7, both the α- and β-casein bands had completely disappeared from lane 11, indicating extensive proteolysis. On day 7 (lane 11), the β- and α-casein proteolysis products had higher intensities than on day 3 implying more products had been formed as a result of casein breakdown. On the third day of incubation, samples of milk with 261×10−3 units/l added plasmin appeared slightly yellow indicating a high level of proteolysis. This observation is supported by Datta & Deeth (Reference Datta and Deeth2003) who reported that when the milk was approaching the point of gelation, viscosity was high but decreased thereafter when the gel broke up or was clarified by further proteolysis. The same authors also explained that with more time, proteolysis increased and reached the highest level when the milk's viscosity returned to a low level.
Urea PAGE electrophoretogram (T=12%, C=4%, pH 8·9) of UHT skim milk inoculated with plasmin at various levels and incubated for 7 days at 37°C. Lanes 1–3: plasmin treated milk (8·71×10−3, 26·1×10−3 and 261×10−3 units/l) on day 0. Lane 4: Control UHT milk on d 0. Lanes 5–7: plasmin treated milk (8·71×10−3, 26·1×10−3 and 261×10−3 units/l) on d 3. Lane 8: Control UHT milk on d 3. Lanes: 9–11: plasmin treated milk (8·71×10−3, 26·1×10−3 and 261×10−3 units/l) on d 7. Lane 12: Control UHT milk on d 7.

Discussion
The basic principle of the TNBS and fluorescamine methods is that free amino groups produced by proteolysis can be measured, in the former case by the production of a yellow coloured derivative measurable by spectrophotometry and in the latter case by the production of a fluorescent complex using a non-fluorescent reagent. The HPLC and electrophoretic methods, on the other hand, directly observe changes in the peptides and proteins resulting from proteolysis. In contrast to the TNBS and fluorescamine methods which give larger results when several small peptides are available, the electrophoresis gels are good for showing larger fragments resulting from proteolysis.
A similar trend of increased proteolysis with time was observed by Datta & Deeth (Reference Datta and Deeth2003) when plasmin was added at higher levels. Although the levels of plasmin added by the latter authors were much higher (1000 and 2000 mg/l), the incubation time was only for 3 h at 40°C. The lower absorbance readings in pH 4·6 soluble extracts compared to 6% TCA soluble extracts were mainly due to sample dilution. Measurements from the two soluble extracts show strong correlation (R2 = 0·95) and thus this method proved to be useful for the determination of proteolysis in milk. In addition, the TNBS protocol was able to detect low levels of added plasmin. This suggests that the TNBS protocol is a useful technique to study proteolysis and may be used for the purpose of routine monitoring of proteolysis in the laboratory because it is also relatively cheap compared with other methods. This method was also recommended as an indicator of shelf life studies since it could detect proteolysis prior to development of off-flavours which is crucial for quality assessment (McKellar, Reference Mckellar1981).
The fluorescamine method was highly recommended by Beeby (Reference Beeby1980) and it was also claimed to be superior to TNBS (Schwabe, Reference Schwabe1973). Other researchers recommended it as a sensitive method for measuring protease activity that is specific for primary amino groups and free of interference (Chism et al. Reference Chism, Huang and Marshall1979). The method was regarded by Kwan et al. (Reference Kwan, Nakai and Skura1983) to be the most reliable followed by TNBS, absorbance at 280 nm and finally the Lowry method. This implies that the fluorescamine method is suitable and sensitive for monitoring proteolysis of added plasmin in milk.
The trend of increased proteolysis with time was also observed clearly with RP-HPLC. The five prominent peaks observed were obviously soluble in both extracts indicating that they were not precipitated by 6% TCA. In addition, this method provided a useful feature whereby peptide peaks eluted at 35 min by the pH 4·6 soluble extracts could be differentiated from the 6% TCA extracts which did not have a peak during this time. It is obvious that the latter peptides were precipitated by TCA and hence were not seen in the chromatogram. This observation was also reported in other studies (Lopez-Fandino et al. Reference Lopez-fandino, Olano, San jose and Ramos1993; Datta & Deeth, Reference Datta and Deeth2003). Studies by Walstra & Jenness (1984) and also by Mulvihill & Donovan (Reference Mulvihill and Donovan1987) reported that the large peptides in the filtrates from plasmin digestion were probably proteose peptone components from β-casein as these peptides are soluble at pH 4·6 but not in 12% TCA.
There was a strong correlation (R2 = 0·928) between measurements from pH 4·6 and 6% TCA soluble extracts, even though the peak areas for the 6% TCA extracts were higher than pH 4·6 extracts, mainly due to higher sample dilution of the latter. However, it should be noted that although the former extracts were expected to be 10 times higher than the latter, this was not evident in Table 3 as compared with results in Table 1 (absorbance). This is presumably due to the precipitation of some peptides by the TCA as explained earlier, a phenomenon that was observed by other researchers (Lopez-Fandino et al. Reference Lopez-fandino, Olano, San jose and Ramos1993; Le et al. Reference Le, Datta and Deeth2006; Datta & Deeth, Reference Datta and Deeth2003).
It has been documented that plasmin preferentially hydrolyses β–casein (Bastian & Brown, Reference Bastian and Brown1996), which is found both in the hydrophobic core of the casein micelle and in the soluble fraction, especially at low temperatures. This is consistent with the results observed in this study. Plasmin is specific for peptide bonds to which lysine or arginine contribute to the carboxyl group (Kelly & McSweeney, Reference Kelly, Mcsweeney, Fox, and 2003). Plasmin activity on β-caseins results in the formation of γ-caseins (Fox & McSweeney, Reference Kelly, Mcsweeney, Fox, and 2003) which form 3% of total casein and represent the C-terminal segments, while the proteose peptones (PP) components PP 5, PP 8 s and PP 8F fractions represent the N-terminal segments (Andrews, Reference Andrews1978). The same author also reported that αs1-casein is less sensitive to hydrolysis by plasmin as compared with β-casein and αs2-casein. This fact was also supported by Snoeren & Riel (Reference Snoeren and Riel1979) who reported that β-caseins were 3 times more susceptible to attack by plasmin than αs1-caseins while extracellular proteinases of microbial origin attacked predominantly κ-casein with the formation of para-κ-casein. Richardson & Pearce (1981) also confirmed that disappearance of β-casein was more rapid in Swiss cheese with higher plasmin whereas Cheddar cheese contained the lowest concentration of plasmin and had least breakdown of β-casein indicating higher specificity of plasmin for hydrolysis of this particular casein.
To compare the results of the 3 quantitative methods, correlations between the data were investigated. In pH 4·6 soluble extracts, very strong correlations were found between measurements from TNBS and fluorescamine (R2=0·981), TNBS and RP-HPLC peak areas (R2=0·889) and fluorescamine and RP-HPLC peak areas (R2=0·868). The 6% TCA soluble extracts also revealed strong correlations between TNBS and fluorescamine (R2= 0·980), TNBS and RP-HPLC peak areas (R2= 0·972) and finally fluorescamine and RP-HPLC peak areas (R2= 0·967). In this respect, TNBS and fluorescamine methods were well correlated, as expected because they both measure free amino groups. Generally, it appeared that the RP-HPLC and fluorescamine methods were least correlated (R2 ⩽ 0·9). It was interesting to note that the TNBS method was strongly correlated to the fluorescamine and also to RP-HPLC.
The gel electrophoresis technique proved useful for qualitative analysis in monitoring proteolysis. However, the use of hazardous chemicals, poor resolution of lower molecular weight peptides (and probable loss of some small peptides which are not retained in the gel) and lengthy analysis, limits its application for routine laboratory analysis.
From a practical point of view, the RP-HPLC method is very accurate, sensitive, reproducible and sophisticated compared with the fluorescamine and TNBS methods. It has been reported that the limits of detection of proteinase activity determined by HPLC are approximately 600 times lower than those determined by the fluorescamine methods (Le et al. 2006). However, the requirement for expensive equipment would limit its use as a method for routine analysis in a quality assurance laboratory.
The advantage of the fluorescamine method is that it is simple, rapid and very sensitive to low levels of proteases. However, the main drawbacks of this method are its low upper detection limit, interference with TCA (the requirement to monitor and adjust pH of measurement at pH 8·5 in the presence of TCA presents a technical difficulty) as well as the requirement for expensive equipment (spectrofluorimeter), and hence it may be impractical for routine laboratory analysis.
Although the TNBS method was less sensitive than the fluorescamine method, it was still possible to detect lower levels of proteases as used in the current study. In addition to being simple and rapid, it also does not require expensive equipment. This method is therefore recommended as a method of choice for routine laboratory analysis, for example to ensure the quality of raw milk for use in UHT products or milk powders.
However, a problem still remains with practical application of all the methods, including TNBS, namely that little plasmin activity can be detected in fresh raw milks, even when high plasmin would be expected such as in late lactation milk (unpublished data). This may be because plasmin activity is largely controlled by the presence of naturally occurring inhibitors. One solution may be to store fresh raw milk samples at 37–40°C for 4 h (in the presence of an anti-bacterial agent such as sodium azide, which will obviate the possibility of detecting bacterial proteolysis) prior to the TNBS assay which should give a fairly rapid indication of samples with high plasmin levels. The exact cut-off level of such a test in relation to shelf-life of products would need to be determined.
The authors would like to thank the Association of Commonwealth Universities (ACU) for financial assistance for this study.