I. INTRODUCTION
The dielectric materials have a set of electromagnetic characteristics that are specific. The knowledge of their parameters is essential to meet the industrial requirements and integrate in good condition systems in their environment. Several methods of characterization exist, this method can be classified as, resonant techniques, free-space techniques, and transmission-line techniques.
Characterization of a dielectric sample at 2.45 GHz by any of this techniques is limited by conditions, for example the characterization at 2.45 GHz by the free-space technique requires expensive lenses and horn antennas, and a very large sample [Reference Wee1], the method of split cavity resonator is a resonant technique, the characterization at 2.45 GHz using this technique needs a sample having very large dimensions and a specific shape (square or circle) [Reference Janezic and Barker-Jarvis2, 3], other techniques need the preparation of the sample prior to characterization such as the transmission-line technique [Reference Yue, Virga and Prince4] and the split ring resonator [Reference Boybay and Ramahi5]; however, the sample preparation remains a challenging task.
To overcome these limitations, several methods in near-field microscopy have been developed for non-destructive characterization of non-homogeneous dielectric samples that does not have a well-defined geometrical form.
Several research groups have been developing the near-field microwave microscopy with different designs [Reference Farina6]. Most of the papers published in the near-field microwave microscopy present qualitative characterizations [Reference Tabib-Azar7–Reference Monti10], where no complex permittivity values are given. Some other publications on the near-field microscopy present the quantitative measurement of complex permittivity of dielectric samples [Reference Vlahacos, Steinhauer, Anlage, Wellstood, Dutta and Feenstra11–Reference Gao13]. The difference in the complex permittivity values presented in that paper and those referenced by other measurement techniques is quite high (15% in average). Thus the study of precision and sensitivity in these methods for small variations in dielectric constant was not accurate and complete.
Similarly, owing to fundamental limitations of a specific resonator design, the measuring frequency of this technique is limited to a single frequency, making it impossible to follow the evolution of the complex permittivity of the samples as a function of frequency. The only possibility is therefore to have one device or at least one resonator per characterization frequency.
In this paper, we present a specific device with a good sensitivity toward any variation in the physical characteristics of samples in the ISM band. We also present a new multi-frequency microwave characterization of sample (4–20 GHz) using a new measurement technique based on near-field microwave microscopy using only one resonator and device.
II. THEORY
To perform quantitative measurements using a resonant near-field scanning microwave microscope, theoretical analysis must be carried out on the electromagnetic field distribution around probe as its tip will interact with the samples. Gao et al . [Reference Gao13] have developed a simplified physical model of the coaxial λ/4 resonator for uniform and isotropic bulk dielectric material characterization. Since dielectric samples are placed in the near-field region of the tip, the electromagnetic interaction can be treated as quasi-static. Under this assumption they have used the image charge approach for samples with thickness much larger than the tip radius. The shifts in the dielectric resonator (DR) resonant frequency (f r ) and its unloaded quality factor (Q 0) caused by putting in contact the tip with a dielectric sample were calculated to the first-order approximation using the perturbation theory. The associated relationships are given by equations 1(a) and 1(b):
 $$\displaystyle{{\Delta f_r } \over {f_r }}=\displaystyle{{f_r - f{\rm ^{\prime}}_r } \over {f_r }}=A\left({\displaystyle{{\ln \lpar 1 - b\rpar } \over b}+1} \right)\, \, {\rm and} \, \, b=\displaystyle{{\varepsilon _r - 1} \over {\varepsilon _r+1}}\comma \;$$
 $$\Delta \left({\displaystyle{1 \over {Q_0 }}} \right)=\displaystyle{1 \over {Q_0 }} - \displaystyle{1 \over {Q{\rm ^{\prime}}_0 }}=- \lpar B+\tan \delta \rpar \displaystyle{{\Delta f_r } \over {f_r }}\comma \; $$
where f r and f' r are the resonance frequencies with and without samples, respectively, ε r is the relative permittivity of the sample. Q 0 and Q′0 are the unloaded quality factors in the presence and absence of samples, respectively. A and B are calibration constants determined by measuring the standard samples, with well-known dielectric constant and loss tangent at the used frequency.
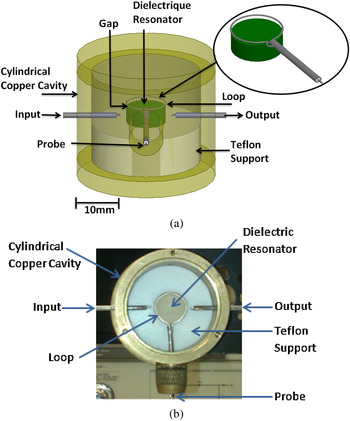
The structure used in the characterization of the sample is presented in Figs. 1(a) and 1(b). It is composed of a DR (ε r = 78, tanδ = 3.27 × 10⁻⁴ at 2.5 GHz) having a diameter of 15 mm and a height of 7 mm, a Teflon support, a copper cavity having a diameter of 53 mm and a height of 35 mm and a coaxial cable. The DR is placed on a Teflon support, the resonator and the support are placed in the copper cavity, and a coaxial cable is denuded in its both ends: the first end takes the form of a tip, while the second end has the form of a loop. This loop is positioned just above the resonator and its role is to disturb the resonator resonance mode once a sample is deposited in contact with the tip. The excitation of the TE011 mode of the DR is achieved using two magnetic loops presented in Fig. 1 (input and output). These loops are arranged horizontally (parallel to the plane r and θ of the resonator).
(a) Three-dimensional model of the device, (b) photography of the device.

III. MEASURING SYSTEM AND CALIBRATION TECHNIQUE
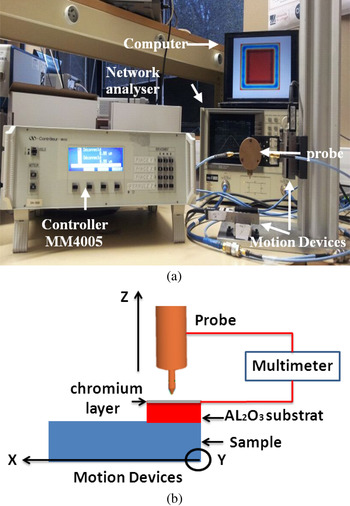
Our measuring system is composed of a vector network analyzer HP 8720C and a controller connected to a computer for the monitoring of micrometric displacements of the sample and the probe. The movements are done by means of three motion devices (Fig. 2(a)): two to control the displacement of the sample on the X–Y axis and the third to control the displacement of the probe on the Z-axis.
Measuring system.

The frequency, 2.45 GHz is measured by a vector network analyzer of the TE011 mode of the resonator when no dielectric samples are close to the measurement tip. At this frequency, traditional methods need large samples (>100 cm2) with arbitrary form (substrate, cylinder, resonator, etc.). However, the proposed solution only needs small size elements with non-uniform geometry.
The control of the probe–sample distance can be achieved via several means such as shear force, capacitance, photon tunneling, and electron tunneling [Reference Kim14]. In our measurement system, we use a different technique for probe–sample distance control. This technique is based on current control. The first step is to use an Al2O3 substrate (surface = 4 mm2 and thickness = 0.4 mm) with a 100-nm-thick chromium layer on its top surface. Then a multimeter is connected between the coaxial probe tip and the chromium layer (Fig. 2(b)). The probe comes down in the direction of the sample with a 1-μm step until there is a short circuit, meaning that there is a contact between the probe and the chromium layer. At this moment, the gap between the tip and the sample to be characterized is known to be 400 µm (thickness of the Al2O3 substrate). After this we pick up the tip, the sample is moved by the motion devices along the axes X and Y and the probe is back down by about 400 µm to be just in contact with the sample. The movement of the tip, on the last microns, is controlled by monitoring the resonant frequency shift.
IV. OPTIMISATION OF THE COUPLING BETWEEN THE DR AND THE PROBE
If we consider equations (1a) and (1b) we can clearly see that we have to calculate the constants A and B to determine the complex permittivity of a sample. These constants are determined by measuring the resonant frequency of a standard sample with a well-known complex permittivity at the used frequency. For that purpose, we took an Alumina substrate as a standard sample and we obtained by the resonant cylinder resonator method (split cylinder resonator (SCR)) its dielectric parameters: ε r =9.7 ± 0.08 and tanδ = 7 × 10⁻⁴ ± 0.4 × 10⁻⁴. Having A and B, we are now able to determine the permittivity from a frequency and quality factor shift obtained when a sample is placed in front of the probe. A study is carried out on the coupling between the DR and the coaxial cable loop. We can see that constant A in equation (1a) depends on the permittivity of the standard material and frequency offset in the presence of this material. The frequency shift increases as the value of A increases. For the same standard material, the value of A can increase if we have a stronger coupling between the probe and the DR. In our case, the coupling depends on the gap between the coaxial cable loop and the DR. The closer is the loop to the DR, the greater is the coupling. This relation is given by equation (2a):
 $$A=\lpar\!\! - 0.38G+2.7\rpar \times 10^{ - 3}\comma \; $$
 $$Q_0=315G+231\comma \; $$
where G is the gap (mm) between the loop and DR.
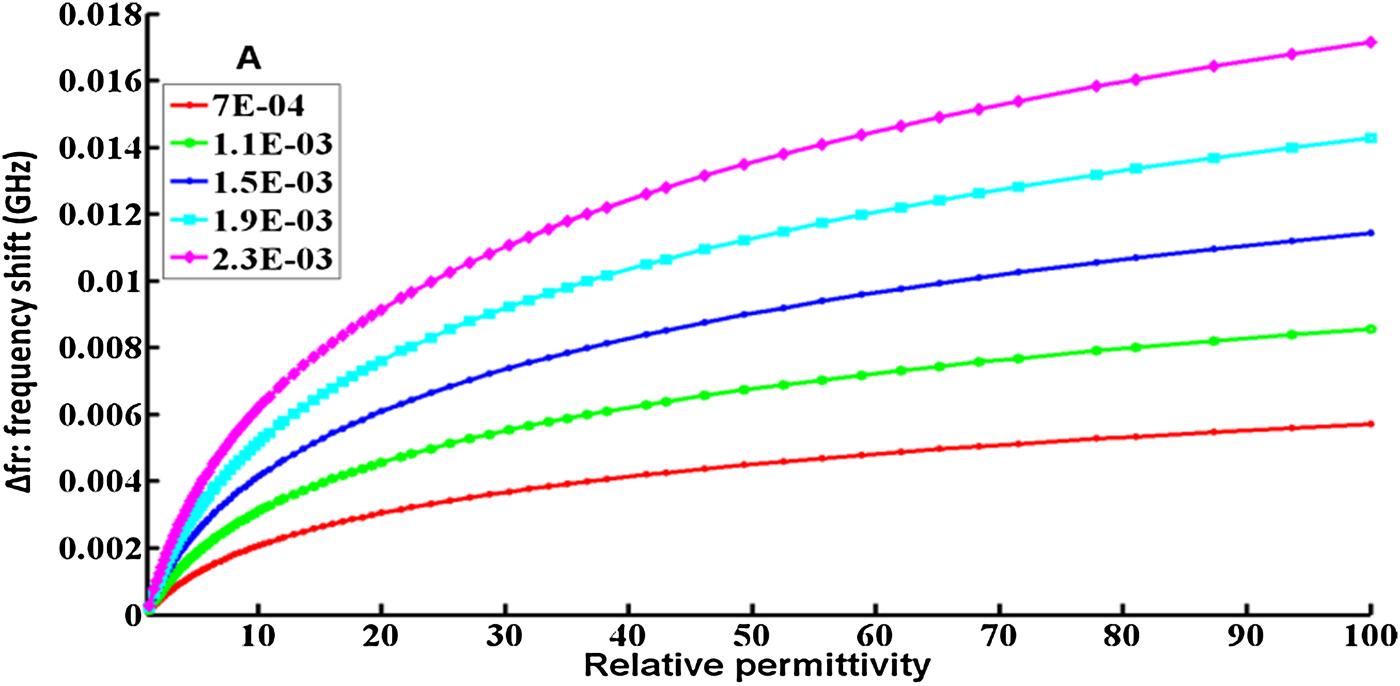
For each values of A we can plot the curve representing the frequency shift as a function of permittivity based on equation (1a). As shown in Fig. 3, we can clearly see that the greater is A (smaller the gap between the DR and loop), better the sensitivity over small variations in dielectric constants is. For example, for a gap of 5 mm, the value of A is equal to 7 × 10⁻⁴. For this value of A the frequency difference between two close permittivities (10.1 and 10.9) is 125 KHz. However for a gap of 1 mm, the value of A is 2.3 × 10⁻³ and the frequency difference between two close permittivities (10.1 and 10.9) is 400 KHz.
Variation of frequency as a function of the permittivity for different value of A.

With a strong coupling (gap <1 mm) between the metal loop and DR, a strong degradation of quality factor and a saturation of the offset frequency Δf r are observed. Indeed the experimentally extracted relation between the quality factor and the gap is a linear function (equation 2(b)). The closer is the loop to the DR, the lower is the quality factor.
As a result, we decide to choose two configurations of coupling: the first configuration is a strong coupling dedicated to the measurements with good sensitivity of the samples permittivity (high Δf r ). This configuration improves the accuracy of the characterization technique even with small variations of permittivities. The second configuration is a weak coupling and is best suited for the characterization of the samples loss tangent with more accuracy. This configuration can maximize the unloaded quality factor of the resonator and consequently the sensitivity of the probe when measuring loss tangent.
IV. CHARACTERIZATION OF MATERIALS
After the optimization of the gap to increase the sensitivity of the system to complex permittivity measurement, we characterized several dielectric samples having non-homogeneous forms and different dimensions. The experimental measurements show that an accurate characterization by the proposed technique requires a sample with a plan surface of 25 mm2. This is due to the side radiation of the tip. This surface is determined by measuring the lateral electric field radiation from the tip used in the measurements. If a sample has a surface larger than 25 mm2, the electric field of the tip reacts only with an area of 25 mm2 of the sample and the rest of the sample is not seen by the tip field. Thus the shape of the sample outside the area 25 mm2 does not change the response of our probe because it is not seen by the electric field of the tip. Hence, so if we have samples of circular, triangular, or rectangular form, or even samples that do not have a determined form, all can be characterized with our technique. In comparison with other characterization techniques at 2.45 GHz, these techniques need large sample surface. For example, the free-space characterization technique at 2.45 GHz requires a sample of 96 102 mm2 [Reference Wee1], and the Split cavity resonator technique at 2.45 GHz need a sample of 40 000 mm2 [Reference Janezic and Barker-Jarvis2, 3].
Table 1 shows the permittivity and the loss tangent (with uncertainties) at 2.45 GHz for different samples. The samples characterized in Table 1 have different dimensions and shapes but all have a plan surface of 25 mm2 and thickness of 0.7 mm. The uncertainties on ε r are calculated from the uncertainty of VNA and measurement devices (1%), and the uncertainty on previous measurement of our Alumina sample used to calculate constant A (equation (1a): 1%) and the uncertainty of contact between the tip and the sample (~3%). The uncertainty on the measurement of the reference Alumina sample leading to the determination of B (equation (1b)) leads to an estimated error of 8% on tanδ. In comparison with other near-field quantitative characterization methods the uncertainties of the complex permittivity value obtained by our characterization method, is very low. For example, Vlahacos et al. in his paper [Reference Vlahacos, Steinhauer, Anlage, Wellstood, Dutta and Feenstra11] has an uncertainty of about 30% on relative permittivity. However, he was not able to measure the loss tangent of the samples due to the low quality factor of their probe coupled to a coaxial resonator. A second paper published by Barker et al. [Reference Barker, Suherman, Jackson and Lancaster12] on the quantitative characterization of dielectric samples with the technique of near-field microscopy also had a measurement uncertainty of over 25% on the values of relative permittivity and loss tangent.
Determination and comparison of complex permittivity.

*Characterized with the SCR method.
V. MULTI-FREQUENCY CARACTERIZATION
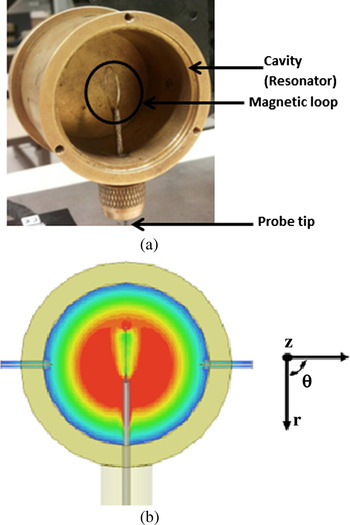
The device that was used to characterize the materials at 2.45 GHz is also used in multi-frequency characterization but this time using the resonance frequencies of the cavity instead of the resonance frequency of the DR as shown in Figs. 4(a) and 4(b).
(a) Photography of the cavity, (b) Magnitude of the electrical field in the plan (r, θ) of the fundamental mode TM010.

After studying TM and TE modes of the cavity (using both orientations of magnetic loops between 1 and 20 GHz), it was noted that the TM modes are generally more perturbed when a sample is close to the probe. Six TM modes between 4 and 20 GHz were selected among the frequencies that are perturbed in the presence of the samples. Ansoft HFSS software gives us the confirmation that TM010, TM011, TM110, TM111, TM310, and TM120 modes are indeed excited by this coupling system and that the measured frequency are in concordance with the simulated ones. The standard material is also the Alumina and the sample to be characterized is the FERRO A6M (LTCC material).
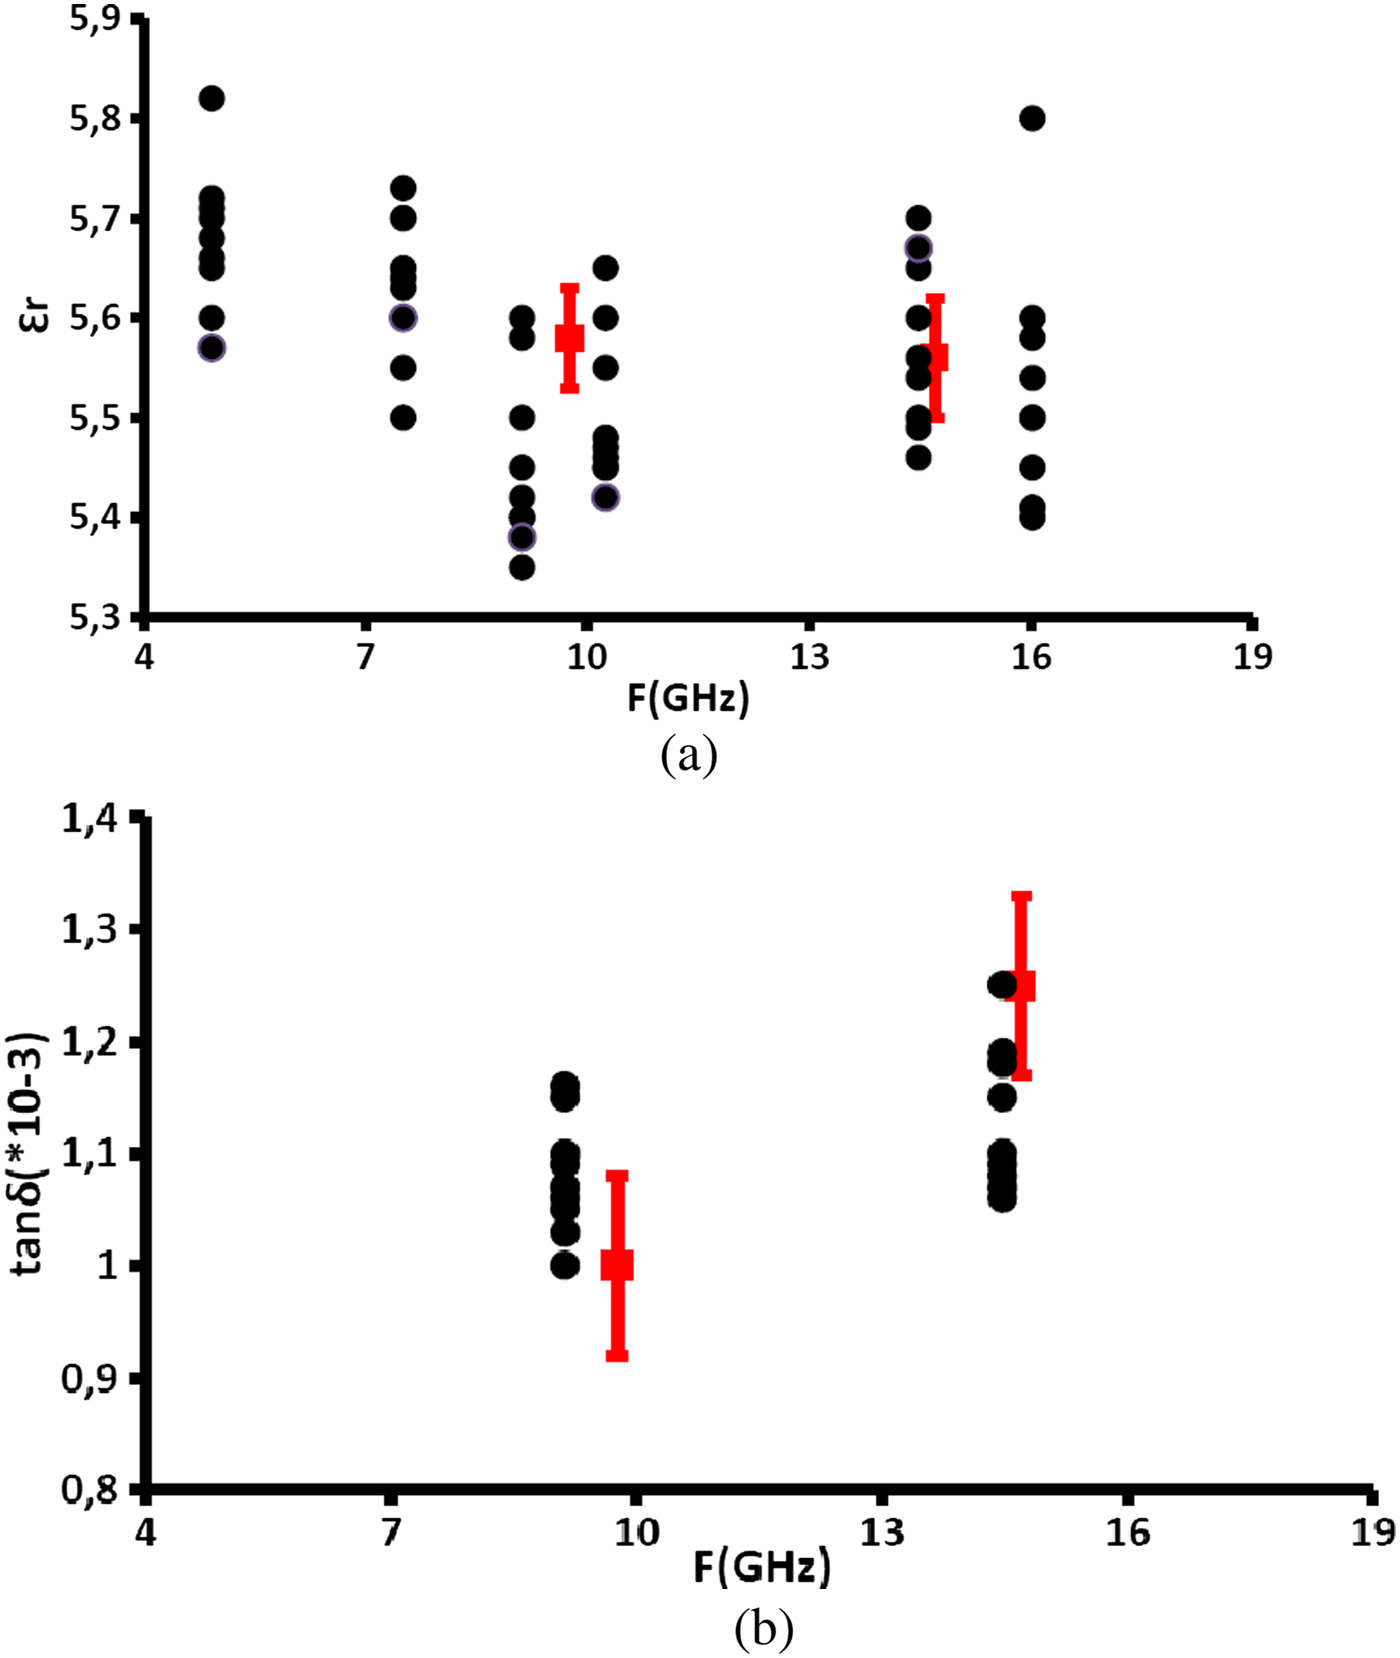
Figures 5(a) and 5(b) show the experimental points (in black) describing the variation of the permittivity and loss tangent of FERRO A6M as a function of frequency obtained by our measuring device. The uncertainty on the permittivity for all modes is 5%. Only the TM120 mode at 16 GHz has an uncertainty of 8% (low-frequency shift). The lack of values for the measurement of the loss tangent is due to the low-quality factor for some modes, which limits the sensitivity on the loss tangent. However, for the modes TM110 and TM310 the unloaded quality factor is higher than 2000, which allows us to calculate the loss tangent of FERRO A6M for these two frequencies with an uncertainty of 12%. The other experimental points (Figs. 5(a) and 5(b) in red) show the relative permittivity and loss tangent of FERRO A6M obtained by SCR method using different dimensions of cavities and samples [Reference Alaaeddine15]. The uncertainty on the permittivity is 1 and 4% on loss tangent 4%. The results obtained by our method are very close to the results obtained by SCR but with a higher uncertainty.
(a) Wideband measurement of permittivity of FERRO A6M, (b) wideband measurement of loss tangent of FERRO A6M.

In the literature, and as mentioned in the Introduction, near-field microwave microscopy techniques are limited by a mono-frequency characterization of the samples and this is due to the limitation of the resonators used in the measurements. In this paper, we present a near-field technique able to characterize dielectric samples at several frequencies between 4 and 16 GHz with an uncertainty of 5% on the relative permittivity and 10% on the measurement of loss tangent. Thus, the real advantages of this technique compared with other quantitative characterization techniques based on near-field microscopy presented in the literature [Reference Monti10–Reference Gao13, Reference Haase and Jacob16] are its ability of performing characterizations on multiple frequency points and the low measurement uncertainties.
For measurements of complex permittivities on several frequency points with uncertainties smaller than that obtained by our technique, the split cylindrical cavity technique can be used. Characterization at several points using this cavity requires the use of multiple cavities and sample of different dimensions. However, our characterization technique needs only one sample and only one resonator.
Note that, usually to achieve a wideband characterization, the complex permittivity of the standard material should be known at all the measurement frequencies. However, the standard material used in our wideband characterization (4–16 GHz) is Alumina and the complex permittivity of this type of materials does not change too much in our frequency band. A characterization by the technique of SCR of this standard sample shows that its relative permittivity and loss tangent vary respectively only by 0.75 and 2.75% between 9 and 15.5 GHz. Since these two variations are low and since 9 GHz is the center frequency of our band (4–16 GHz), we proposed a simplifying hypothesis that consists of considering the permittivity and loss tangent of the standard material as constants on this band and equal to that obtained at the center frequency of 9 GHz. This simplifying hypothesis leads to 0.6 and 0.45% additional uncertainties on the values of relative permittivity and loss tangent of the Ferro A6M sample, respectively. Therefore, the errors led by our simplifying hypothesis remain low but can be avoided with the use of the exact permittivity used in calibration of the A and B factors.
VI. CONCLUSION
In conclusion, we have proposed a specific device with a DR to characterize the dielectric samples at 2.45 GHz. At this frequency, traditional methods need large samples (>100 cm2) with specific forms (substrate, cylinder, resonator, etc.). However, the proposed solution only needs small size elements, with non-standard geometry, but with the plane surface equal or greater than 25 mm2. Moreover, we present an optimization method to increase the sensitivity of our device toward any variation in the physical properties of the sample. The same device is used for a multi-frequency characterization (4–20 GHz) using the resonance frequencies of the cavity instead of the resonance frequency of the DR. The proposed near-field microwave microscopy device needs only one sample with no standard shape and is capable of giving its relative permittivity and loss tangent at different frequencies. Other techniques need in comparison with many samples and devices to give such results at different frequencies (SCR, DR, etc.) and other multi-frequency characterization methods (coaxial probe, free-space, etc.) give even lower accuracy for the same result.
 Jamal Rammal was born in Lebanon, in 1988. He received the Master's degree in Circuits, Systems, and Micro and Nanotechnology for optical and high-frequency communications from the University of Limoges, Limoges, France. He is currently toward the Ph.D. degree in High Frequency Communications in the XLIM Laboratory, University of Limoges. His research interests include microwave characterization of dielectric materials and microwave sensors.
 Olivier Tantot was born in Bordeaux, France, in 1965. He received the Ph.D. degree from the IRCOM Laboratory, University of Limoges, France in 1994. He is currently an Associate Professor at the Micro and Nanotechnologies for Optoelectronic and Microwave Components (MINACOM) Department, XLIM Laboratory, University of Limoges, Limoges, France.
 Nicolas Delhote was born in Limoges, France, in 1981. He received the Ph.D. degree from the XLIM Laboratory, University of Limoges, France in 2007. He is currently an Associate Professor at the Micro and Nanotechnologies for Optoelectronic and Microwave Components (MINACOM) Department, XLIM Laboratory, University of Limoges. He is currently an IEEE and MTT-S Society member.
 Serge Verdeyme was born in Meilhards, France, in June 1963. He received the Ph.D. degree from the University of Limoges, Limoges, France, in 1989. He is currently an Associate Professor at the Micro and Nanotechnologies for Optoelectronic and Microwave Components (MINACOM) Department, XLIM Laboratory, University of Limoges. He is a member of IEEE.