





1. Introduction
Tonal noise emerges as an undesirable effect due to the flow over an airfoil. For low and moderate Reynolds numbers, airfoils exhibit a distinctive ladder-type structure of tones with a dominant frequency and secondary equidistant peaks (Paterson et al. Reference Paterson, Vogt, Fink and Munch1973; Arbey & Bataille Reference Arbey and Bataille1983). Such characteristics motivated several studies in order to understand the mechanisms of airfoil aerodynamic self-noise generation (Arcondoulis et al. Reference Arcondoulis, Doolan, Zander and Brooks2010).
Yarusevych, Sullivan & Kawall (Reference Yarusevych, Sullivan and Kawall2006) experimentally examined coherent structures arising from the boundary layer and wake at low Reynolds numbers to understand the associated mechanisms and evolution. At low Reynolds numbers, the laminar boundary layer over the airfoil separates, and coherent structures in the separated shear layer were seen to correspond to Kelvin–Helmholtz vortices. It is known that the source of the tonal noise is related to the trailing edge, where such convected coherent hydrodynamic structures are correlated with the far-field noise (Jones, Sandham & Sandberg Reference Jones, Sandham and Sandberg2010; Sano et al. Reference Sano, Abreu, Cavalieri and Wolf2019). It is clear that tonal noise is related to a boundary or shear layer that is transitional (Pröbsting, Scarano & Morris Reference Pröbsting, Scarano and Morris2015), and several studies analyse the problem from different perspectives taking into account the relationship with the Reynolds and Mach numbers and the angle of attack. The current view is that tonal noise is the result of a feedback mechanism, with coherent structures that grow on a separated shear layer and are scattered as an acoustic wave at the trailing edge, which excites new disturbances in an upstream location, thus closing the loop (Fosas de Pando, Schmid & Sipp Reference Fosas de Pando, Schmid and Sipp2014; Sanjose et al. Reference Sanjose, Towne, Jaiswal, Moreau, Lele and Mann2019; Jaiswal et al. Reference Jaiswal, Pasco, Yakhina and Moreau2022; Ricciardi, Wolf & Taira Reference Ricciardi, Wolf and Taira2022).
Considering flows with low to moderate Reynolds numbers, Pröbsting et al. (Reference Pröbsting, Scarano and Morris2015) conducted an extensive experimental analysis of a NACA 0012 airfoil at a low angle of attack to identify the relation between the tonal noise and the flow structures. The study characterized coherent structures that are convected and scattered at the trailing edge, and concluded that they play a main role in the tonal noise and reinforcing the significance of such a phenomenon in the airfoil self-noise (Arcondoulis et al. Reference Arcondoulis, Doolan, Zander and Brooks2010; Abreu, Cavalieri & Wolf Reference Abreu, Cavalieri and Wolf2017; Sanjose et al. Reference Sanjose, Towne, Jaiswal, Moreau, Lele and Mann2019; Sano et al. Reference Sano, Abreu, Cavalieri and Wolf2019; Jaiswal et al. Reference Jaiswal, Pasco, Yakhina and Moreau2022; Ricciardi & Wolf Reference Ricciardi and Wolf2022). In addition, when considering the Reynolds number and angle of attack, they show that the problem can be separated between pressure-side and suction-side regimes in the tonal noise generation, based on the eventual suppression of tones if boundary layer transition is forced on one of the airfoil sides. This highlights that tonal noise is a transitional phenomenon, disappearing if boundary layers on both airfoil sides are turbulent.
Besides a main tone and its harmonics, indicating time-periodic sound radiation, multiple tones have been documented by experimental results (Moreau & Roger Reference Moreau and Roger2009; Takagi & Konishi Reference Takagi and Konishi2010; Padois et al. Reference Padois, Laffay, Idier and Moreau2016; Zang, Mayer & Azarpeyvand Reference Zang, Mayer and Azarpeyvand2019; Yakhina et al. Reference Yakhina, Roger, Moreau, Nguyen and Golubev2020) and numerical simulations (Jones & Sandberg Reference Jones and Sandberg2011; Ricciardi, Arias-Ramirez & Wolf Reference Ricciardi, Arias-Ramirez and Wolf2020; Ricciardi et al. Reference Ricciardi, Wolf and Taira2022), where the existence of one dominant frequency, harmonics and secondary tones is one of the signatures of the airfoil noise. The main tone and harmonics may be related to vortex shedding (Paterson et al. Reference Paterson, Vogt, Fink and Munch1973) or an acoustic feedback loop. (Tam Reference Tam1974; Longhouse Reference Longhouse1977; Tam & Ju Reference Tam and Ju2012). However, the reason why the flow exhibits secondary tones is still a question of debate (Golubev Reference Golubev2021).
Ricciardi et al. (Reference Ricciardi, Wolf and Taira2022) conducted a numerical simulation to analyse the trailing-edge tonal noise using large eddy simulation and linear stability theory of a NACA 0012 airfoil at a freestream Mach number of  $M_\infty=0.3$, angle of attack of
 $AoA=3^\circ$, and Reynolds number of
 $Re=5 \times 10^4$. The study shows that, using the theory of linear stability, the presence of a laminar separation bubble (LSB) enables a flow mechanism that amplifies disturbances in the flow. These results agreed with the previous analysis of Wu, Sandberg & Moreau (Reference Wu, Sandberg and Moreau2021), which concluded that the presence of a LSB and reattachment at the trailing edge are necessary conditions to start the feedback loop. It is important to emphasize that the linear stability theory, by construction, does not capture nonlinear interactions and is employed to describe the early stage of the perturbations (Sandham & Salgado Reference Sandham and Salgado2008; Suponitsky, Sandham & Morfey Reference Suponitsky, Sandham and Morfey2010; Jaiswal et al. Reference Jaiswal, Pasco, Yakhina and Moreau2022). Another critical aspect of the study is that the presence of the LSB plays a central role in the vortex shedding along the suction side of the airfoil, which can affect the value of the dominant tonal peak (Pröbsting & Yarusevych Reference Pröbsting and Yarusevych2015).
The present study intends to shed light on the problem of airfoil tonal noise, examining the emergence of the ladder-type structure of tones. To characterize the evolution of the flow as a function of the Reynolds number, we employ the theory of dynamic systems to interpret and analyse the data. Solutions will be characterized as periodic, quasi-periodic or chaotic, and tracking transitions between the various behaviours shows the origin of secondary peaks in the acoustic spectra.
The article is structured as follows. Section 2 introduces the numerical simulation applied in this work. Section 3.1 presents the wall pressure as a function of time, obtained at some representative positions, and phase portraits with the same pressure data. Section 3.2 investigates the chaotic behaviour signatures. In § 3.3, we show the auto-spectral density of the pressure, highlighting the emergence of the relevant frequencies of the problem. Section 4 presents the conclusions and discussion.
2. Numerical simulation
In this study, we use compressible direct numerical simulations (DNS) in a generalized curvilinear coordinate and conservative form (Wolf et al. Reference Wolf, Cavalieri, Backes, Morsch-Flho and Azevedo2015). The numerical method uses a sixth-order compact scheme implemented on a staggered grid for spatial discretization (Nagarajan, Lele & Ferziger Reference Nagarajan, Lele and Ferziger2003). The scheme also employs the compact filter method of Lele (Reference Lele1992). The implemented equations are non-dimensional, with length, velocity components, density, pressure and temperature normalized by chord,  $c$, free-stream speed of sound,
 $a_\infty$, free-stream density,
 $\rho _\infty, \rho _\infty a_\infty ^2$ and
 $(\gamma - 1) T_\infty$, respectively, where
 $\gamma$ is the specific heat ratio and
 $T_\infty$ the free-stream temperature (Wolf, Azevedo & Lele Reference Wolf, Azevedo and Lele2012; Ricciardi et al. Reference Ricciardi, Wolf and Taira2022). In figure 1, we show simulation results in terms of the
 $z$-vorticity field, showing the reversed flow within a separation wake for
 $Re=2.32 \times 10^4$ and
 $Re=2.42 \times 10^4$ and a LSB for
 $Re=2.66 \times 10^4$. The figures show vortex roll-up from a shear layer on the suction side. Vortex shedding is also observed from the trailing edge, on the pressure side, to counterbalance the airfoil's circulation variation.
Instantaneous  $z$-vorticity field; (a)
 $Re=2.32 \times 10^4$, (b)
 $Re=2.42 \times 10^4$ and (c)
 $Re=2.66 \times 10^4$.

In the Reynolds number regime studied here, the boundary layer separates at the suction side of the airfoil and does not reattach. Figure 2 shows the extension of the separation wake along the suction side of the profile and the wall-normal distance of the  $u=0$ line, where we observe that there is no reattachment. The results show a different behaviour for
 $Re=2.66 \times 10^4$ compared with the two other Reynolds numbers, with a time-averaged reattachment shortly upstream of the trailing edge; this will be further explored later.
Averaged  $u=0$ lines for
 $Re=2.32 \times 10^4$ (——, blue),
 $Re=2.42 \times 10^4$ (——, orange) and
 $Re=2.66 \times 10^4$ (——, yellow);
 $y_n$ corresponds to the normal distance between the line of
 $u=0$ and the upper surface of the NACA 0012 airfoil.

The mesh employed in the simulations is of the O-type with  $660 \times 600$ points in the azimuthal and normal directions, with a domain size of
 $30c$. This configuration is the same as that used by Ricciardi et al. (Reference Ricciardi, Arias-Ramirez and Wolf2020, Reference Ricciardi, Wolf and Taira2022). It is important to mention that the previous authors performed a mesh refinement study and determined that the present mesh had sufficient resolution to capture the two-dimensional flow instabilities and acoustic radiation accurately. Here, we employ the same mesh for lower Reynolds numbers and assume it provides accurate results. We consider a NACA 0012 airfoil with a rounded trailing edge of radius equal to
 $r=0.004c$.
In order to study how the flow dynamics develops, and with a focus on obtaining the transition of a time-periodic solution to a quasi-periodic solution and, then, to chaos, a systematic approach is employed to hooking blocks of time step data by changing the Reynolds number. To that end, for each new Reynolds number case, we use the results of the last iteration of the previous simulation as a starting point. With this method, we are able to obtain the bifurcation diagram, as we will show in the subsequent sections. For each simulation, 24 convective time units were considered, based on the airfoil chord and free-stream velocity, sampled with  ${\rm \Delta} t = 0.006$, leading to 4000 samples per simulation. The Reynolds number
 $Re$, based on the airfoil chord, is monotonically increased in successive simulations, whereas the Mach number is held fixed at 0.3. For each simulation, 4000 snapshots were collected for analysis. Reynolds number is kept constant for each simulation, and successive runs at higher
 $Re$ start from the final snapshot of the preceding, lower
 $Re$. This allows tracking of the flow behaviour and characterizes bifurcations of solutions. The present study comprises 120 simulations (from
 $Re=3.2 \times 10^3$ to
 $Re=2.70 \times 10^4$, with steps of
 ${\rm \Delta} Re = 200$). The angle of attack for all simulations was taken as
 $3^\circ$. For the first simulation, carried out at
 $Re=3.2 \times 10^3$, the flow shows a permanent behaviour after discarding a long time series of 156 convective time units to ensure that transients do not influence results.
The present study focuses on the range  $2.34 \times 10^4\leq Re \leq 2.66 \times 10^4$, where we observe a transition to quasi-periodicity and chaos. Some results are nonetheless presented with
 $Re$ between
 $3.2 \times 10^3$ and
 $2.32 \times 10^4$, with solutions displaying a limit cycle behaviour.
3. Results
3.1. Phase portraits of wall pressure and Poincaré sections
To show the evolution of the dynamics as the Reynolds number is increased, we will analyse wall-pressure results at representative positions near the trailing edge,  $x/c=0.70, x/c=0.80$ and
 $x/c=0.90$. Figure 3 shows a first transition of the dynamics using the root-mean-square (RMS) of the pressure at
 $x/c=0.70$, showing that for the lowest
 $Re$ considered here, the airfoil displays steady flow, with negligible fluctuations, as illustrated by the sample wall-pressure RMS value. Above
 $Re=4 \times 10^3$, the flow becomes unsteady, with time-periodic behaviours, as will be shown in what follows. Figure 4 shows results in terms of the temporal wall-pressure signals and their phase portraits for
 $Re=2.34 \times 10^4, 2.38 \times 10^4$, and
 $2.42 \times 10^4$, followed by figure 5, which depicts the phase portrait for a quasi-periodic flow at
 $Re = 2.42 \times 10^4$. Then, figures 6 and 7 present further results for
 $Re=2.46 \times 10^4, 2.50 \times 10^4$ and
 $2.54 \times 10^4$, and for
 $Re=2.58 \times 10^4, 2.62 \times 10^4$ and
 $2.66 \times 10^4$, respectively.
Wall-pressure RMS from  $Re=3.2 \times 10^3$ to
 $Re=1.22 \times 10^4$ at
 $x/c = 0.70$.

Wall pressure and phase portraits as a function of Reynolds number, from  $Re=2.34 \times 10^4$ to
 $Re=2.42 \times 10^4$. The pressure fluctuations are obtained at
 $x/c=0.70$ (——, blue),
 $x/c=0.80$ (——, orange) and
 $x/c=0.90$ (——, yellow); (a)
 $Re=2.34 \times 10^4$, (b)
 $Re=2.38 \times 10^4$ and (c)
 $Re=2.42 \times 10^4$.

Pressure phase portraits at  $Re=2.42 \times 10^4$. The pressure fluctuations are obtained at
 $x/c=0.70, x/c=0.80$ and
 $x/c=0.90$ following the axis coordinates.

Wall pressure and phase portraits as a function of Reynolds number, from  $Re=2.46 \times 10^4$ to
 $Re=2.54 \times 10^4$. The pressure fluctuations are obtained at
 $x/c=0.70$ (——, blue),
 $x/c=0.80$ (——, orange) and
 $x/c=0.90$ (——, yellow); (a)
 $Re=2.46 \times 10^4$, (b)
 $Re=2.50 \times 10^4$ and (c)
 $Re=2.54 \times 10^4$.

Wall pressure and phase portraits as a function of Reynolds number, from  $Re=2.58 \times 10^4$ to
 $Re=2.66 \times 10^4$. The pressure fluctuations are obtained at
 $x/c=0.70$ (——, blue),
 $x/c=0.80$ (——, orange) and
 $x/c=0.90$ (——, yellow); (a)
 $Re=2.58 \times 10^4$, (b)
 $Re=2.62 \times 10^4$ and (c)
 $Re=2.66 \times 10^4$.

The time series and phase portraits illustrate periodic, quasi-periodic and chaotic behaviour. In this view, considering values of  $Re$ below
 $2.38 \times 10^4$, the flow has periodic oscillations for the three considered positions, with phase portraits showing a closed circuit. By lowering the Reynolds number, figure 3 shows that this limit cycle originates at a Hopf bifurcation that takes place at
 $Re = 4 \times 10^3$. This transition corresponds to the type of bifurcation where a fixed point (the steady laminar solution) starts to display an oscillatory unstable mode, and consequently, a stable limit cycle emerges from the solution (Paul et al. Reference Paul, Verma, Wahi, Reddy and Kumar2012). As the increase in the limit cycle amplitude is gradual, as shown in figure 3, this transition can be further characterized as a supercritical Hopf bifurcation (Alligood, Sauer & Yorke Reference Alligood, Sauer and Yorke1996), thus representing the first instability of the laminar solution, which displays a laminar separation wake at the suction side. In this regime, the system displays periodic behaviour, with vortex shedding near the separation point.
Between  $Re=2.38 \times 10^4$ and
 $Re=2.42 \times 10^4$, the behaviour of the system becomes quasi-periodic, as observed in the phase portrait in figure 4(c). This feature can be related to the presence of a separation wake that oscillates and modulates the pressure fluctuations in amplitude (Ricciardi et al. Reference Ricciardi, Arias-Ramirez and Wolf2020). The quasi-periodicity is more marked for downstream locations closer to the trailing edge. The dynamics thus transitions from a limit cycle to a torus, as illustrated in figure 5, in a secondary Hopf bifurcation, as seen in other studies (Kashinath, Waugh & Juniper Reference Kashinath, Waugh and Juniper2014; Lustro et al. Reference Lustro, Kawahara, van Veen, Shimizu and Kokubu2019; Cavalieri, Rempel & Nogueira Reference Cavalieri, Rempel and Nogueira2022). The emergence of quasi-periodic behaviour is related to a periodic solution that becomes unstable. Stability analysis in these cases is done using Floquet theory, and the emergence of quasi-periodicity occurs when two complex conjugate Floquet multipliers become unstable, leading to the appearance of a torus with two incommensurate frequencies (Guckenheimer & Holmes Reference Guckenheimer and Holmes2013).
It becomes evident that, for the present configuration, the flow dynamics experiences a transition from periodic to quasi-periodic, for  $Re$ between
 $2.38 \times 10^4$ and
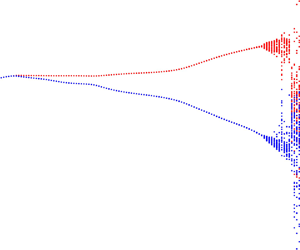
 $2.42 \times 10^4$. A further increase of the Reynolds number suggests a chaotic dynamics, as shown in figure 7. To interpret the pressure results in figures 4, 6 and 7, a bifurcation map is obtained using the local maximum (minimum) for each simulation
 $Re$ (Kreilos & Eckhardt Reference Kreilos and Eckhardt2012). We can track the evolution of the results as this parameter is changed. A periodic solution becomes a point in the local maximum (minimum), and quasi-periodic and chaotic attractors appear as dense regions due to the difference in the maximum (minimum) peaks. By plotting the local maximum (minimum) results as a function of
 $Re$, one may track the changes in behaviour as the Reynolds number is increased. The bifurcation map is obtained in figure 8, showing three distinctive regions, i.e. periodic, quasi-periodic and chaotic. Based on the bifurcation map and the results discussed earlier, it is clear that, for Reynolds less than
 $2.38 \times 10^4$, the flow behaves periodically, appearing with a single point, or period-1, in the Poincaré section. On the other hand, for
 $Re=2.42 \times 10^4$, the bifurcation map spreads, with each
 $Re$ occupying a line in the maximum (minimum) local. The tori illustrated in figures 4, 6 and 7 appear in the Poincaré section as a line segment, where the peaks vary in a delimited region. For further increases of
 $Re$, the pressure fluctuation near the trailing edge starts behaving chaotically, as will be more fully explored next.
Bifurcation map from  $Re=3.2 \times 10^3$ to
 $Re=2.70 \times 10^4$ obtained using the local maximum (——, red) and minimum (——, blue) of the pressure fluctuations; The analysis presented is focused between
 $Re=2.32 \times 10^4$ and
 $Re=2.52 \times 10^4$.

3.2. Investigation of chaotic behaviour
To evaluate whether a given behaviour is quasi-periodic or chaotic, we apply an infinitesimal disturbance to the initial condition of the simulation to track if the reference and the disturbed case will diverge as time advances. This is accomplished for the simulation cases of  $Re=2.42 \times 10^4$ and
 $Re=2.62 \times 10^4$, with initial disturbances of the norm equal to
 $10^{-11}$. This was carried out by taking the vector
 $\boldsymbol {q}$ of flow properties (the properties are
 $\rho, \rho u, \rho v$ and
 $e$, respectively density,
 $x$ and
 $y$ momentum components and total energy), and disturbing it as
 \begin{equation} \boldsymbol{q}_d = (1 + d) \boldsymbol{q}. \end{equation}
The disturbed variables  $\boldsymbol {q}_d$ are used to start a new simulation, with
 $d=1 \times 10^{-11}$. By tracking the evolution of the
 $L_2$-norm of the difference between original and disturbed simulations, we may detect sensitivity to small disturbances of the initial conditions and thus characterize if the system is chaotic.
In figure 9, we show the difference of the pressures over the suction side, using the  $L_2$-norm. The results show that, for
 $Re=2.42 \times 10^4$, the difference between the two solutions remains bounded, displaying that the system is still in the quasi-periodic behaviour. For
 $Re=2.62 \times 10^4$, we can see an exponential growth of the perturbations, showing a sensitivity to the initial conditions that characterizes chaos.
The  $L_2$-norm over the suction side, the difference between the not disturbed pressure case (
 $p$) and disturbed pressure case (
 $p_d$) of
 $Re=2.42 \times 10^4$ (——, blue) and
 $Re=2.62 \times 10^4$ (——, orange).

3.3. Pressure auto-spectral density
As discussed in the earlier sections, the system transitions from periodic to quasi-periodic between  $Re=2.38 \times 10^4$ and
 $Re=2.42 \times 10^4$, as shown by the pressure fluctuations and phase portraits of figure 4. The system goes from a stable period-1 limit cycle to a quasi-periodic attractor (Cavalieri et al. Reference Cavalieri, Rempel and Nogueira2022). We will now evaluate how such a transition affects the auto-spectral densities of pressure fluctuations, which start to display additional peaks corresponding to secondary tones. They are computed using segments of 4000 snapshots overlapped by 90 % with a rectangular window.
If we take the auto-spectral density of the pressure signal and track the evolution of the system, one observes the presence of one dominant frequency and its harmonics,  $f_1 \approx 0.78$, for all Reynolds numbers, and another incommensurable frequency
 $f_2 \approx 0.34$ emerging at
 $Re=2.42 \times 10^4$, which supports the quasi-periodicity pattern of the problem (Alligood et al. Reference Alligood, Sauer and Yorke1996), as shown in figure 10. The first frequency can be related to coherent structures scattering at the trailing edge and radiating acoustic fluctuations (Ffowcs Williams & Hall Reference Ffowcs Williams and Hall1970; Yarusevych et al. Reference Yarusevych, Sullivan and Kawall2006; Sanjose et al. Reference Sanjose, Towne, Jaiswal, Moreau, Lele and Mann2019; Sano et al. Reference Sano, Abreu, Cavalieri and Wolf2019). When the system becomes quasi-periodic with these two frequencies,
 $f_1$ and
 $f_2$, nonlinear interactions between such frequencies lead to the occurrence of several other tones; such nonlinear interactions among tones were detected by Padois et al. (Reference Padois, Laffay, Idier and Moreau2016) via a bi-coherence analysis. It is possible to obtain the frequencies of other tones using the linear relation
 $a f_1 + b f_2$, with
 $a$ and
 $b$ integers shown in figures 10(c)–10(g) (Eckmann & Ruelle Reference Eckmann and Ruelle1985), as usual in quasi-periodic behaviour.
The power spectral density (PSD) of the wall-pressure function of Reynolds number at  $x/c=0.80$ (——, black) and the acoustic pressure at
 $x/c=0.50$ and
 $y/c=1.00$ (——, red); (a) shows the dominant frequency,
 $f_1 \approx 0.78$, and its harmonics; these dominant frequencies are present in (a)–(h); (c) shows the related quasi-periodic attractor PSD for
 $Re=2.42 \times 10^4$, with one new incommensurable frequency
 $f_2 \approx 0.34$; The case
 $Re=2.50 \times 10^4$ shows another incommensurable frequency
 $f_3 \approx 0.24$ in the simulation; (a)
 $Re=2.34 \times 10^4$, (b)
 $Re=2.38 \times 10^4$, (c)
 $Re=2.42 \times 10^4$, (d)
 $Re=2.46 \times 10^4$, (e)
 $Re=2.50 \times 10^4$, (f)
 $Re=2.54 \times 10^4$, (g)
 $Re=2.58 \times 10^4$, (h)
 $Re=2.62 \times 10^4$ and (i)
 $Re=2.66 \times 10^4$.

The results emphasize that the secondary tones are related to the quasi-periodic behaviour, with nonlinear interactions between the frequencies  $f_1$ and
 $f_2$ that emerge from two Hopf bifurcations. The appearance of quasi-periodic behaviour thus leads to these various tones, which have undesirable effects in terms of noise radiation.
In figure 10(e), another frequency appears, named here  $f_3$; this frequency is incommensurable with the previous ones and is present in figures 10(e)–10(h). This can be related to the route to chaos, revealed when we consider the result of the phase portrait from the flow configuration depicted in figure 10(h) and the related
 $L_2$-norm divergence between the reference and disturbed cases shown in figure 9. The presence of this third frequency and the evolution of flow dynamics behaviour can be associated with the Ruelle–Takens–Newhouse route to chaos (Paul, Wahi & Verma Reference Paul, Wahi and Verma2011; Paul et al. Reference Paul, Verma, Wahi, Reddy and Kumar2012; Kashinath et al. Reference Kashinath, Waugh and Juniper2014) and is a possible mechanism for how additional tertiary frequencies emerge from the present case.
4. Conclusions
In the present study, we analyse the problem of a two-dimensional direct numerical simulation of a NACA 0012 airfoil at  $M=0.3$ and
 $AoA=3^\circ$ (Ricciardi et al. Reference Ricciardi, Arias-Ramirez and Wolf2020) employing dynamical systems theory to track how the system evolves as the Reynolds number increases. The problem is simulated from
 $Re=3.2 \times 10^3$ to
 $Re=2.70 \times 10^4$, where each simulation is started from the final state of the previous one. With this approach, we may track the emergence of tones in the pressure spectra and relate these to the underlying dynamics.
The results show that the increase of Reynolds number leads to chaos via quasi-periodicity (Eckmann & Ruelle Reference Eckmann and Ruelle1985). A limit cycle, emerging from a Hopf bifurcation, becomes unstable at  $Re \sim 2.38 \times 10^4$, leading to a quasi-periodic attractor with two incommensurate frequencies, which is characterized as a torus in the phase portrait. This leads to the emergence of secondary tones in the pressure spectra, both on the wall and in the acoustic field, due to the nonlinear iteration between the two incommensurate frequencies,
 $f_1$ and
 $f_2$. A third frequency appears after a further increase of
 $Re$, which is related to chaotic behaviour due to the exponential growth in time of infinitesimal disturbances of an initial condition. This characterizes a transition to chaos via the Ruelle–Takens–Newhouse route (Ruelle & Takens Reference Ruelle and Takens1971; Newhouse, Ruelle & Takens Reference Newhouse, Ruelle and Takens1978).
This provides a theoretical basis for the emergence of secondary tones in airfoil noise at low and moderate Reynolds numbers, which appear through the limit cycle and torus instabilities. As these tones are still observed in experiments at Reynolds numbers much higher than the ones studied in this work (Pröbsting et al. Reference Pröbsting, Scarano and Morris2015), it is conjectured that the chaotic signatures reviewed here persist at much higher  $Re$, provided that at least one of the airfoil boundary layers remains in a transitional state. Techniques targeting the low
 $Re$ limit cycle or torus may thus effectively reduce the tonal noise of airfoils.
Acknowledgements
The authors thank Dr R.F. Miotto for his support with the numerical simulations used in this work.
Funding
This work was supported by CNPq grant nos 313225/2020-6 and 407618/2022-8.
Declaration of interests
The authors report no conflict of interest.
Author contributions
All authors contributed equally to analysing data and reaching conclusions, and in writing the paper.



